Draw a graph showing the variation of the gravitational acceleration due to the Earth with depth and altitude.
To draw a graph showing the variation of gravitational acceleration due to the Earth with depth and altitude, we can follow these steps:
Step 1: Understand the formulas for gravitational acceleration
- For depth d below the Earth's surface:
gd=g(1−dR)
where g is the gravitational acceleration at the surface and R is the radius of the Earth.
- For height h above the Earth's surface:
gh=gRR+h
Step 2: Identify key points for depth
- At d=0 (surface), gd=g.
- At d=R4, gd=g(1−14)=3g4.
- At d=R2, gd=g(1−12)=g2.
- At d=R (center), gd=g(1−1)=0.
Step 3: Identify key points for altitude
- At h=0 (surface), gh=g.
- At h=R, gh=gR2R=g2.
- At h=2R, gh=gR3R=g3.
- At h=3R, gh=gR4R=g4.
- At h=4R, gh=gR5R=g5.
Step 4: Plot the graphs
1. Depth graph:
- On the x-axis, plot depth d from 0 to R.
- On the y-axis, plot gd from g to 0.
- The graph will be a straight line decreasing from g to 0.
2. Altitude graph:
- On the x-axis, plot height h starting from 0 to 4R.
- On the y-axis, plot gh starting from g and decreasing towards 0.
- The graph will be a curve that decreases more steeply as h increases.
Step 5: Label the graphs
- Clearly label the depth graph as "Gravitational Acceleration vs Depth" and the altitude graph as "Gravitational Acceleration vs Altitude".
- Indicate the points where gd and gh are equal to g, g2, g3, etc.
Final Graph
- Combine both graphs on the same set of axes for clarity, ensuring to distinguish between the depth and altitude variations.
- For depth d below the Earth's surface:
gd=g(1−dR)
where g is the gravitational acceleration at the surface and R is the radius of the Earth.
gh=gRR+h
- At d=0 (surface), gd=g.
- At d=R4, gd=g(1−14)=3g4.
- At d=R2, gd=g(1−12)=g2.
- At d=R (center), gd=g(1−1)=0.
- At h=0 (surface), gh=g.
- At h=R, gh=gR2R=g2.
- At h=2R, gh=gR3R=g3.
- At h=3R, gh=gR4R=g4.
- At h=4R, gh=gR5R=g5.
1. Depth graph:
- On the x-axis, plot depth d from 0 to R.
- On the y-axis, plot gd from g to 0.
- The graph will be a straight line decreasing from g to 0.
- On the x-axis, plot height h starting from 0 to 4R.
- On the y-axis, plot gh starting from g and decreasing towards 0.
- The graph will be a curve that decreases more steeply as h increases.
- Clearly label the depth graph as "Gravitational Acceleration vs Depth" and the altitude graph as "Gravitational Acceleration vs Altitude".
- Indicate the points where gd and gh are equal to g, g2, g3, etc.
- Combine both graphs on the same set of axes for clarity, ensuring to distinguish between the depth and altitude variations.
Topper's Solved these Questions
- BOOK - NAVNEET PUBLICATION - MAHARASHTRA BOARDCHAPTER - SHORT ANSWER QUESTIONSEXERCISE - Oscillations2videos
SHORT ANSWER QUESTIONS
- BOOK - NAVNEET PUBLICATION - MAHARASHTRA BOARDCHAPTER - SHORT ANSWER QUESTIONSEXERCISE - Elasticity1videos
SHORT ANSWER QUESTIONS
- BOOK - NAVNEET PUBLICATION - MAHARASHTRA BOARDCHAPTER - QUESTION BANK 2021EXERCISE - Semiconductors Devices (Long Answer ( LA) ( 4 marks Each) )3videos
QUESTION BANK 2021
- BOOK - NAVNEET PUBLICATION - MAHARASHTRA BOARDCHAPTER - SOLVED PROBLEMS - I EXERCISE - ASSIGNMENTS24videos
SOLVED PROBLEMS - I
Similar Questions
Knowledge Check
- Question 1 - Select One
The diagram showing the variation of gravitational potential of earth with distance from the centre of earth is
A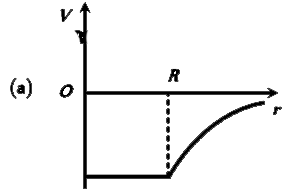 B
B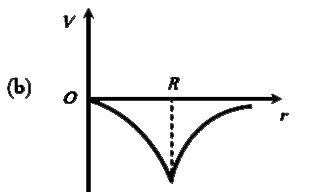 C
C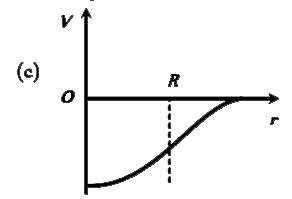 D
D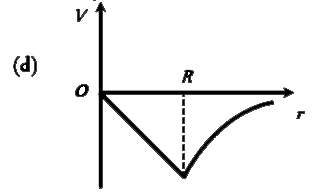
- Question 2 - Select One
The diagram showing the variation of gravitational potential of earth with distance from the centre of earth is
A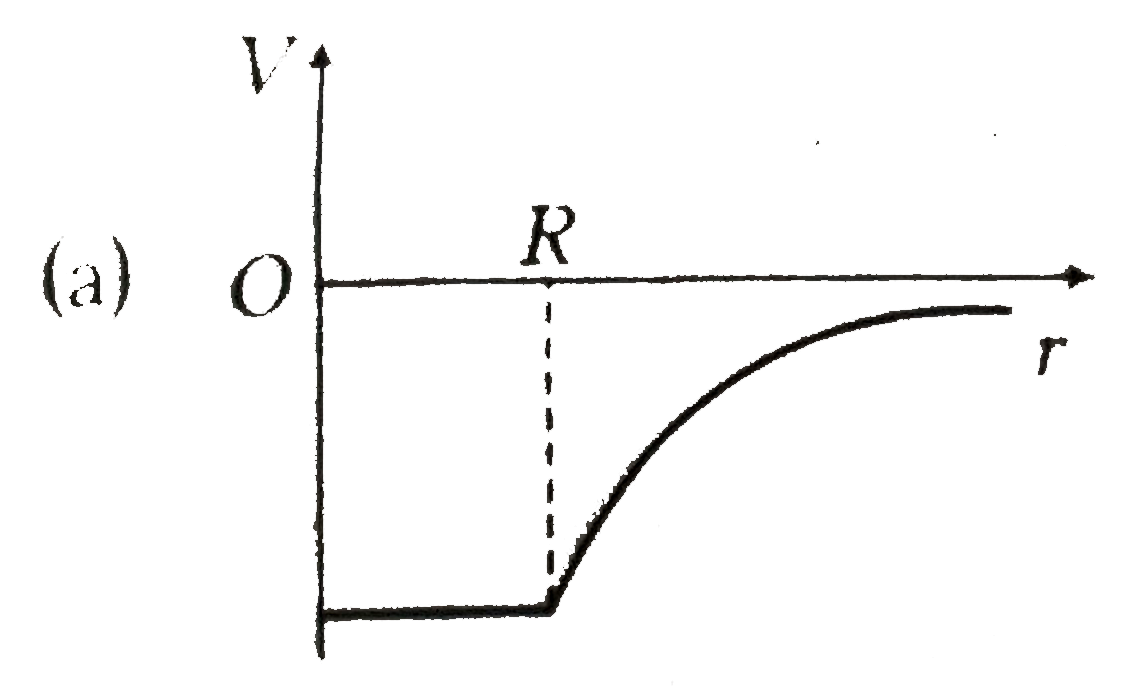 B
B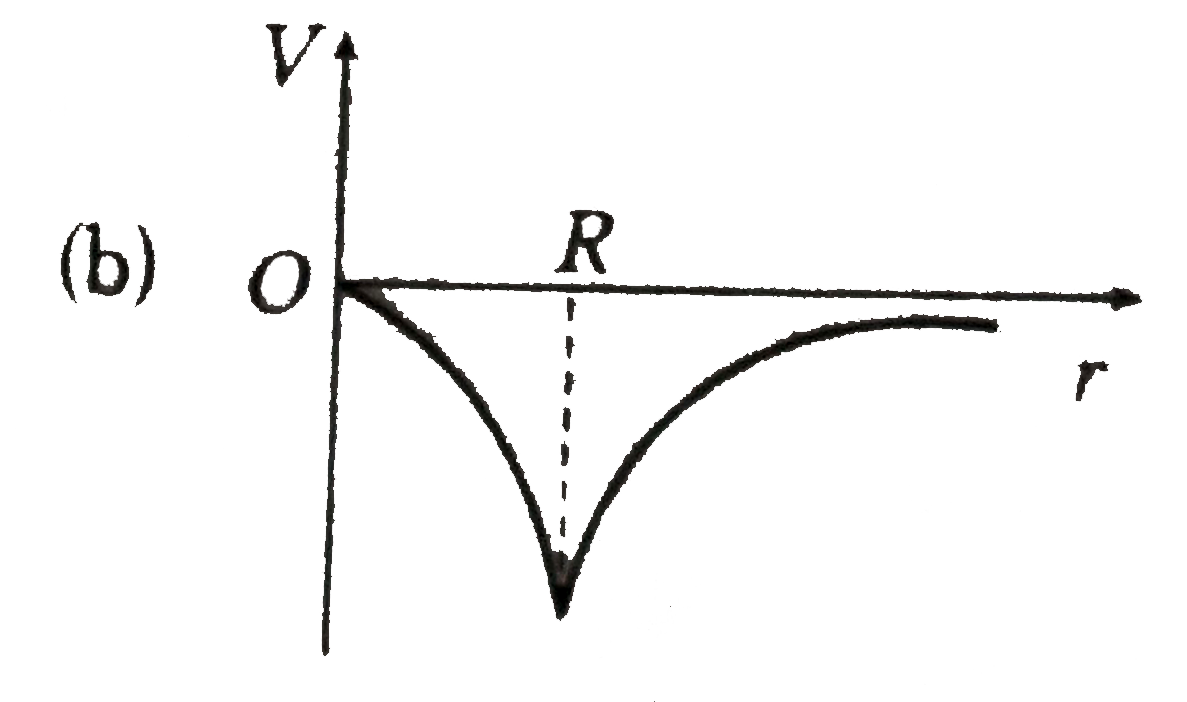 C
C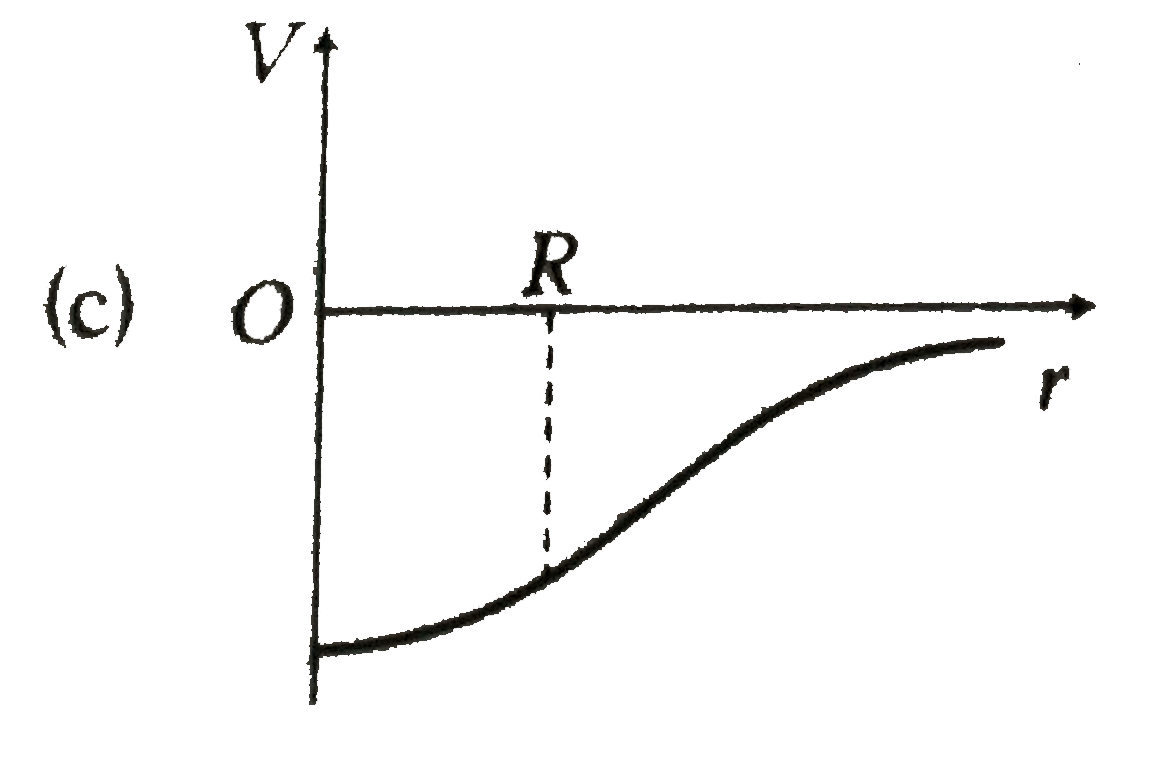 D
D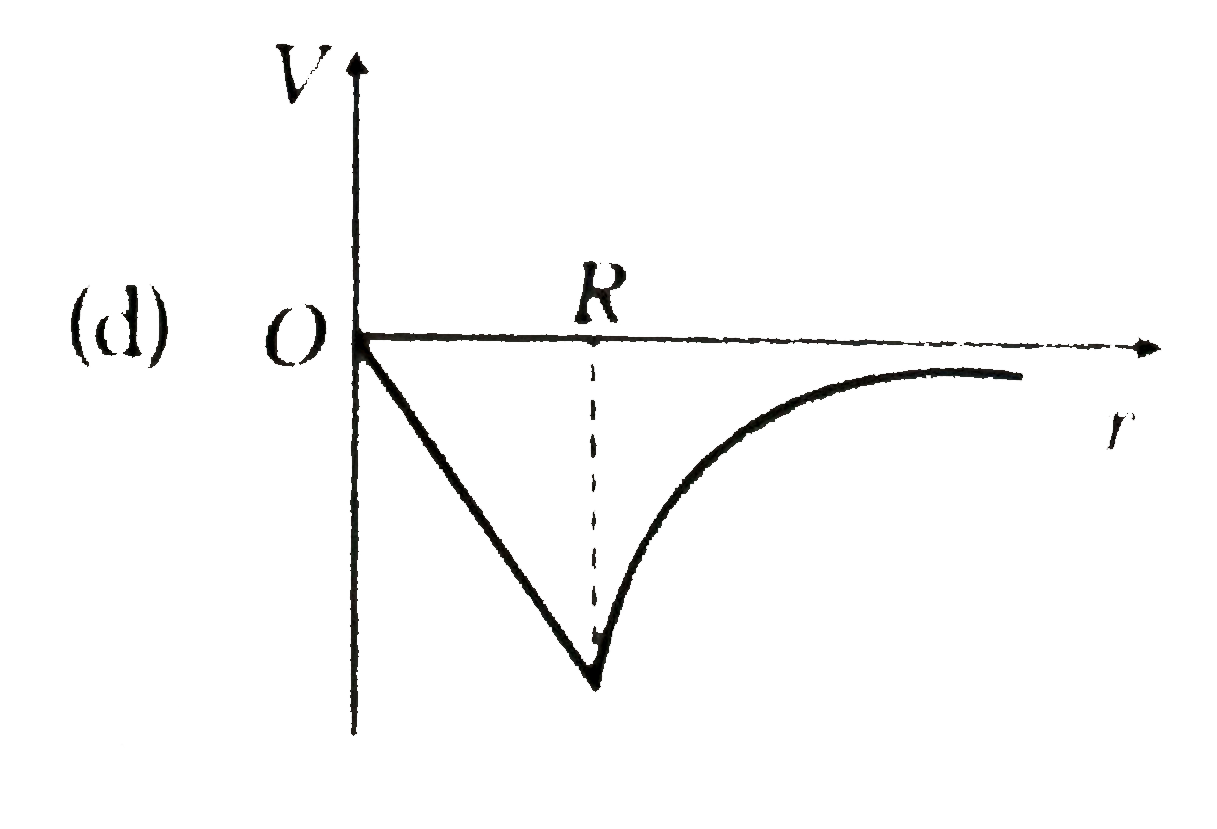
Gravitation - Acceleration Due To Gravity
View SolutionDraw graphs showing the variation of accleeration due to gravity with (a) height above the Earth's surface, (b) depth below the Earth's surface.
View SolutionDraw a graph showing the variation of decay rate with number of active nuclei.
View SolutionDraw a graph showing the variation of decay rate with number of active nuclei.
View SolutionEffect on gravitation acceleration due to rotation of earth and orbital motion
View SolutionUniversal gravitational constant and gravitational acceleration of the earth .
View Solution

