A panel of planning commission experts to discuss the infrastructural needs for the years to come. Will the number of people belonging to different age groups help them? Explain how.
The relative proportion of the individuals of various age groups, in a population is called the age structure. Based on the distribution of age groups in the population, the population is of three different types, viz. growing, steady or declining.
If the population consists of large number of pre-reproductive age groups, then such population grows with a rapid rate. If the pre-reproductive and reproductive groups are same then the population growth remains steady. By if the population has large number of post-reproductive group and small number of pre-reproductive group then the population shows declining rate.
Therefore, the planning commission will have to take into consideration whether the population is growing, steady or declining which is based on number of people belonging to different age groups. This data will help them to discuss the infrastructural needs for the years to come.
Topper's Solved these Questions
- SHORT ANSWER QUESTIONS -I BOOK - NAVNEET PUBLICATION - MAHARASHTRA BOARDCHAPTER - SHORT ANSWER QUESTIONS -I EXERCISE - Chapter 18 : Human Reproduction
7 Videos
- QUESTION BANK 2021BOOK - NAVNEET PUBLICATION - MAHARASHTRA BOARDCHAPTER - QUESTION BANK 2021EXERCISE - CHAPTER 15 (4 marks)
1 Videos
- SHORT ANSWER QUESTIONS -IIBOOK - NAVNEET PUBLICATION - MAHARASHTRA BOARDCHAPTER - SHORT ANSWER QUESTIONS -IIEXERCISE - Additional Important Questions for Self-practice
7 Videos
Similar Questions
Some people of a society decorated their area with flags and tricolour ribbons on Republic Day .The following data shows the number of person in different age groups who participated in the decoration :
Age in years 5−1515−2525−3535−4545−5555−65Number of patients 6 11 21 23 14 5
Find the mode of the above data.
What values do these persons possess ?
View SolutionA study was made for the number of persons of different age group visited in a library in a week which is shown in the histogram. Study the histogram and answer the question given below.
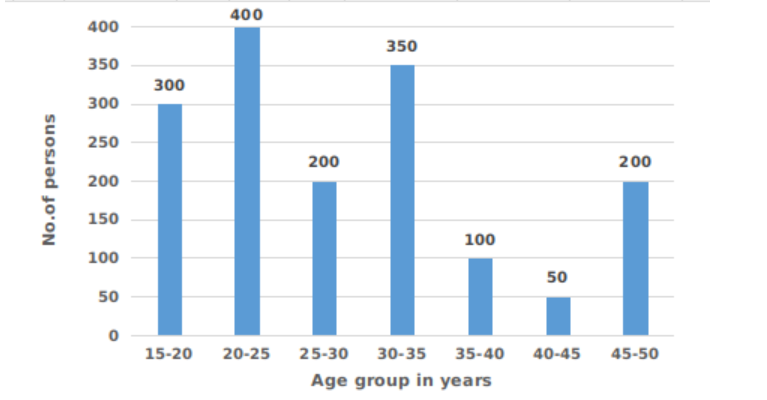
The ratio of the number of persons in the age groups 15-20 years and 20-25 years together, to the number of persons in the age groups 30-35 years and 35-40 years together, is:
View Solution
Knowledge Check
___ means the number of people in different age groups in a given population.
AAge limitBAge structureCOverage limitDNone of theseThe table shows the percentage of total population of a city in different age groups. Study the table and answer the questions.
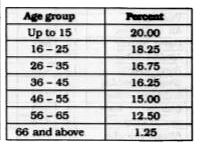
If the difference between the number of people in the age groups (46 - 55) and (16 - 25) is 0.975 million, then the total population (in millions) of the city isA27B30C22D25The table shows the percentage of total population of a city in different age groups. Study the table and answer the questions.
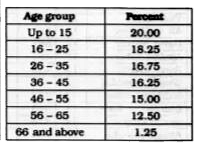
If there are 22 million people below 26 years, then the number of people (in millions) in the age group (56 - 65) isA5B5.5C3D3.5
An element X belongs to group 2 and another element Y belongs to group 15 of the periodic table:
(a) What is the number of valence electrons in X? (b) What is the valency of X?
(c) What is the number of valence electrons in Y? (d) What is the valency of Y?
Explain how you have arrived at your answers.
View SolutionStudy the following histogram and answer the given question.
A study was made for the number of persons of different age group visited in a library in a week which is shown in given in the histogram. Study the histogram and answer the question given below.
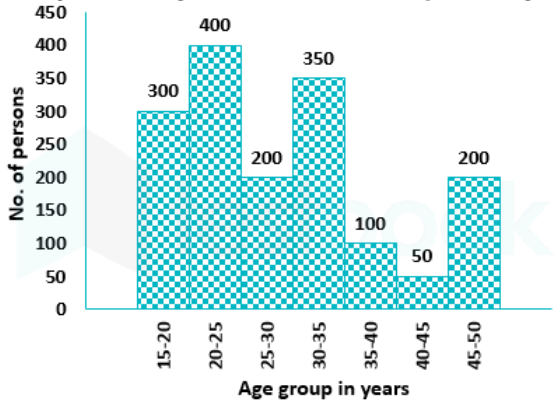
What percent of the total number of persons visiting library in the week was the number of persons of age group 25-30 years?
View SolutionA table showing the percentage of the total population of a State by age groups for the year 1991 is given below. Answer the questions given below it.
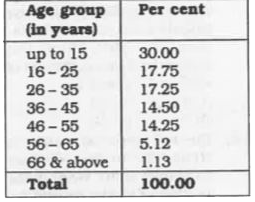
If there are 10 millions people in the age group 56 years and above, what is the difference between the numbers of people in the age groups 16-25 and 46-55?
View SolutionA table showing the percentage of the total population of a State by age groups for the year 1991 is given below. Answer the questions given below it.
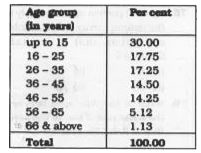
If there are 10 millions people in the age group 56 years and above, what is the difference between the number of people in the age group 16 - 25 and 46 - 55 ?
View SolutionRead the passage given below and answer the questions that follow:
In a club of 30 people, all of them belong to at least one group - Chess, Drama and Art.
6 people belong only to the Art group.
5 people belong to all the three groups.
2 people have joined the Chess and the Art group but not the Drama group.
15 people belong to the Art group.
2 people have joined only the Chess group.
3 people have joined only the Drama group.
How many people have belong to the Chess group?
A. 21
B. 13
C 19
D. 20
View Solution
