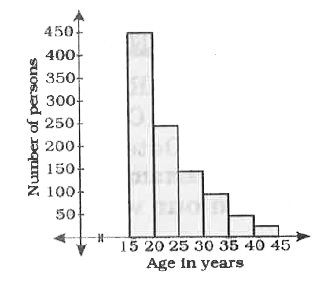
Study the following histogram and answer the given question.
A study was made for the number of persons of different age group visited in a library in a week which is shown in given in the histogram. Study the histogram and answer the question given below.
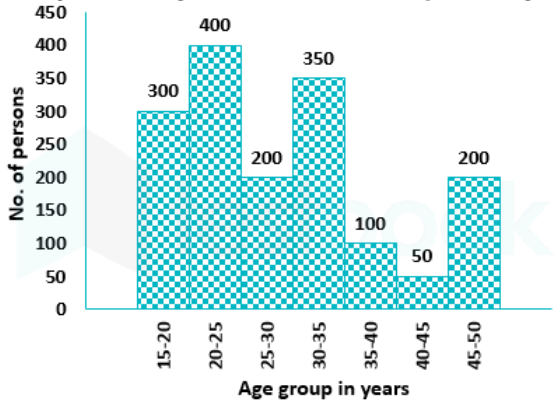
What percent of the total number of persons visiting library in the week was the number of persons of age group 25-30 years?
12.5%
12%
10.5%
15%
The correct Answer is:A
Step by step video & image solution for Study the following histogram and answer the given question. A study was made for the number of persons of different age group visited in a library in a week which is shown in given in the histogram. Study the histogram and answer the question given below. What percent of the total number of persons visiting library in the week was the number of persons of age group 25-30 years? by Maths experts to help you in doubts & scoring excellent marks in Class 14 exams.
Updated on:21/07/2023Similar Questions
A study was made for the number of persons of different age groups visited in a library in a week which is shown in the histogram. Study the histogram and answer the questions given below. What percentage of the total number of persons visiting the library in the week was the number of persons of age group 25-30 years?
एक सप्ताह में एक पुस्तकालय में जाने वाले विभिन्न आयु समूहों के व्यक्तियों की संख्या के लिए एक अध्ययन किया गया था जो हिस्टोग्राम में दिखाया गया है। हिस्टोग्राम का अध्ययन करें और नीचे दिए गए प्रश्नों के उत्तर दें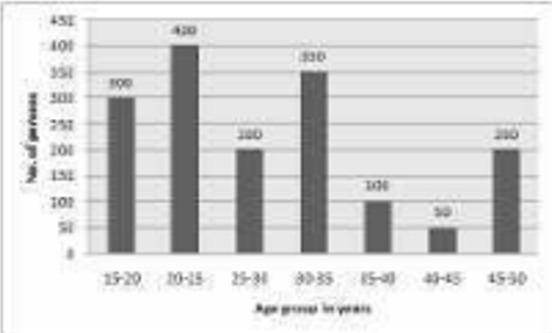
सप्ताह में पुस्तकालय जाने वाले व्यक्तियों की कुल संख्या का कितना प्रतिशत 25-30 वर्ष आयु वर्ग के व्यक्तियों की संख्या थी
View SolutionA study was made for the number of persons of different age group visited in a library in a week which is shown in the histogram. Study the histogram and answer the question given below.
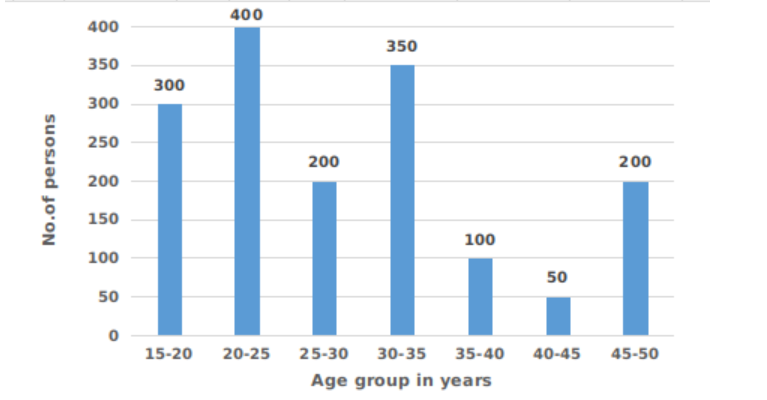
The ratio of the number of persons in the age groups 15-20 years and 20-25 years together, to the number of persons in the age groups 30-35 years and 35-40 years together, is:
View Solution
Knowledge Check
Observe the histogram and answer the questions given below.
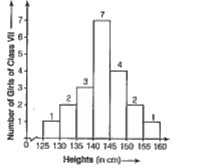
Which group contains maximumA(140-145)B(135-140)C(130-135)D(145-150)Study the following histogram and answer the questions.
The ratio of the number of persons between the age group of 20 - 25 and 30 - 35 is :A1:3B2:1C10:3D5:2Observe the histogram and answer the questions given below.
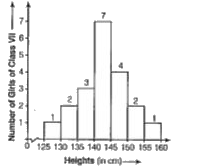
Which groups contain minimum girls?A(130-135) and (155-160)B(125-130) and (155-160)C(125-130) and (136-140)D(135-140) and (155-160)
Study the following histogram and answer the questions.
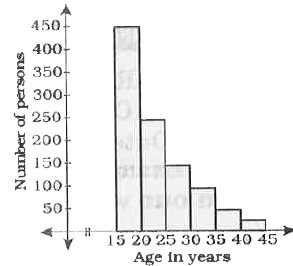
The total number of persons in the age group of 15 years to 45 years is :
View SolutionStudy the following histogram and answer the questions.
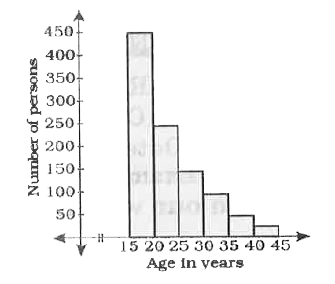
The number of persons in the age group 20 - 30 years is :
View SolutionStudy the given diagram and answer the question given below:
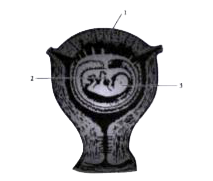
Gestation period in human is:
View SolutionStudy the following Histogram and answer the following questions.
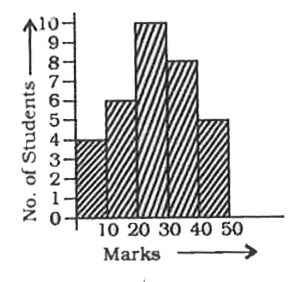
The total number of students involved in the data is
View SolutionStudy the following Histogram and answer the following questions.
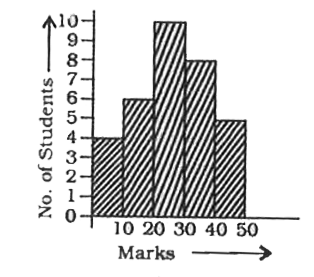
The least number of students got the marks in the interval
View Solution
