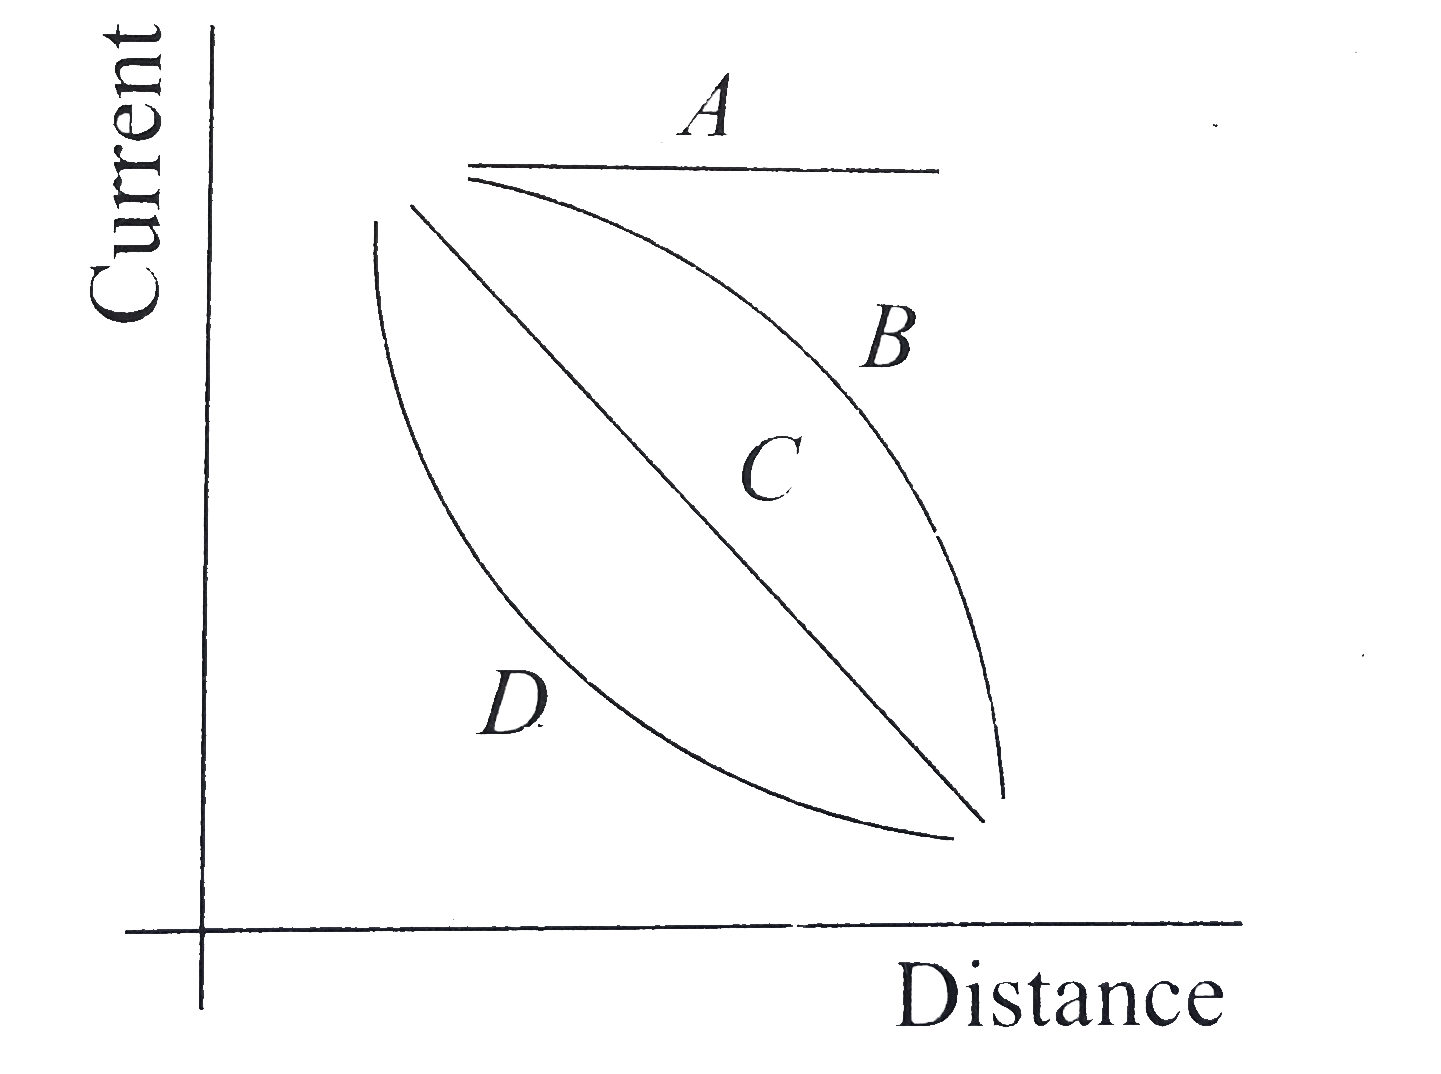
A point source causes photoelectric effect from a small metal plate. Which of the curves in Fig. may represent the saturation photo-current as a function of the distance between the source and the metal?
The correct Answer is:D
Step by step video, text & image solution for A point source causes photoelectric effect from a small metal plate. Which of the curves in Fig. may represent the saturation photo-current as a function of the distance between the source and the metal? by Physics experts to help you in doubts & scoring excellent marks in Class 12 exams.
Updated on:21/07/2023Topper's Solved these Questions
- PHOTO ELECTRIC EFFECT AND WAVE PARTICLE DUALITYBOOK - HC VERMACHAPTER - PHOTO ELECTRIC EFFECT AND WAVE PARTICLE DUALITYEXERCISE - Objective 2
7 Videos
- PHOTO ELECTRIC EFFECT AND WAVE PARTICLE DUALITYBOOK - HC VERMACHAPTER - PHOTO ELECTRIC EFFECT AND WAVE PARTICLE DUALITYEXERCISE - Exercises
33 Videos
- PHOTO ELECTRIC EFFECT AND WAVE PARTICLE DUALITYBOOK - HC VERMACHAPTER - PHOTO ELECTRIC EFFECT AND WAVE PARTICLE DUALITYEXERCISE - Short Answer
13 Videos
- PERMANENT MAGNETSBOOK - HC VERMACHAPTER - PERMANENT MAGNETSEXERCISE - Exercises
25 Videos
- PHOTOMETRYBOOK - HC VERMACHAPTER - PHOTOMETRYEXERCISE - Exercises
16 Videos
Similar Questions
A point source of light is used in a photoelectric effect. If the source is removed farther from the emitted metal, the stopping potential
View SolutionThe collector plate in an experiment on photoelectric effect is kept vertically above the emitter plate. Light source is put on and a saturation photo current is recorded. An electric field is switched on which has a vertically downward direction
View Solution
Knowledge Check
A point source causes photoelectric effect from a small metal plate. Which of the following curves may represent the saturation photocurrent as a function of the distance between the source and the metal?
A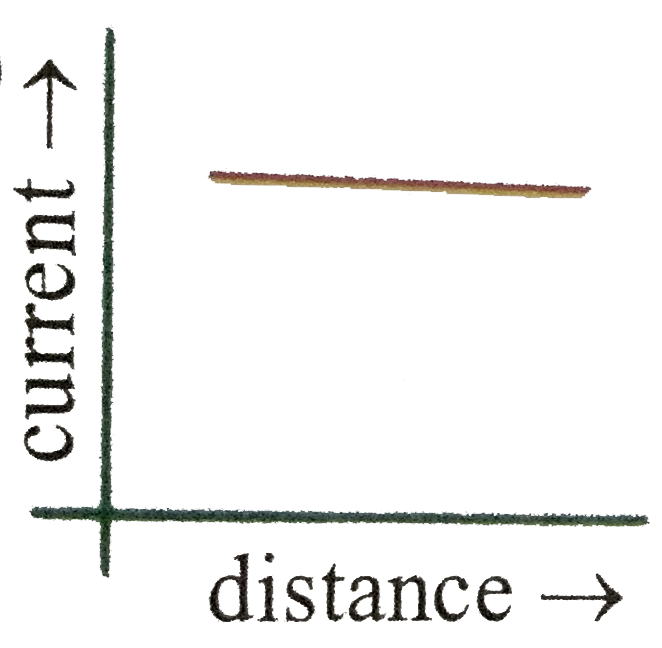 B
B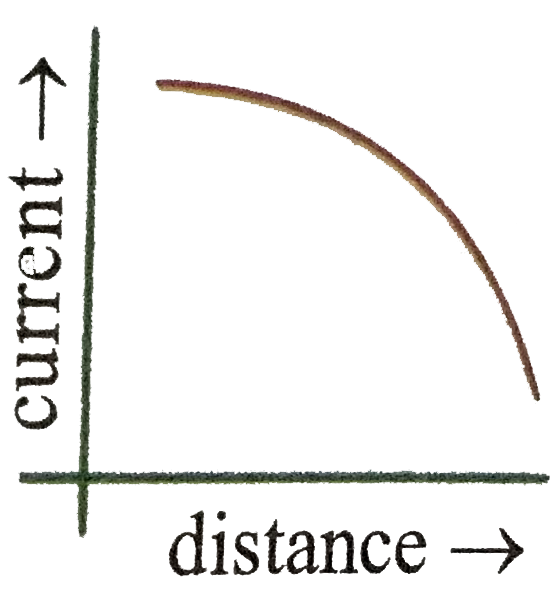 C
C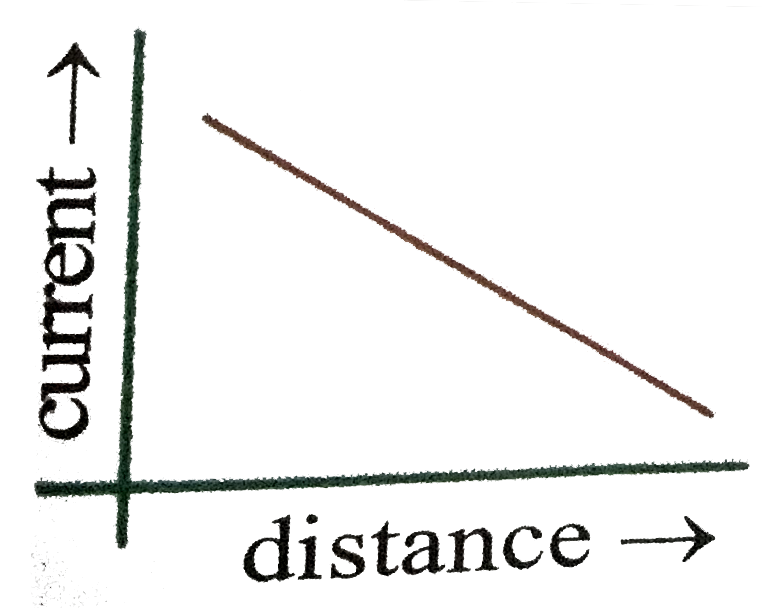 D
D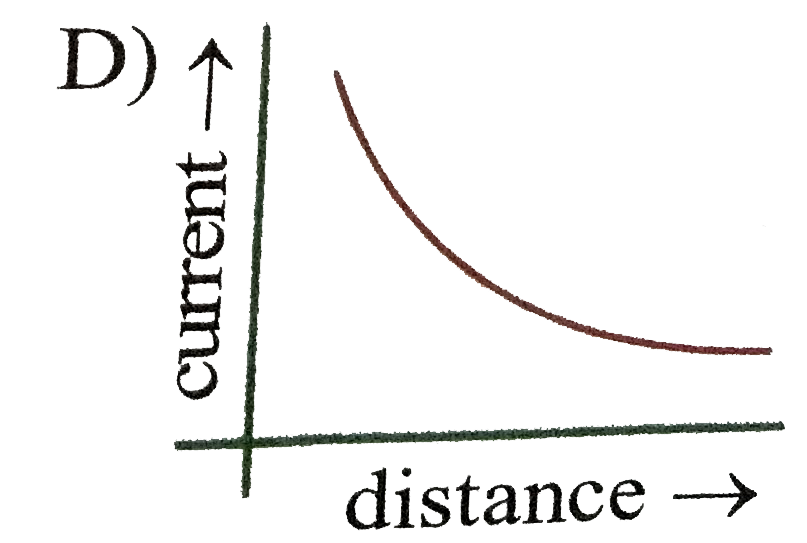
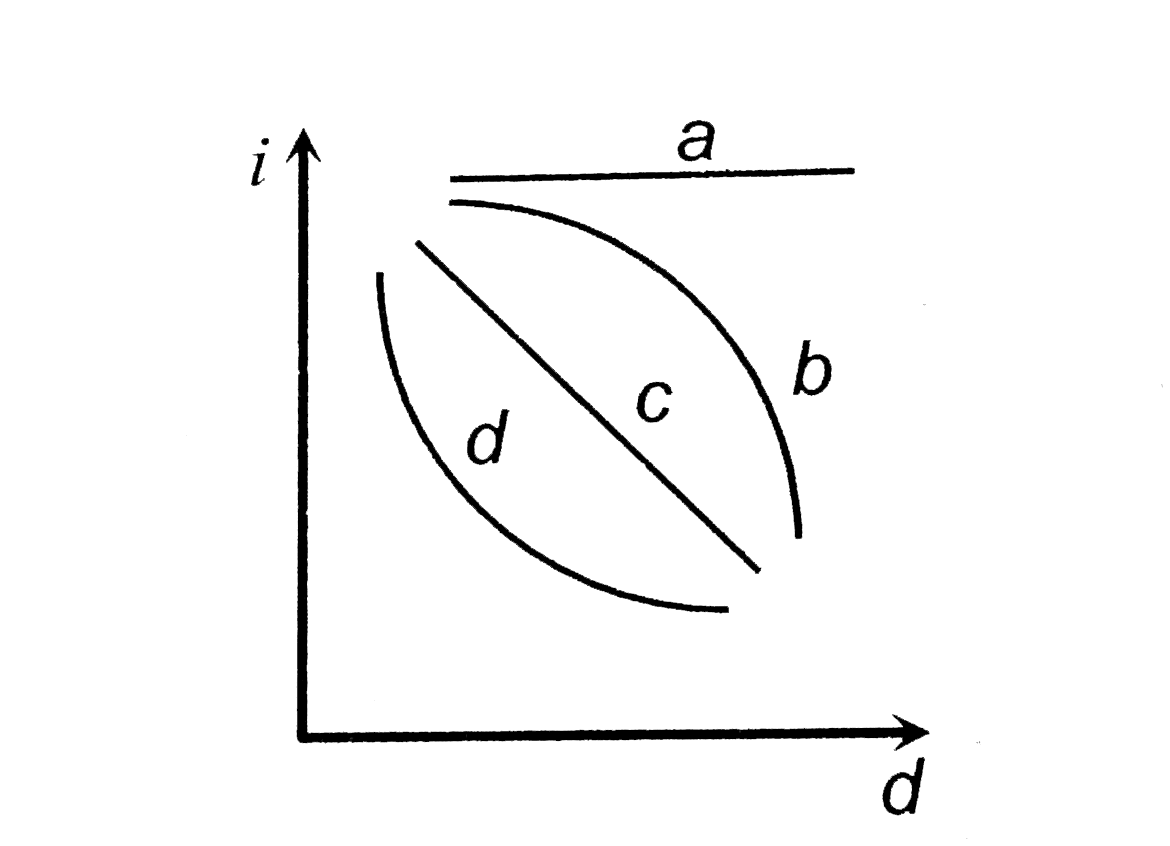
A point source of light is used in an experiment on photoelectric effect . Which of the following curves best represents the variation of photo current (i) with distance (d) of the source from the emitter?
 AaBbCcDd
Threshold frequency for photoelectric effect from a metal surface of work function 4.5 eV is
A1.1×109HzB540 HzC1.1×1015 HzDNone of these
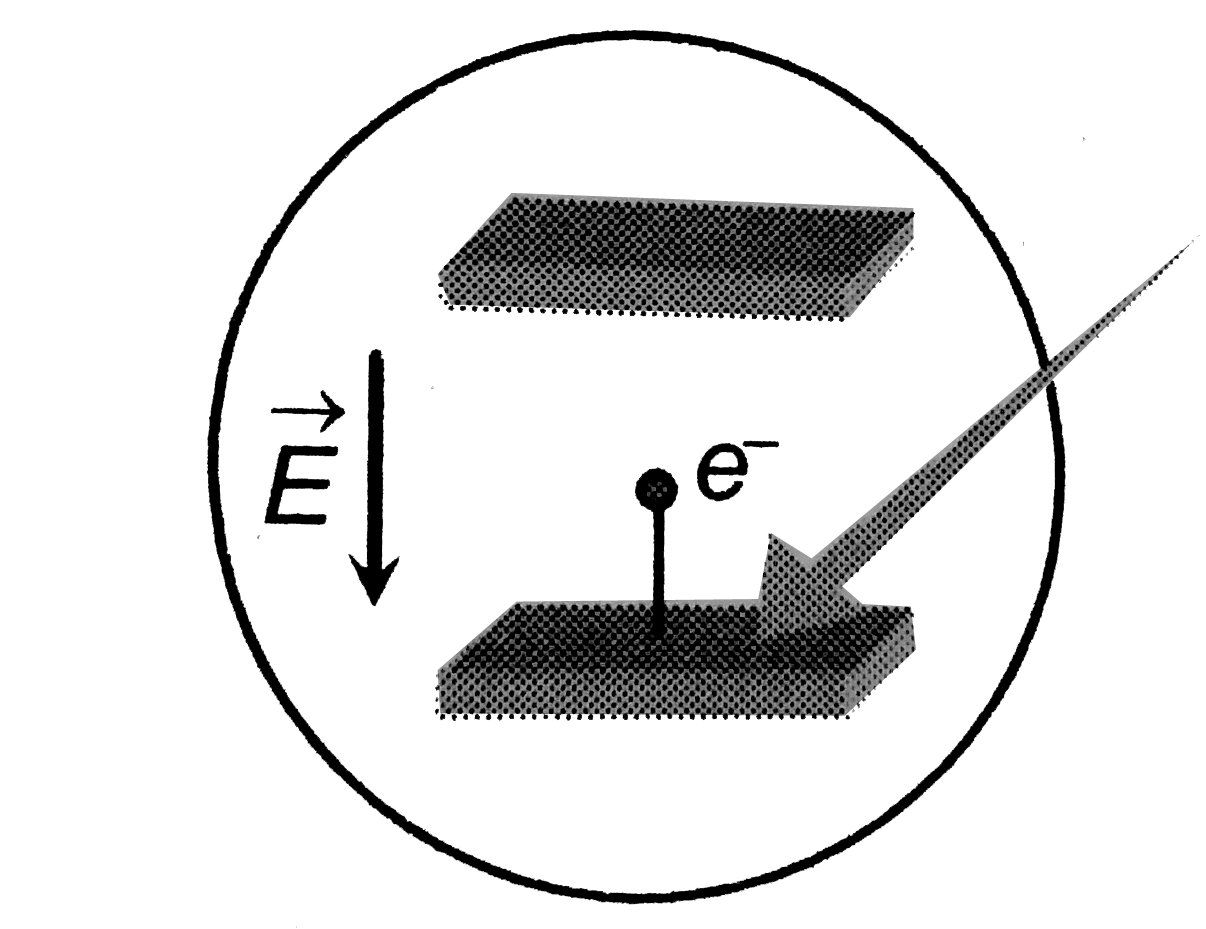
The anode plate in an experiment on photoelectric effect is kept vertically above the cathode plate. Light source is put on and a saturation photocurrent is recorded. An electric field is switched on which has vertically downward direction
View SolutionThe collector plate in an experiment on photoelectric effect is kept vertically above the emitter plate . Light source is put on and a saturation photo current is recorded . An electric field is switched on which has a vertically downward direction . Then
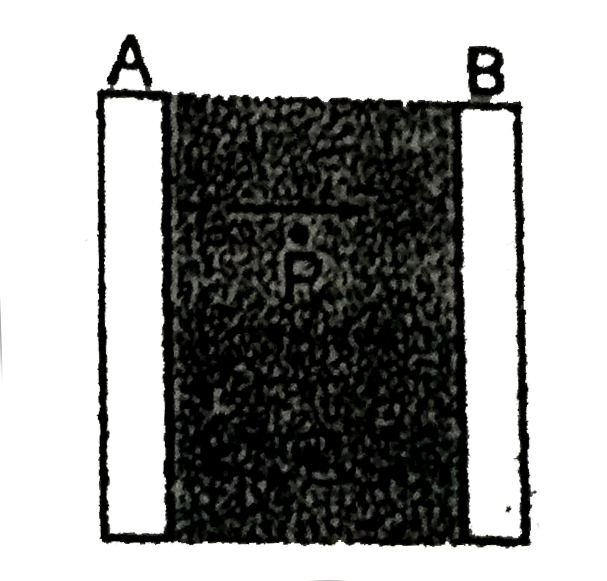
View SolutionThe figure shown represents the electric field between two large metal plates. Which of the graphs given in figure represents the force on a positve charge as it moves from point P towards plate B?
View SolutionThe collector plate in an experiment on photoelectric effect is kept vertically above the emitter plate . Light source is put on and a saturation photo current is recorded . An electric field is switched on which has a vertically downward direction . Then

View SolutionThe collector plate in an experiment of photoelectric effect is kept vertical above the emitter plate. Light source is put on, and a saturation photocurrent is recorded. An electric field is switched on which has a vertically downward direction-
View Solution
