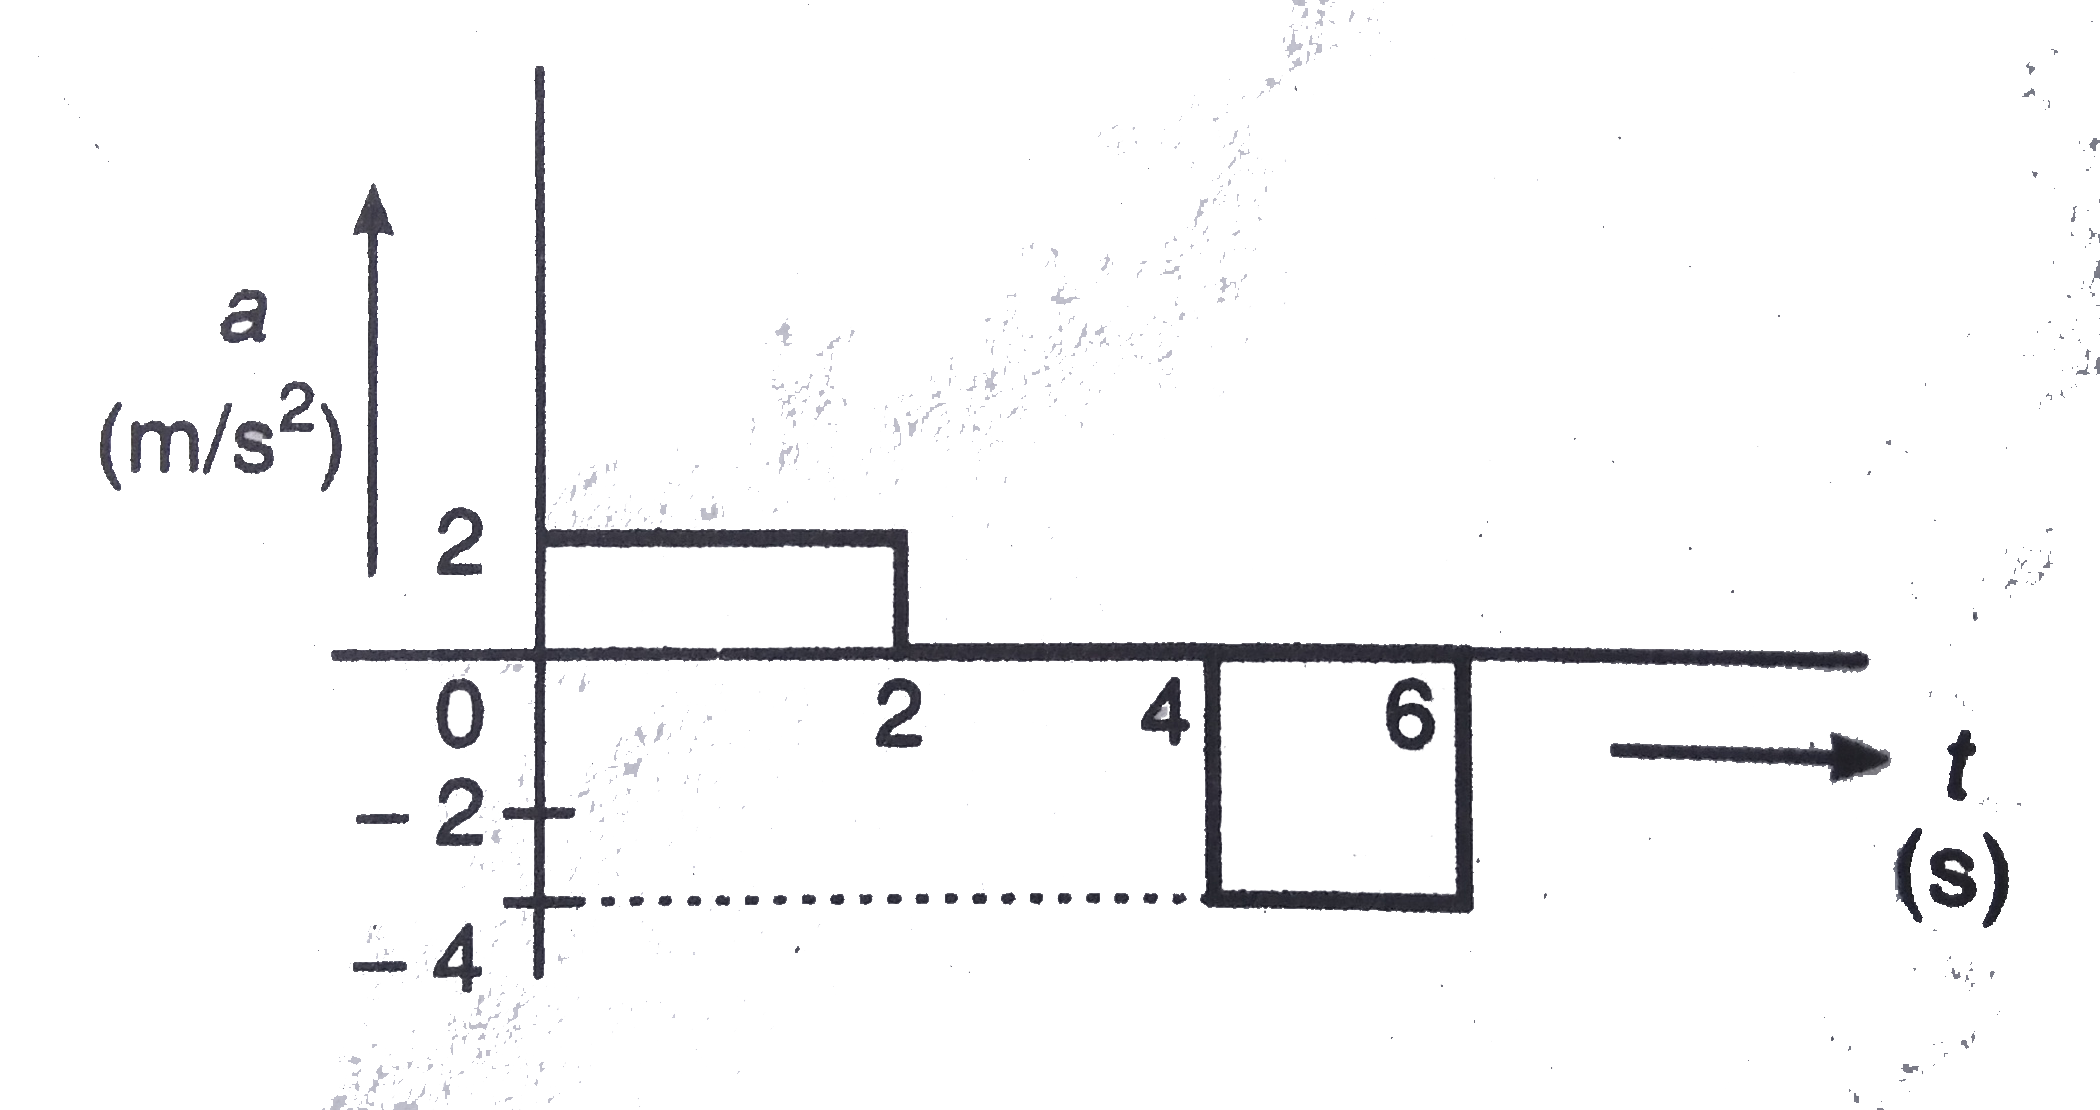
ACCELERATION-TIME GRAPH
Step by step video & image solution for ACCELERATION-TIME GRAPH by Physics experts to help you in doubts & scoring excellent marks in Class 9 exams.
Similar Questions
Knowledge Check
- Question 1 - Select One
The acceleration versus time graph of a particle moving in a straight line is show in figure. The velocity-time graph of the particle would be
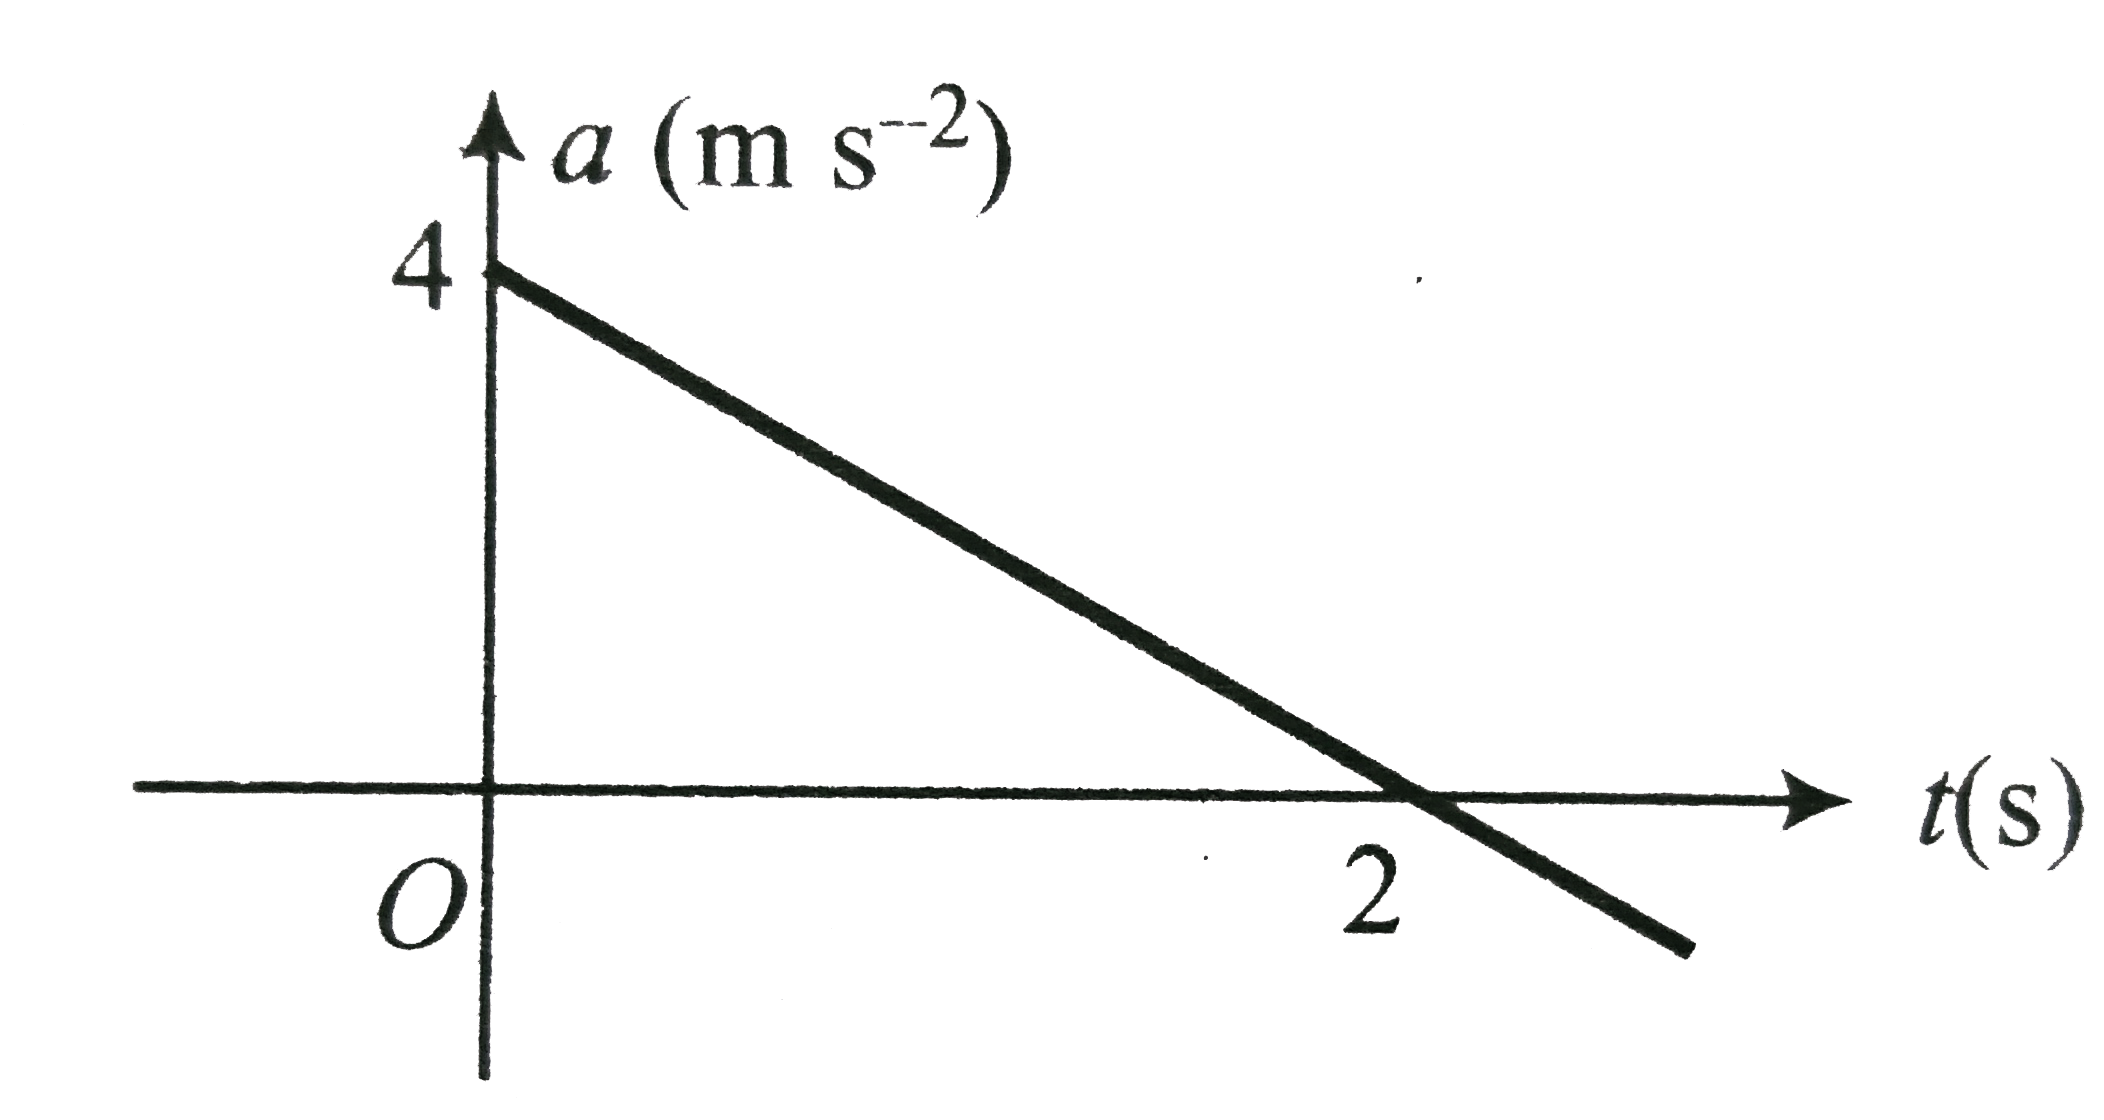 .AA straight lineBA parabolaCA circleDAn ellipse
 - Question 2 - Select One
The area under the acceleration-time (a-t) graph gives
AAccelerationBDisplacementCVelocityDChange in velocity - Question 3 - Select One
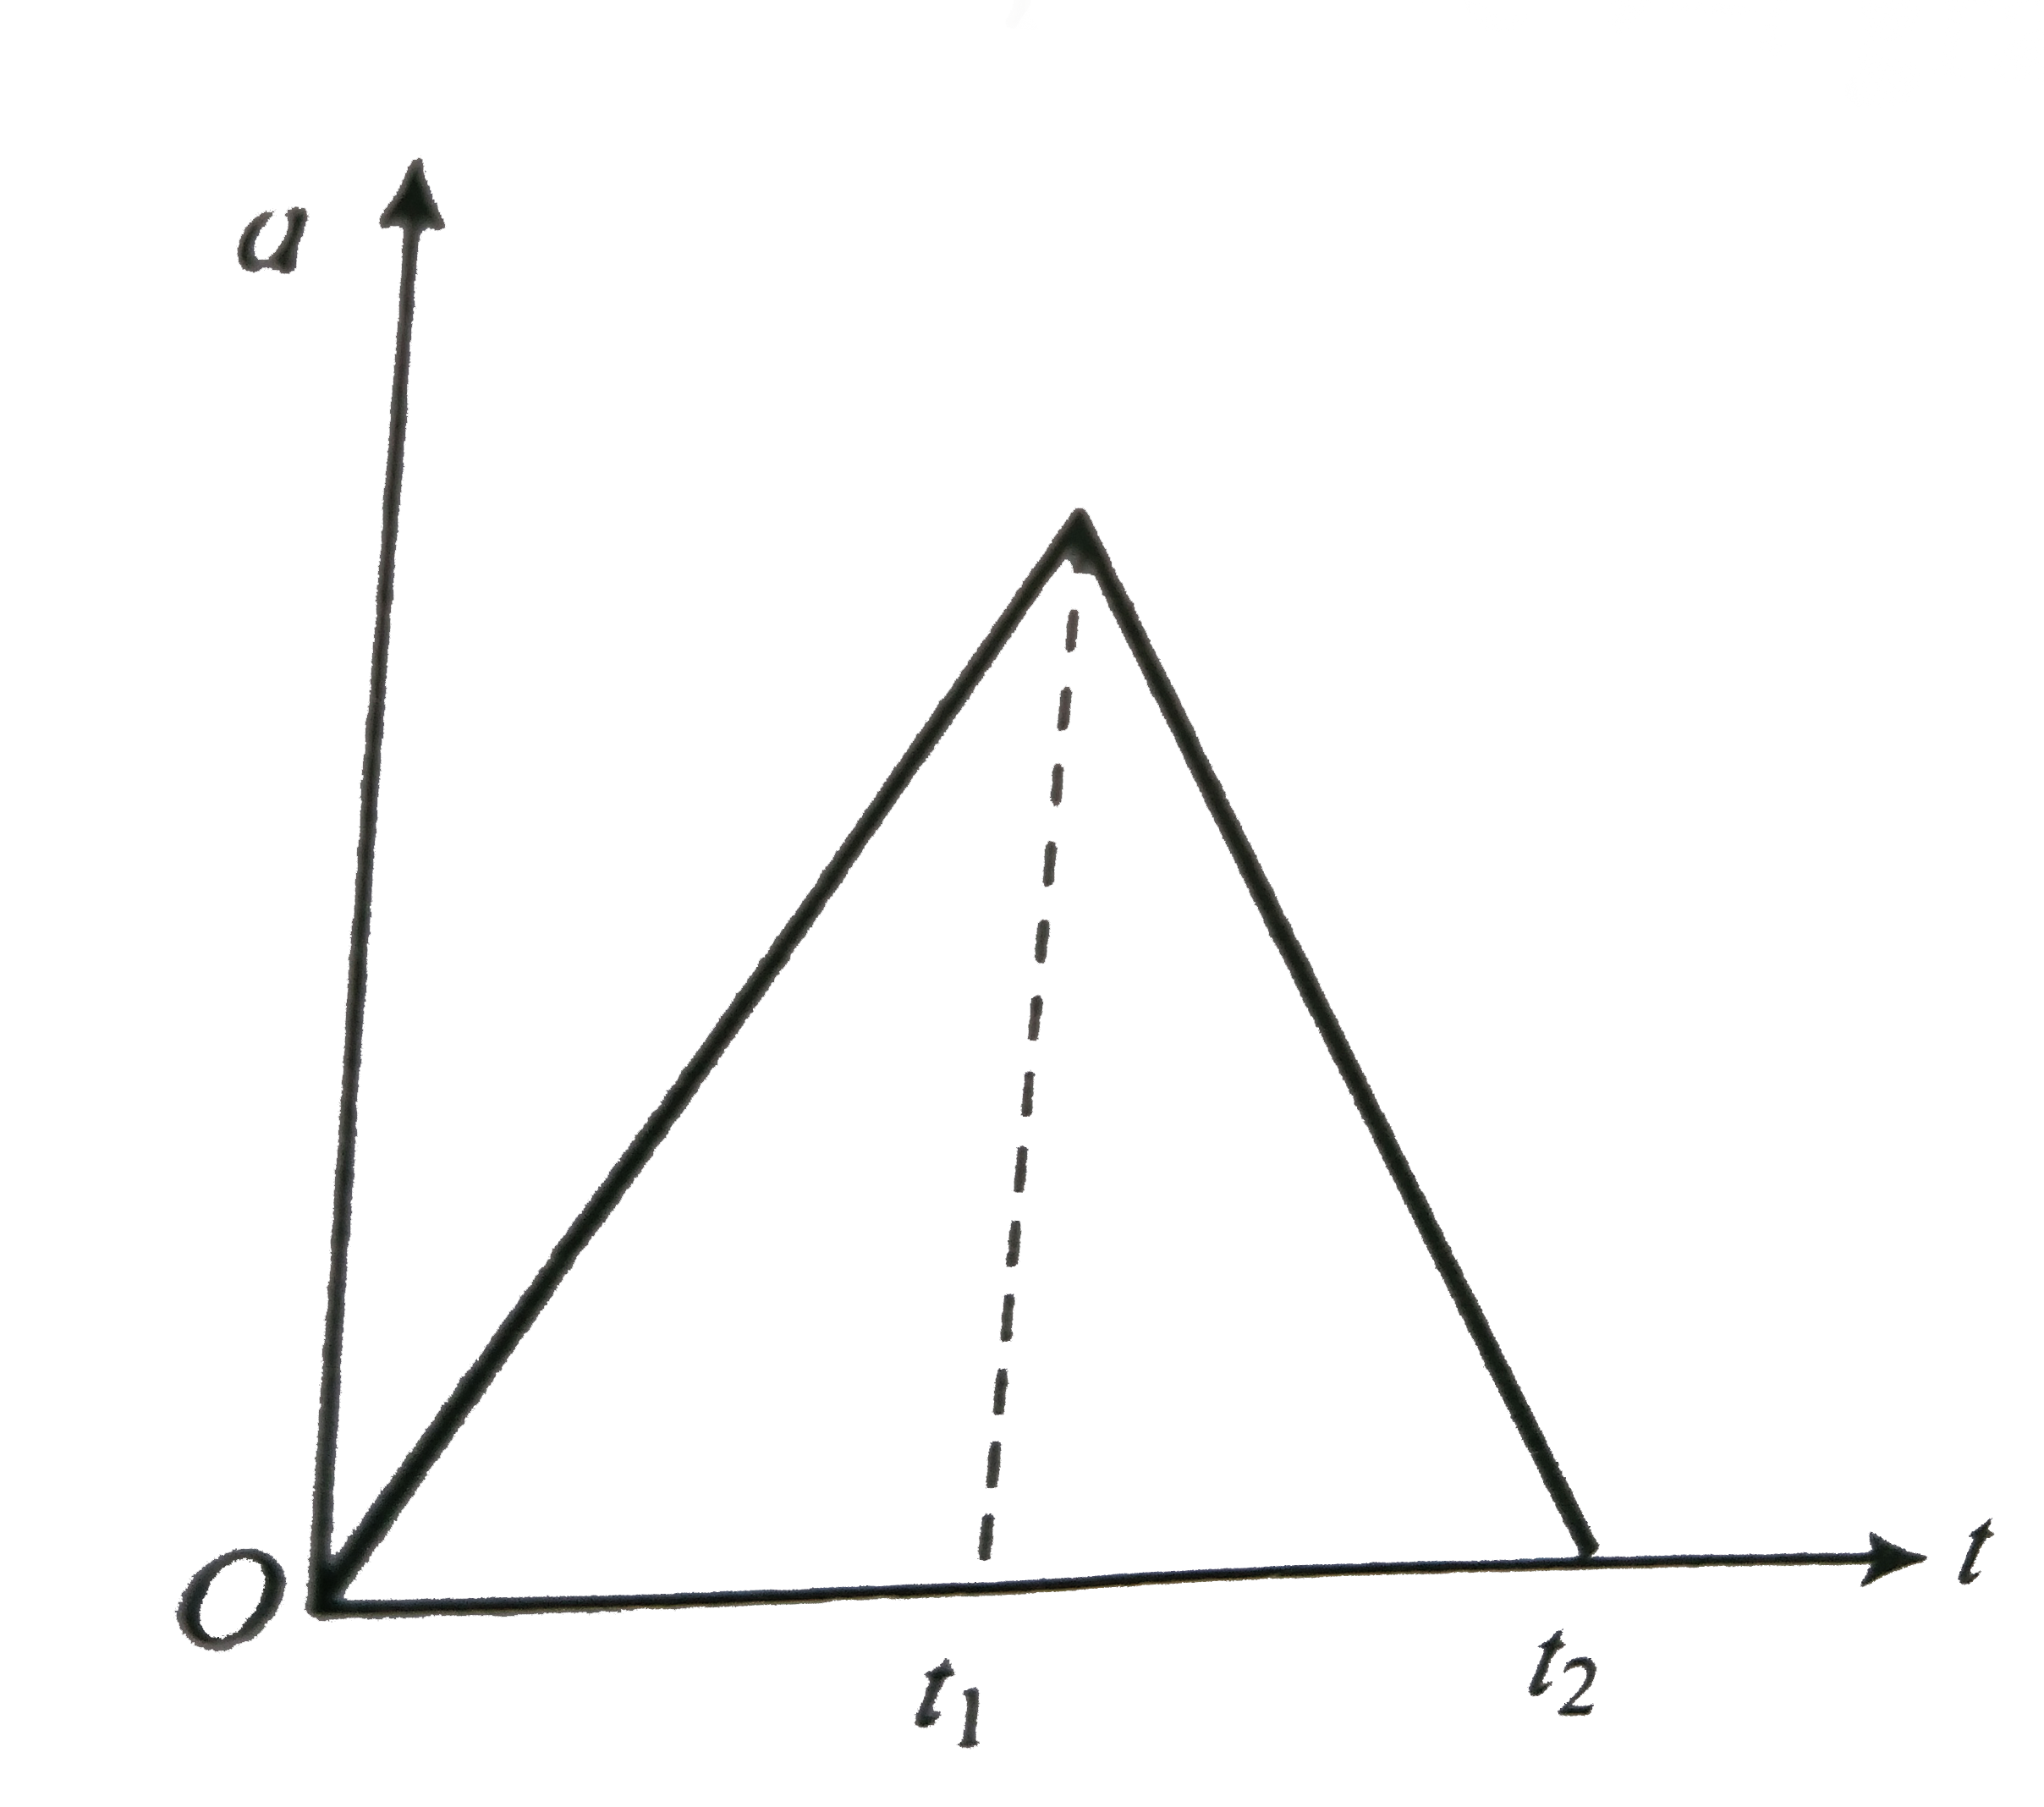
The acceleration versus time graph of a particle is shown in the figure. The respective v−t graph of the particle is .
 .A
.A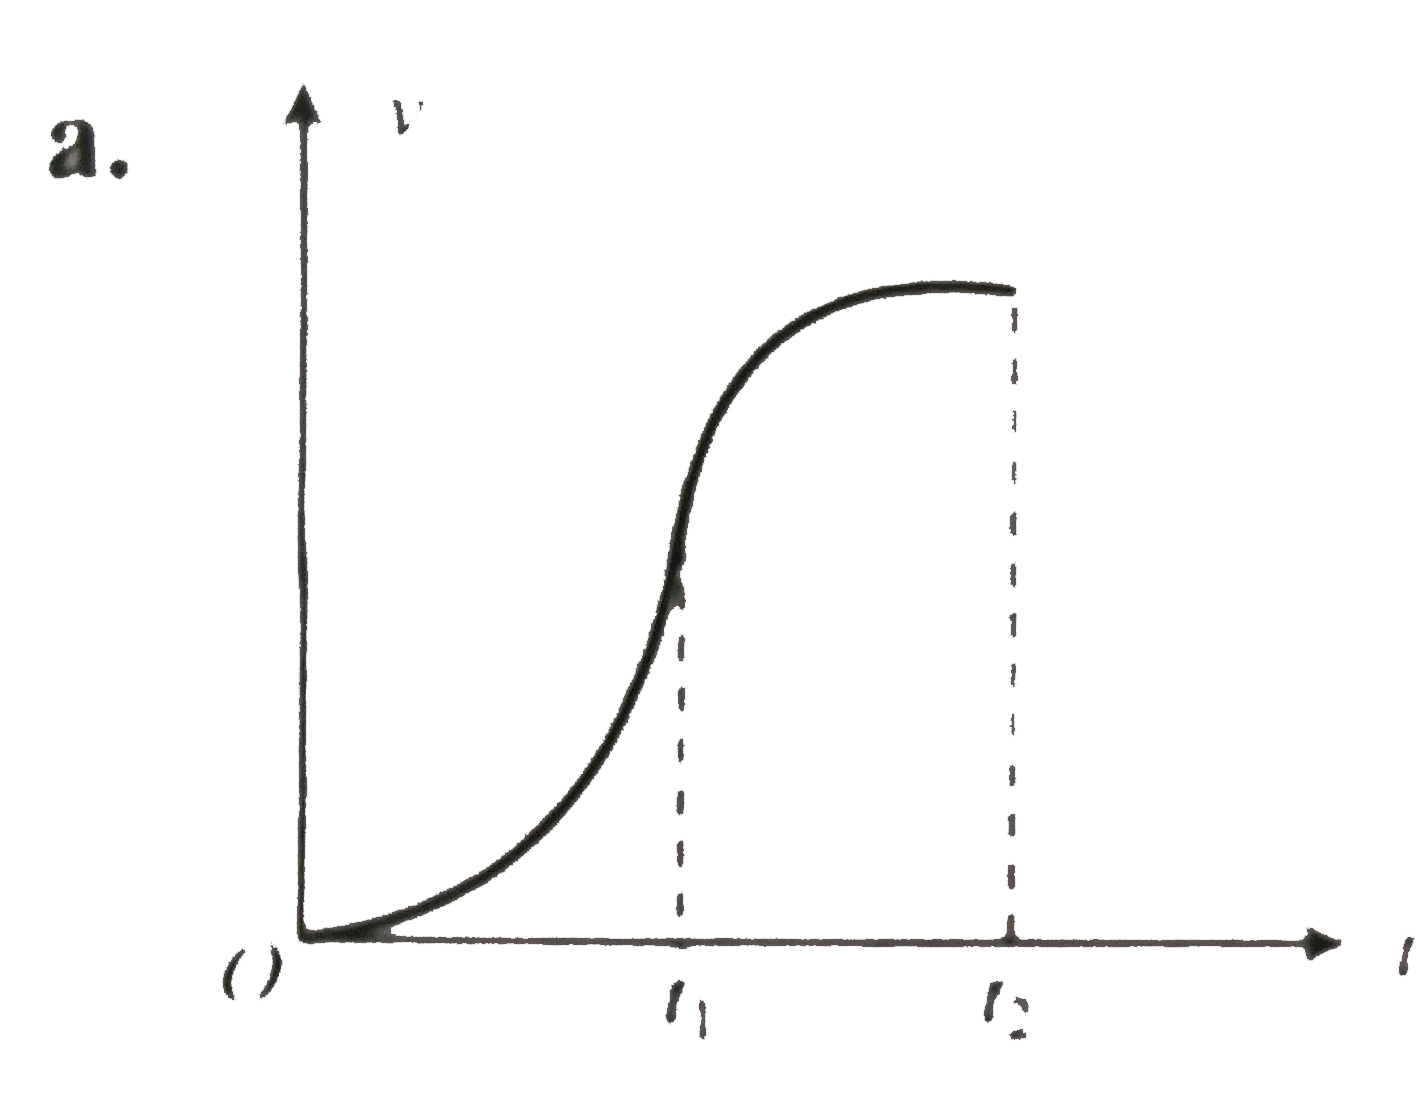 .B
.B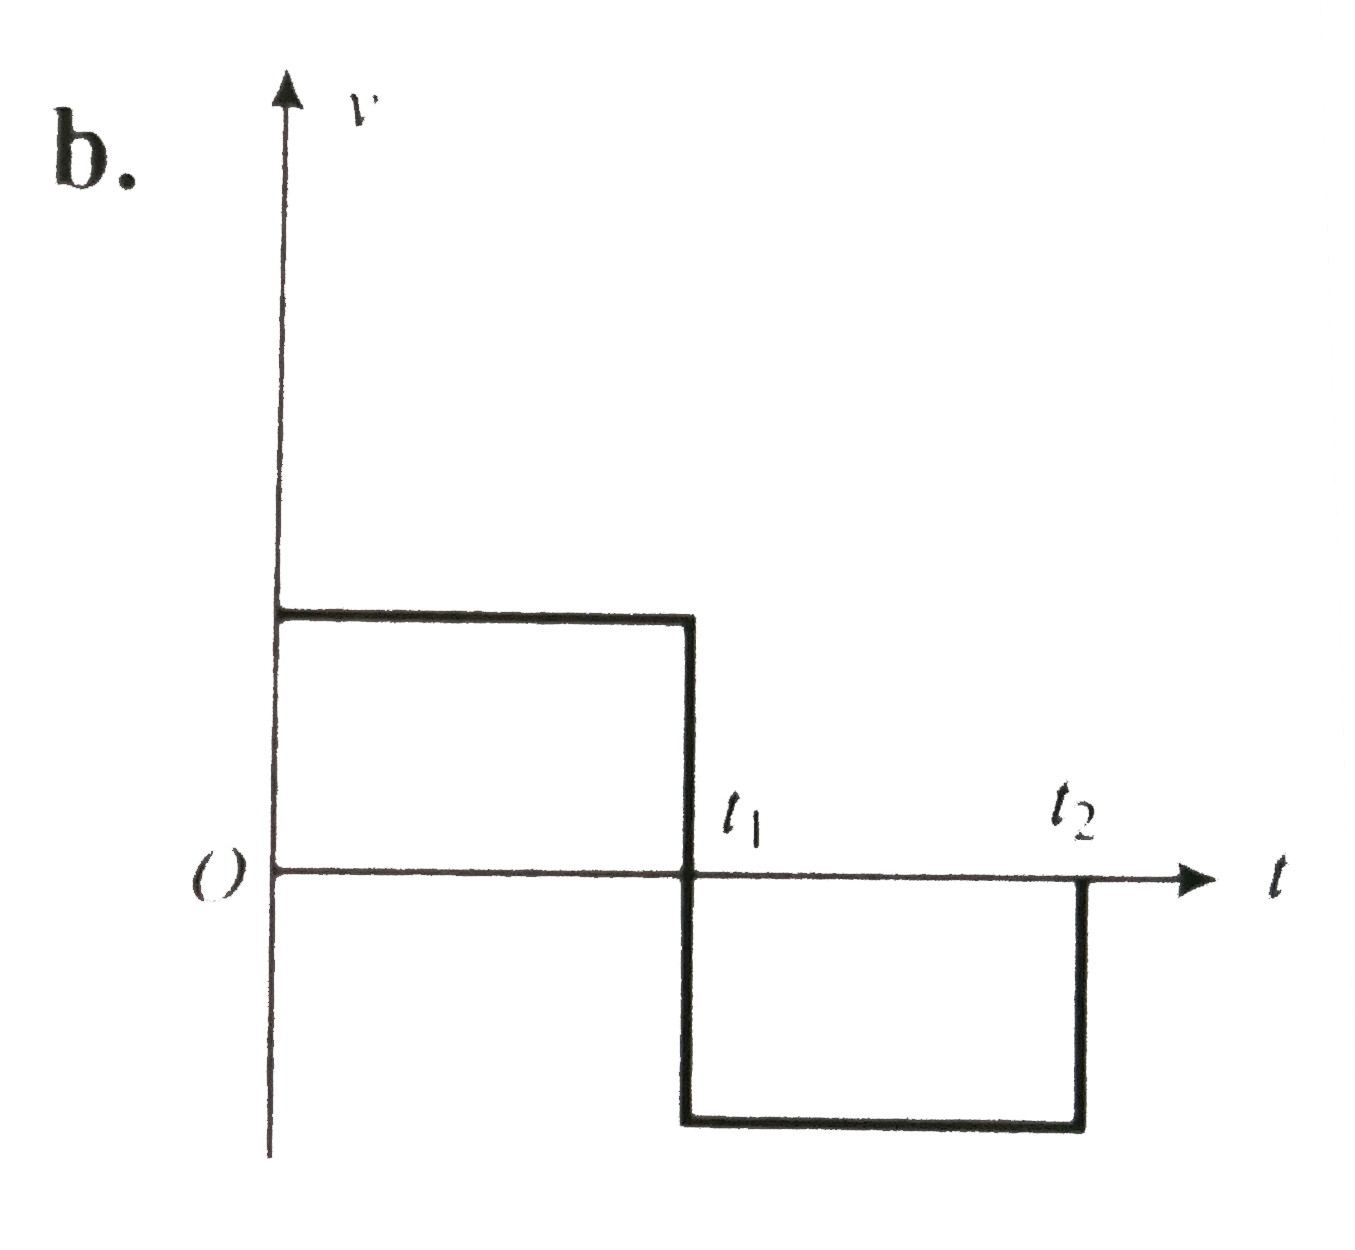 .C
.C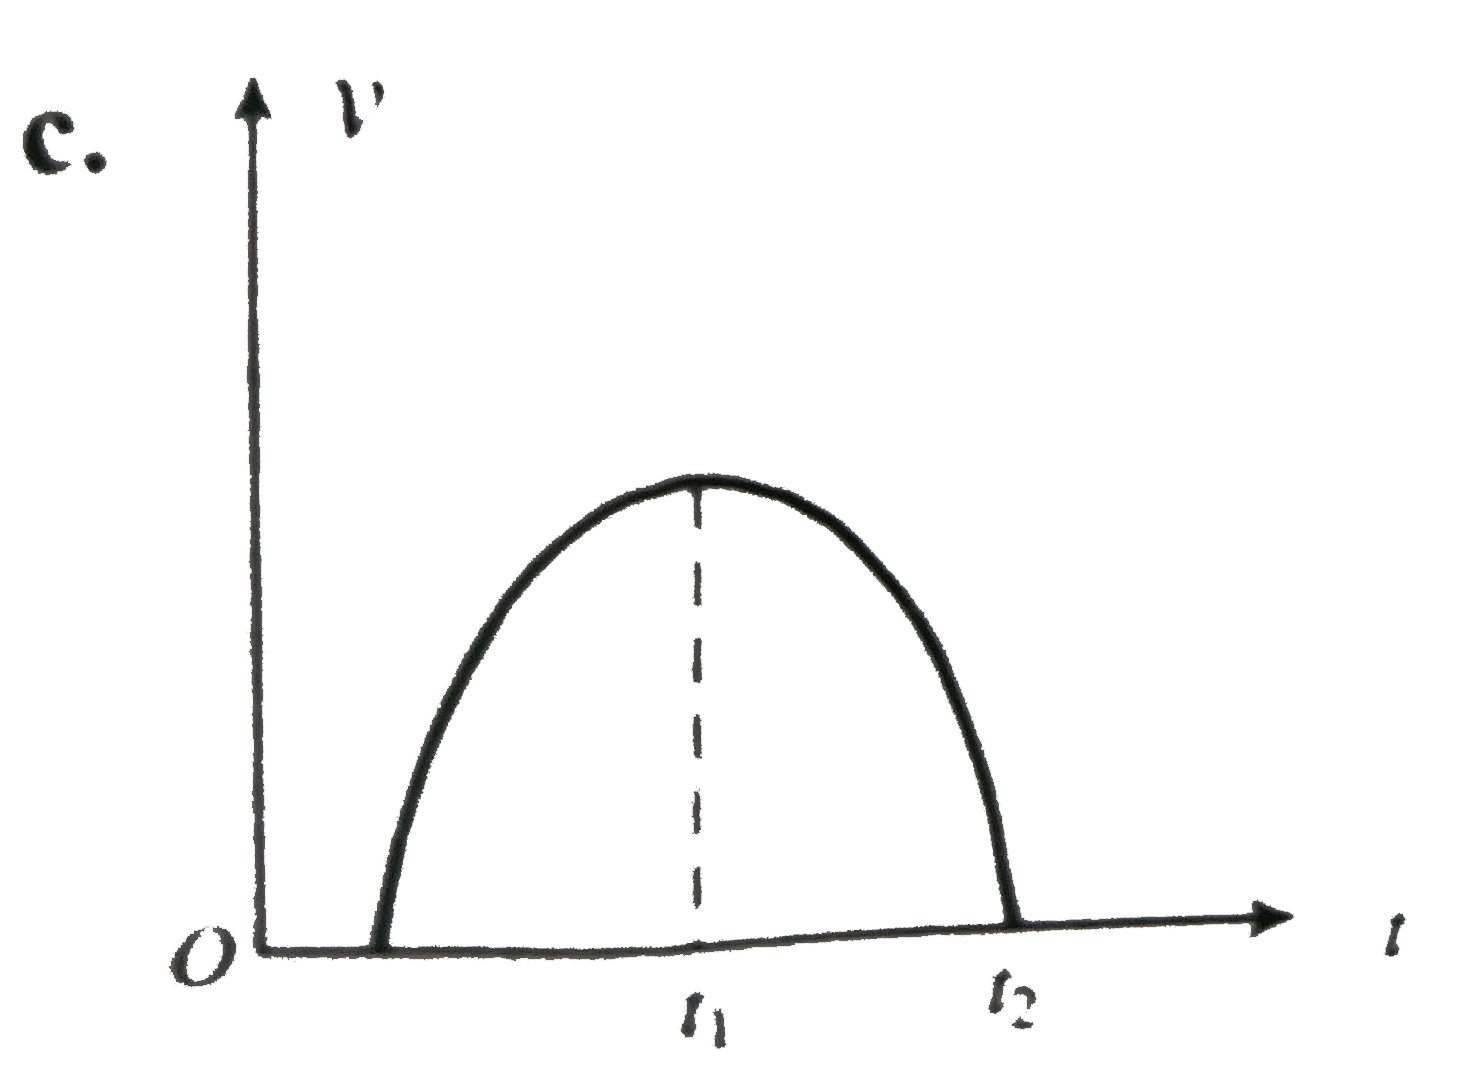 .D
.D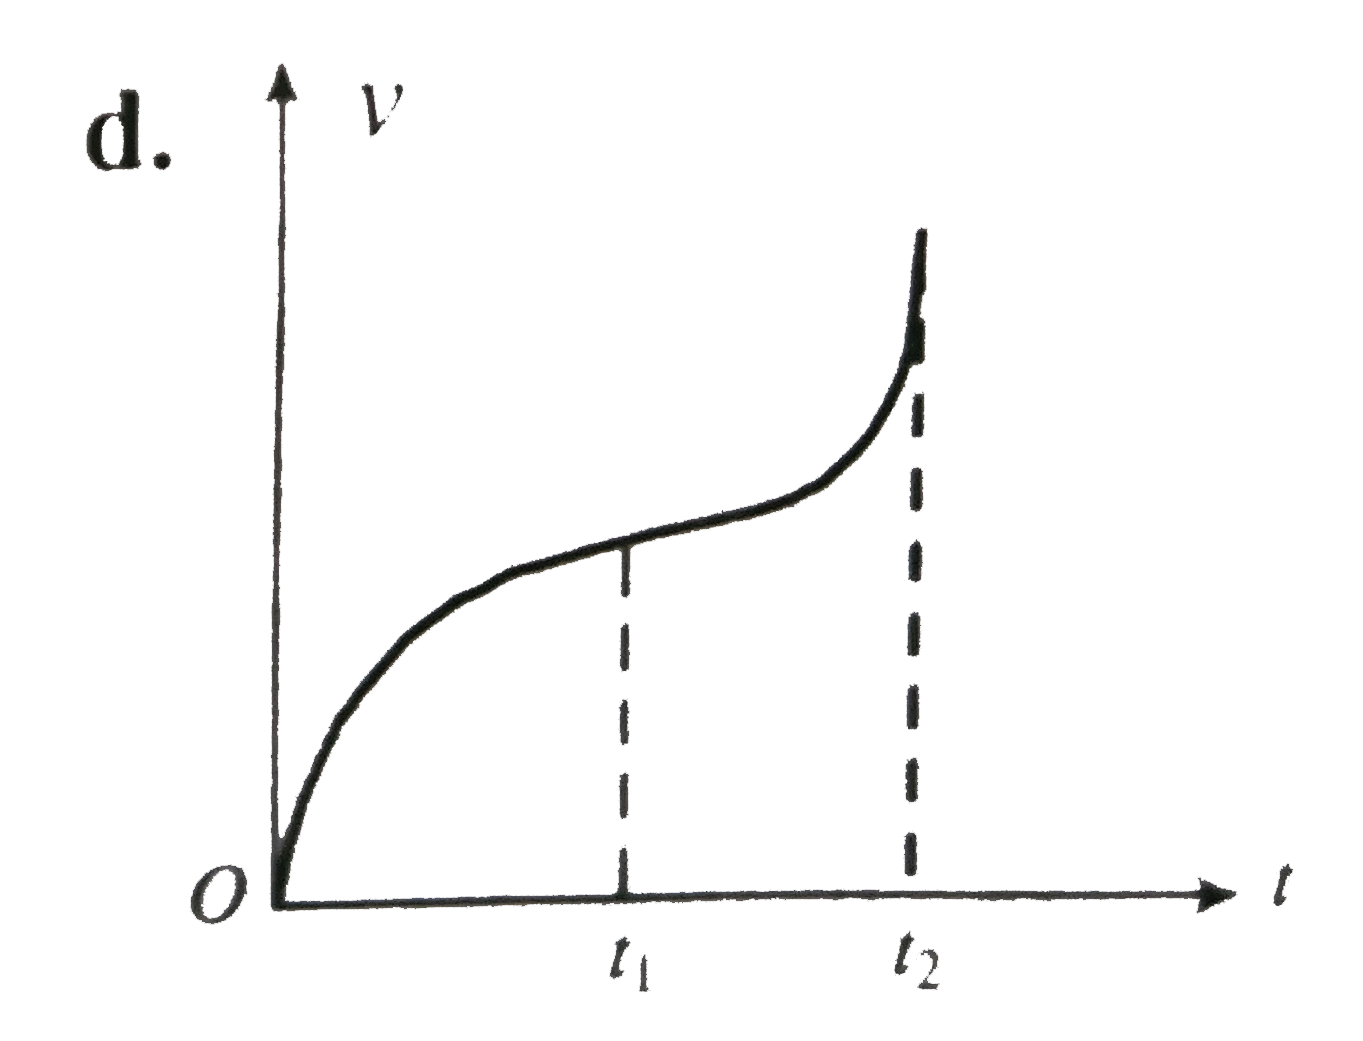 .
.
The velocity-time graph of a bosy moving along a straight line is given bellow dind:
Average velocity in whole time of motion
(b) Average speed in whole time of motion
(c ) Draw acceleration vs time graph.
 . View Solution
Two particles, A and B, move along the same straight line. At t=0, there velocities are zero. Look at their acceleration-time graphs and say whether the statements given below are true or false
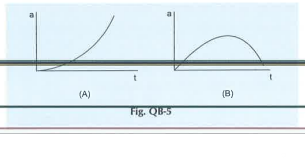
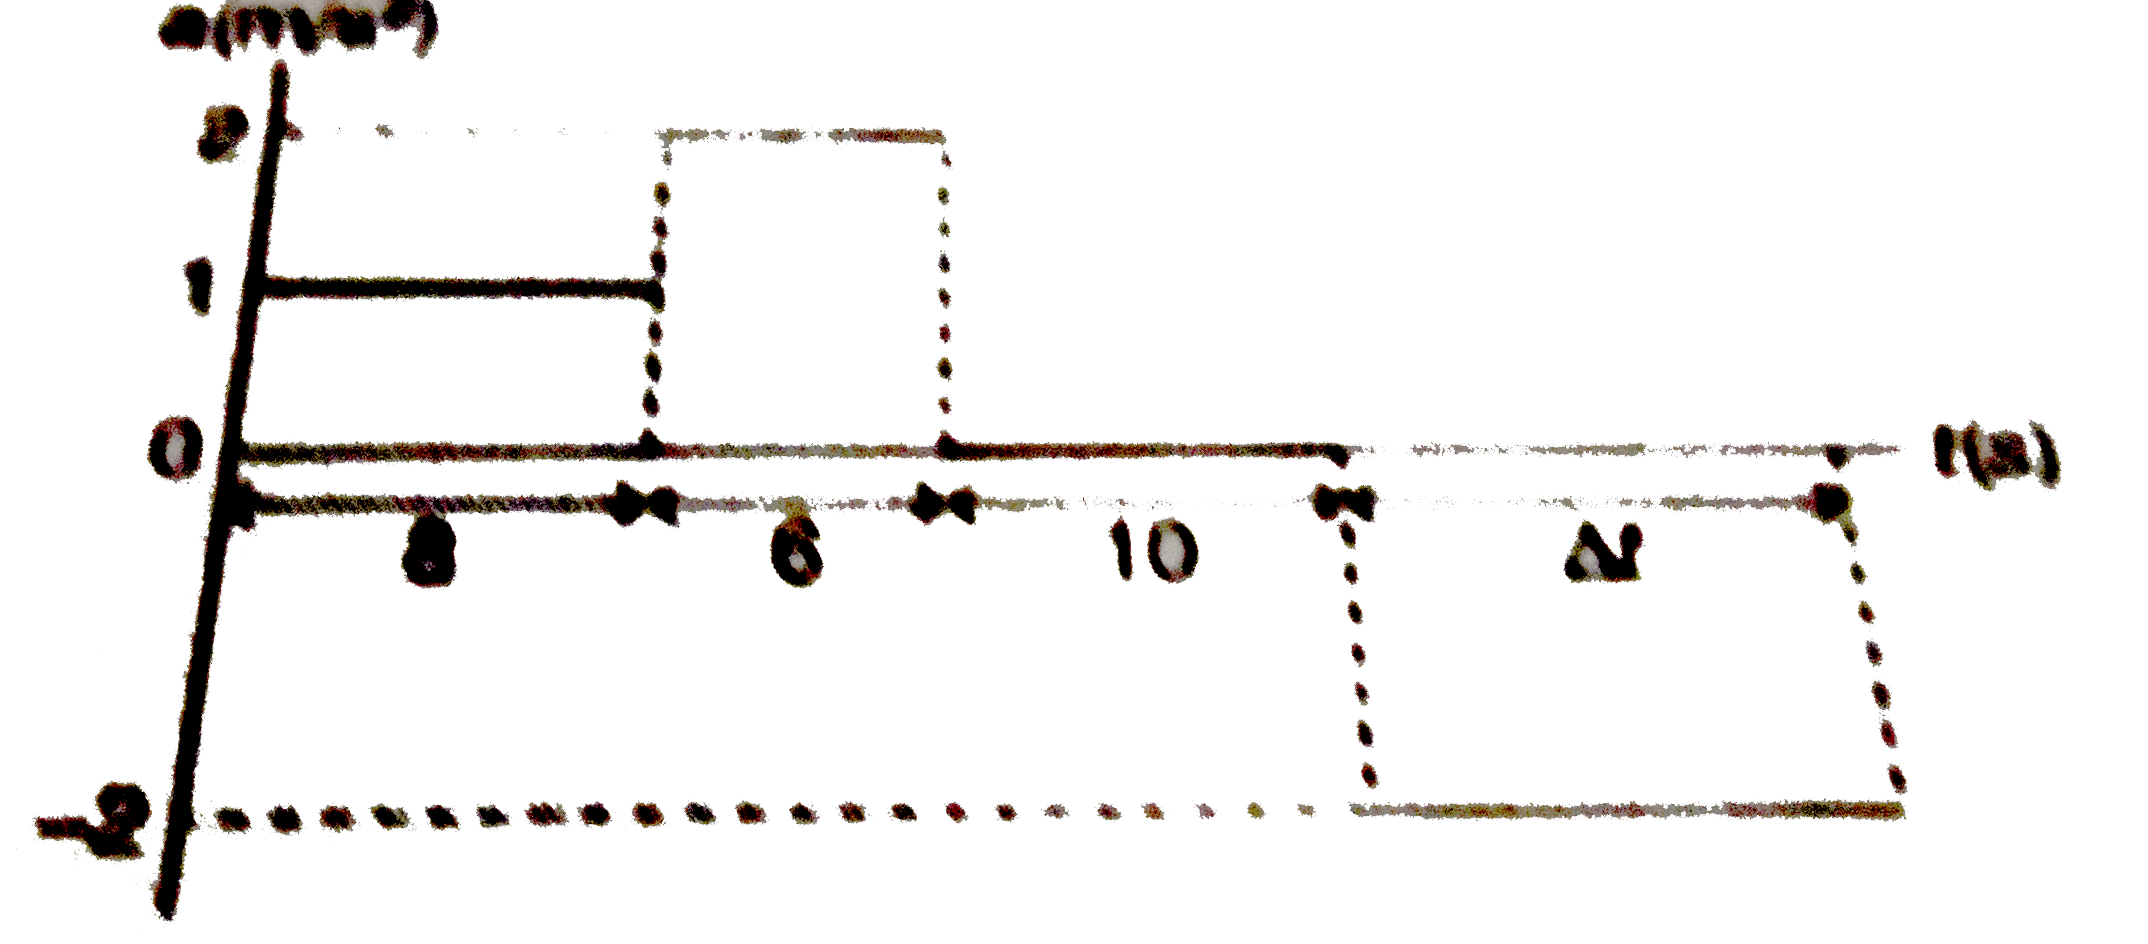
The velocity of B first increases and then decreases.View SolutionA subway train travels between two of its stations at then stops with the acceleration shcedule shown in the acceleration versus time graph. Then
 View Solution
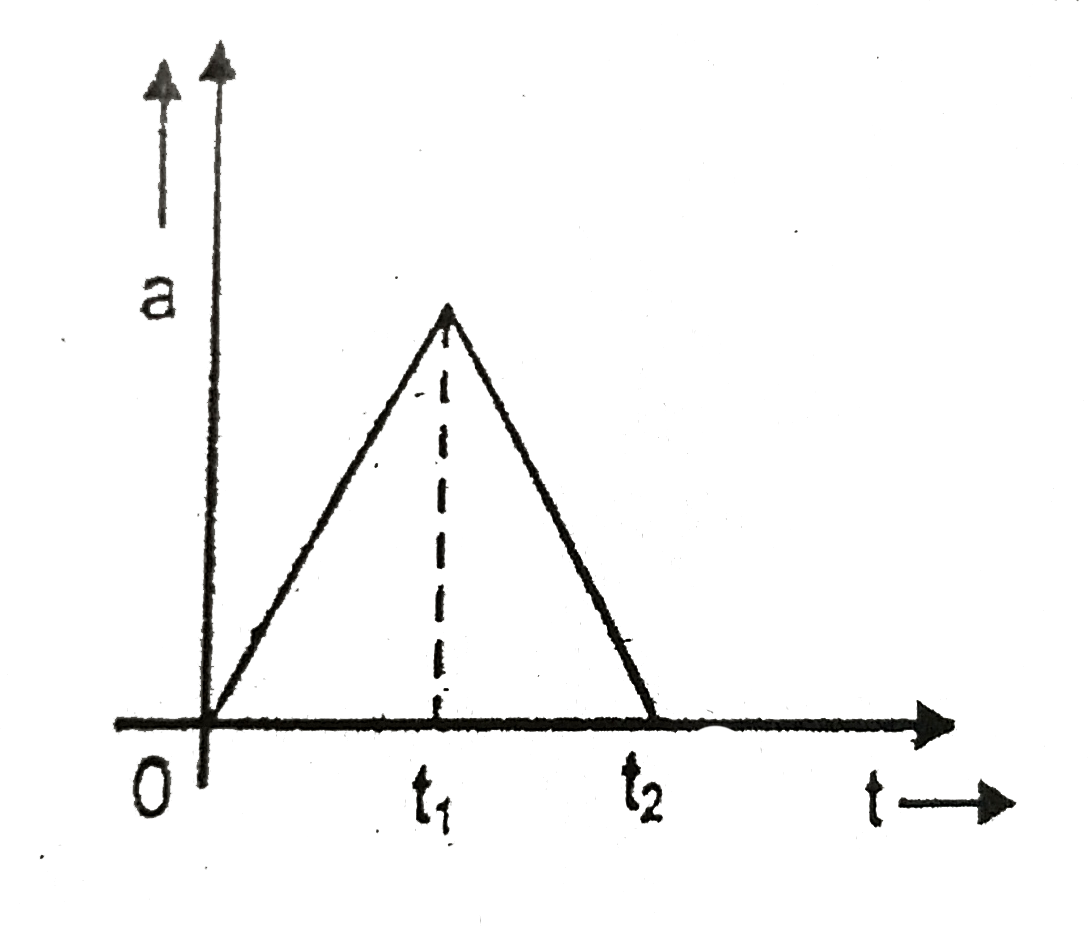
A particle starts to move along a straight line. The acceleration versus time graph of particle is as shown in figure. The correct velocity versus time graph is :
 View Solution
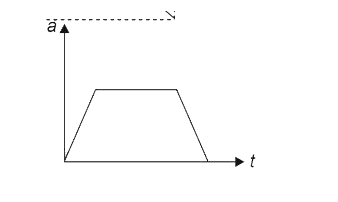
Acceleration versus time graph of a particle moving in a straight line is as shown in adjoining figure. If initially particle was at rest. Then corresponding kinetic energy versus time graph will be :
 View Solution


