GRAPHICAL VARIATION OF E ON X-AXIS DUE TO A POINT CHARGE
Step by step video & image solution for GRAPHICAL VARIATION OF E ON X-AXIS DUE TO A POINT CHARGE by Physics experts to help you in doubts & scoring excellent marks in Class 12 exams.
Similar Questions
Knowledge Check
- Question 1 - Select One
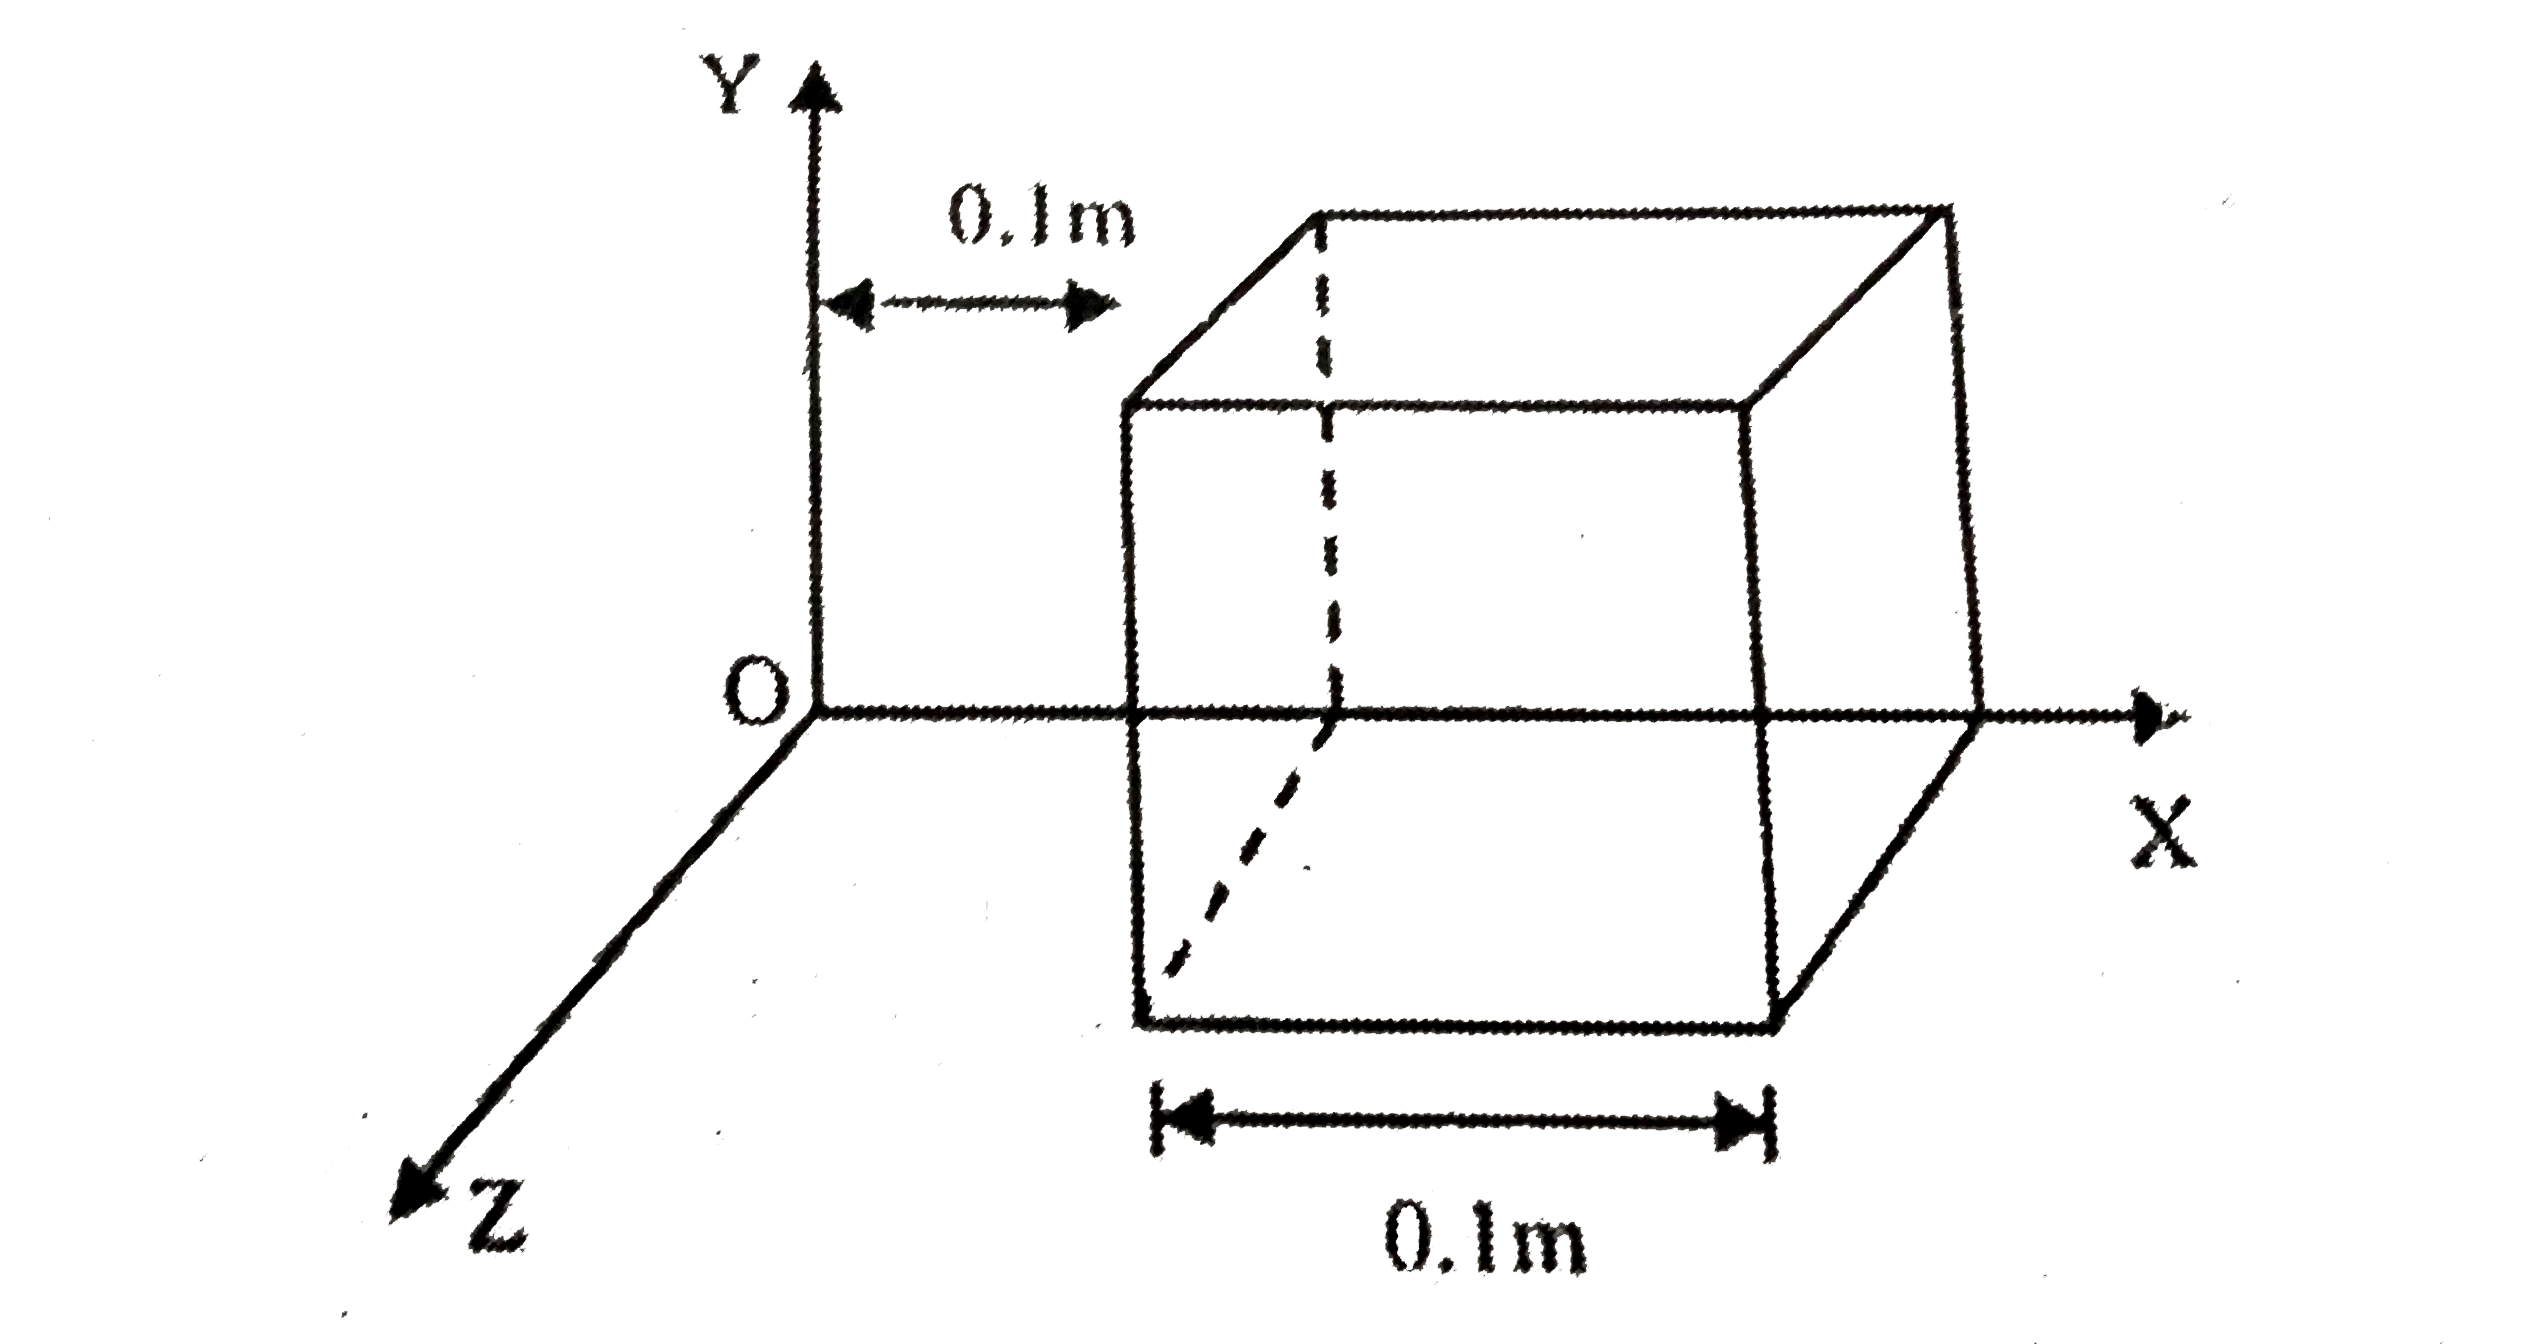
Due to a charge inside the cube, the electric field is: Ex = 600x, Ey = 0, Ez = 0. The charge inside the cube is nearly -
 A600μCB60μCC53μCD6μC
Electrostatic Energy Of System Of Two Point Charges|Electric Potential|Electric Potential Due To Point Charge|Electric Potential Due To System Of Point Charge|Electric Potential Due To Charged Ring|Questions
View SolutionPotential Due To Point Charge|Potential Due To System Of Point Charge|Potential At Axial Point Of Dipole |Potential At Equitorial Point Of Dipole
View SolutionTwo identical positive charges are kept as shown in Fig < 0 x a The variation of electric field intensity E along x-axis is given by (The electric field intensity towards positive x-axis is taken as positive)
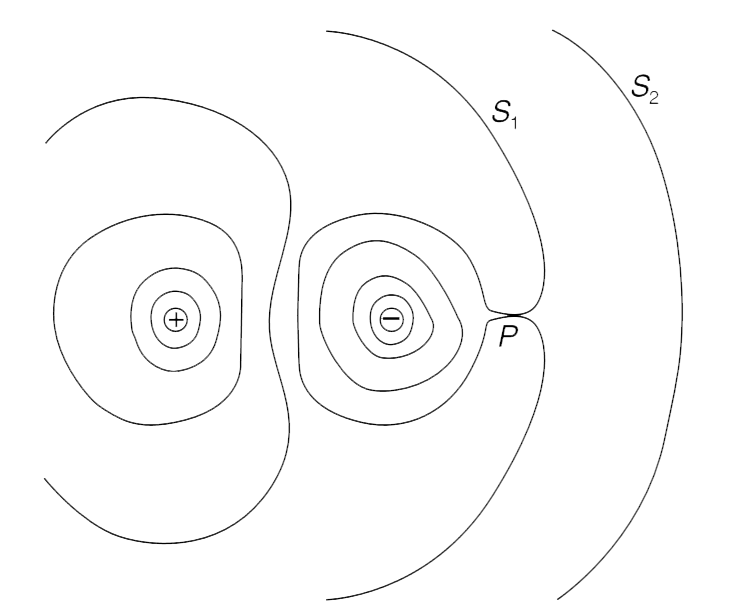
View SolutionThree point charge have been placed along the x axis at points A, B and C. Distance AB = BC. The field lines generated by the system is shown in figure. (a) Plot the variation of electric potential along x axis. Show potential on y axis of your graph. (b) Plot the variation of electric potential along y axis with B as origin. Shows potential on x axis in your graph.
 View Solution
Variation Of Acceleration Due To Gravity|Practice Exercise|Important Points|Summary
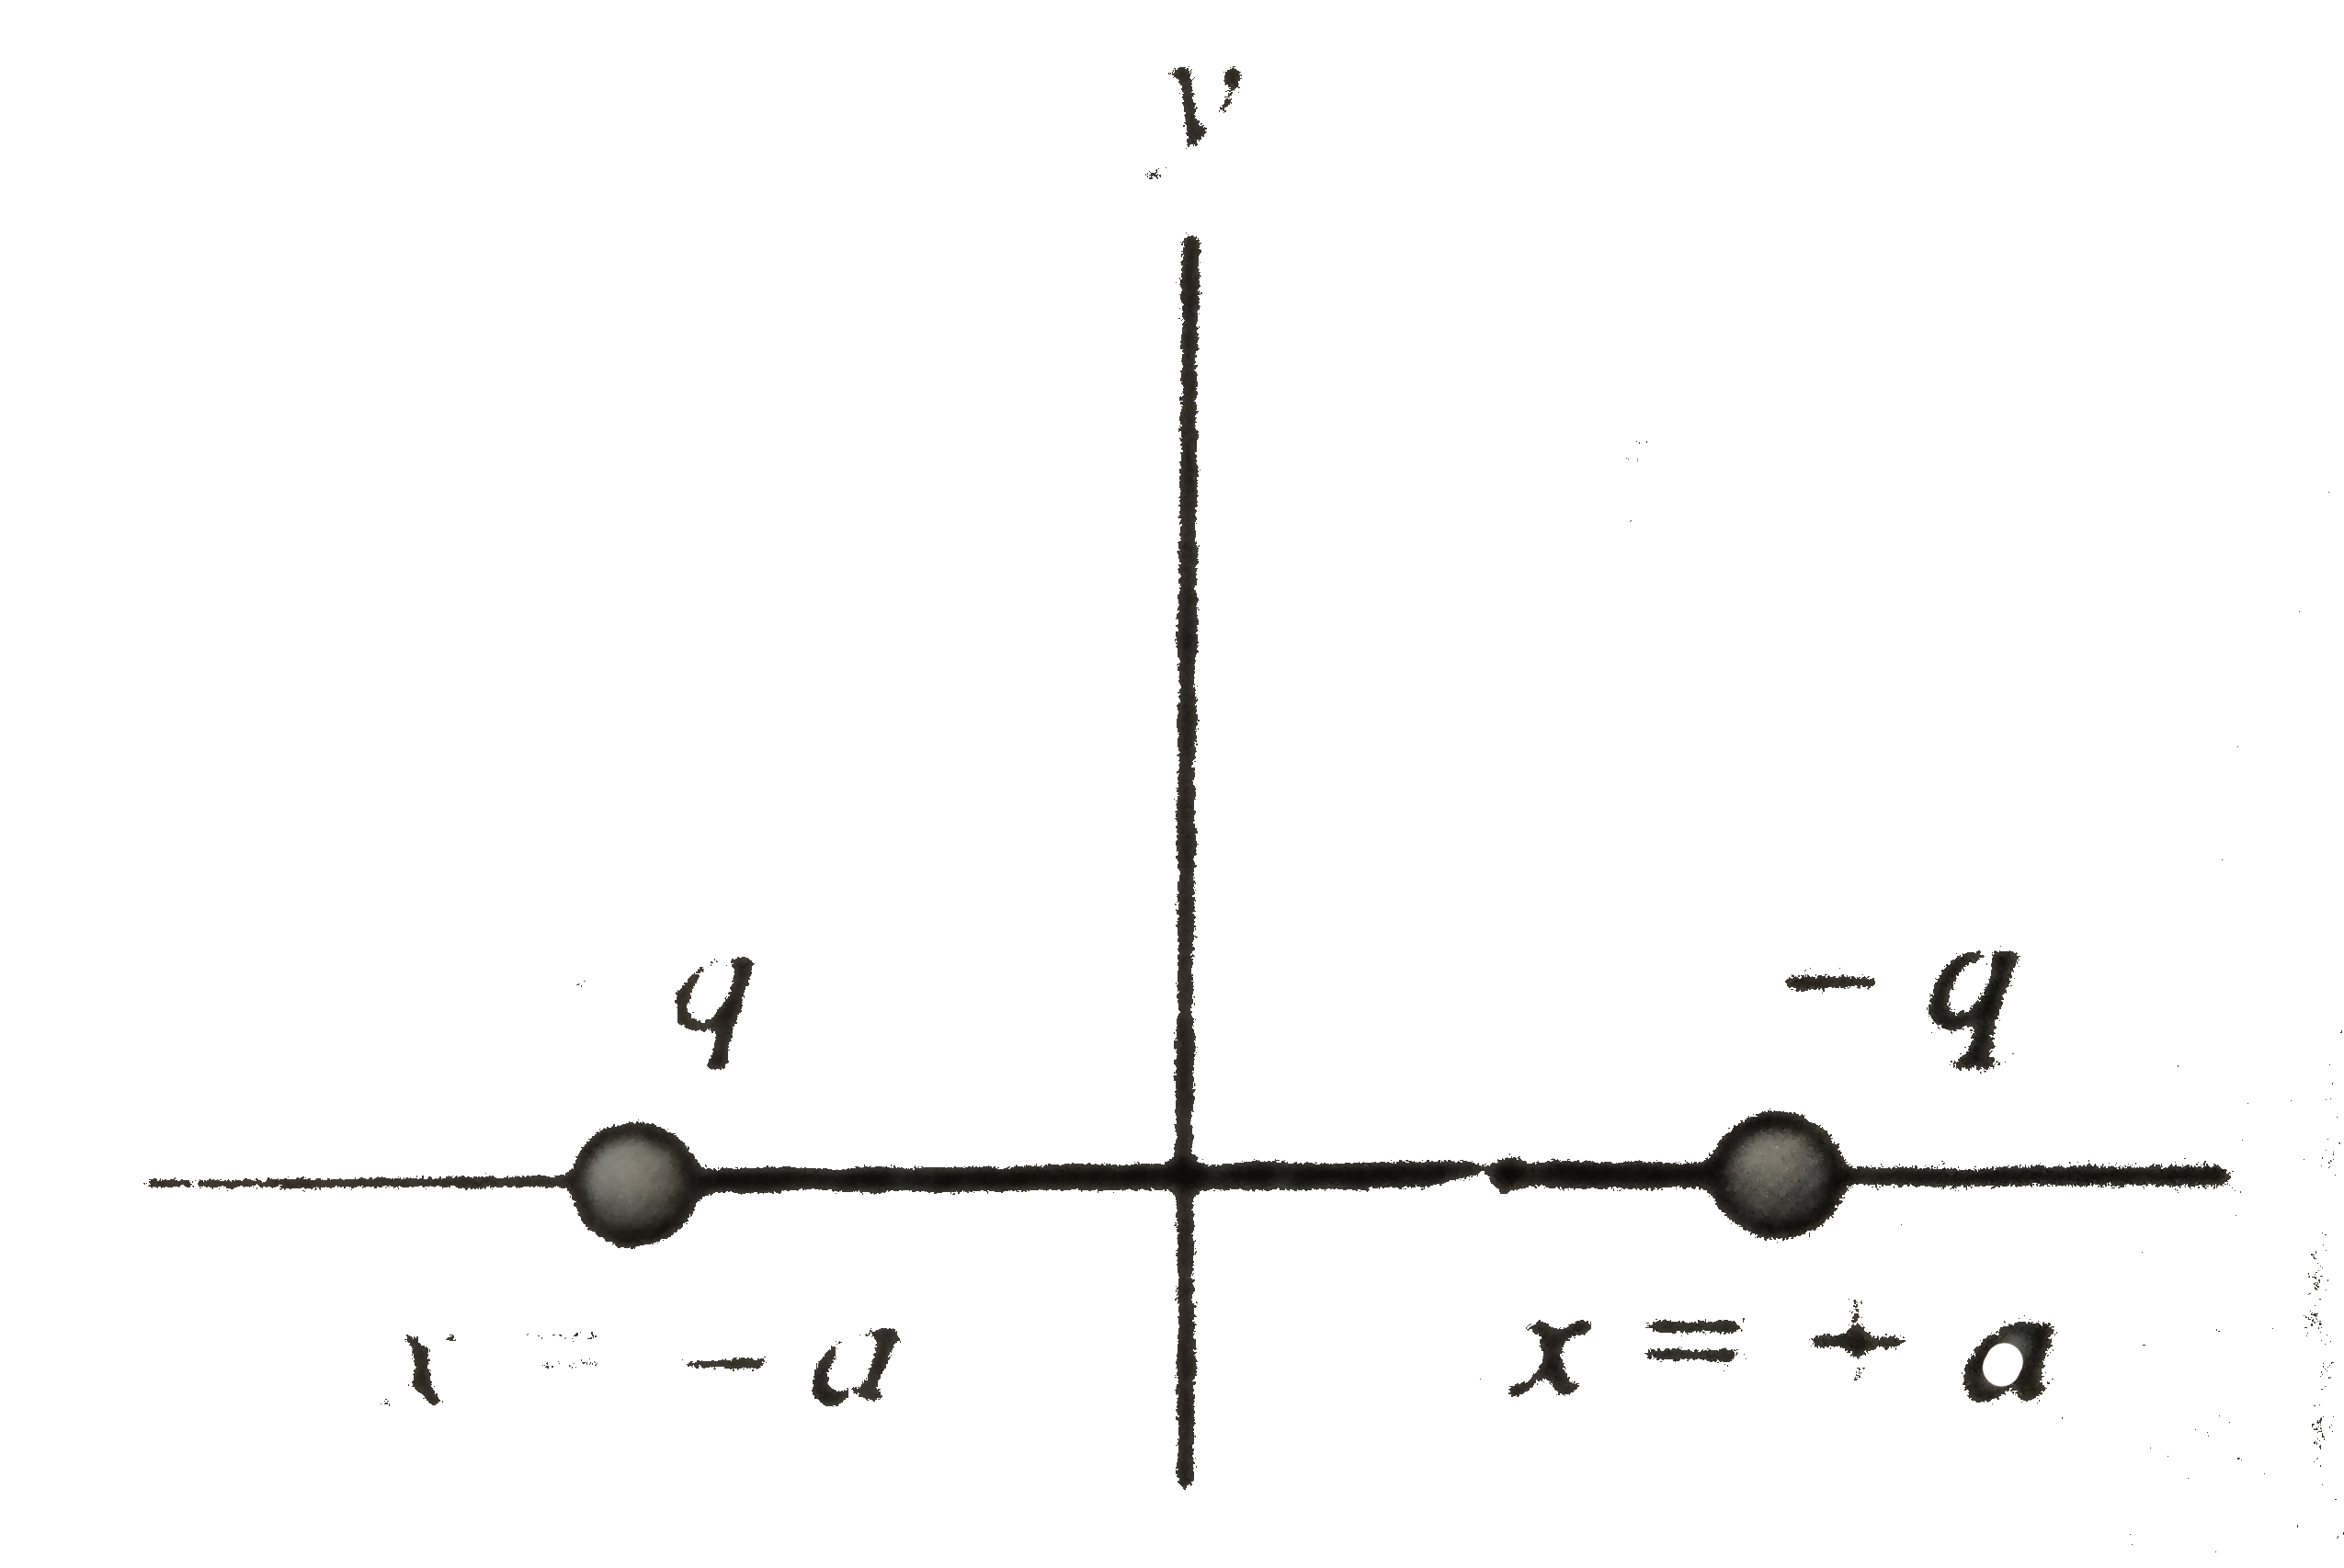
View SolutionTwo point charge ±q are placed on the axis at x=−a and x=±a, as shown in fig.
(i) Plot the variation of E along the x-axis.
(ii) Plot the variation of E along the y-axis.
 View Solution
Concept Of Work|Potential Due To Point Charge|Variation Of Electric Potential
View Solution

