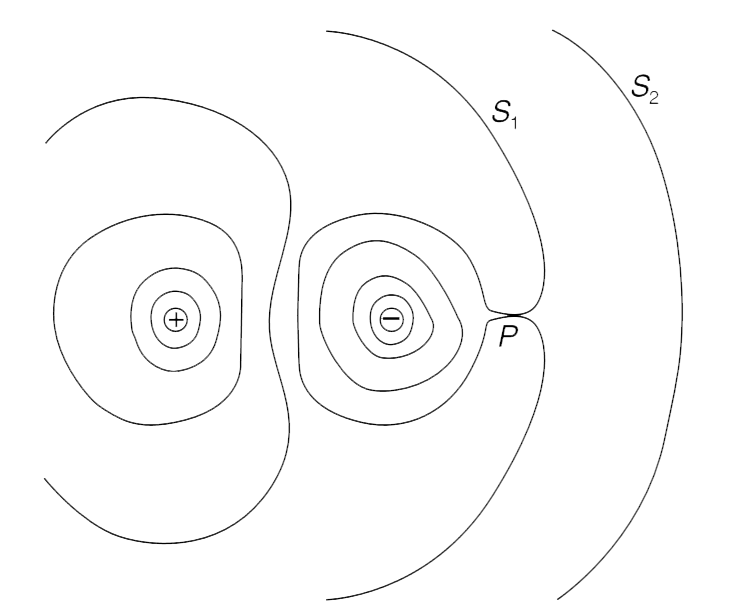
Three point charge have been placed along the x axis at points A, B and C. Distance AB = BC. The field lines generated by the system is shown in figure. (a) Plot the variation of electric potential along x axis. Show potential on y axis of your graph. (b) Plot the variation of electric potential along y axis with B as origin. Shows potential on x axis in your graph.

The correct Answer is:(a). Yes spherical
(b). d√3−1
(c). 2KQd(2−√3)
(d) −Q∈0
Topper's Solved these Questions
Similar Questions
Knowledge Check
Three charges are placed along x-axis at x = - a x = 0 and x = a as shown in the figure. The potential energy of the system is
 A−(14πε0)q2aB−(14πε0)3q22aC+(14πε0)q2aD+(14πε0)3q22a
The slope of the graph showing the variation of potential difference V on X-axis and current Y-axis gives conductor
AresistanceBresistivityCreciprocal of resistanceDconductivityFor a zero order reaction a plot of rate (along Y-axis) and concentration (along X-axis) is
Aa rectangular parabolaBa line with −ve slope and zero Y - interceptCa line with +ve slope and a non - zero Y- interceptDa line with zero slope and a positive Y-intercept
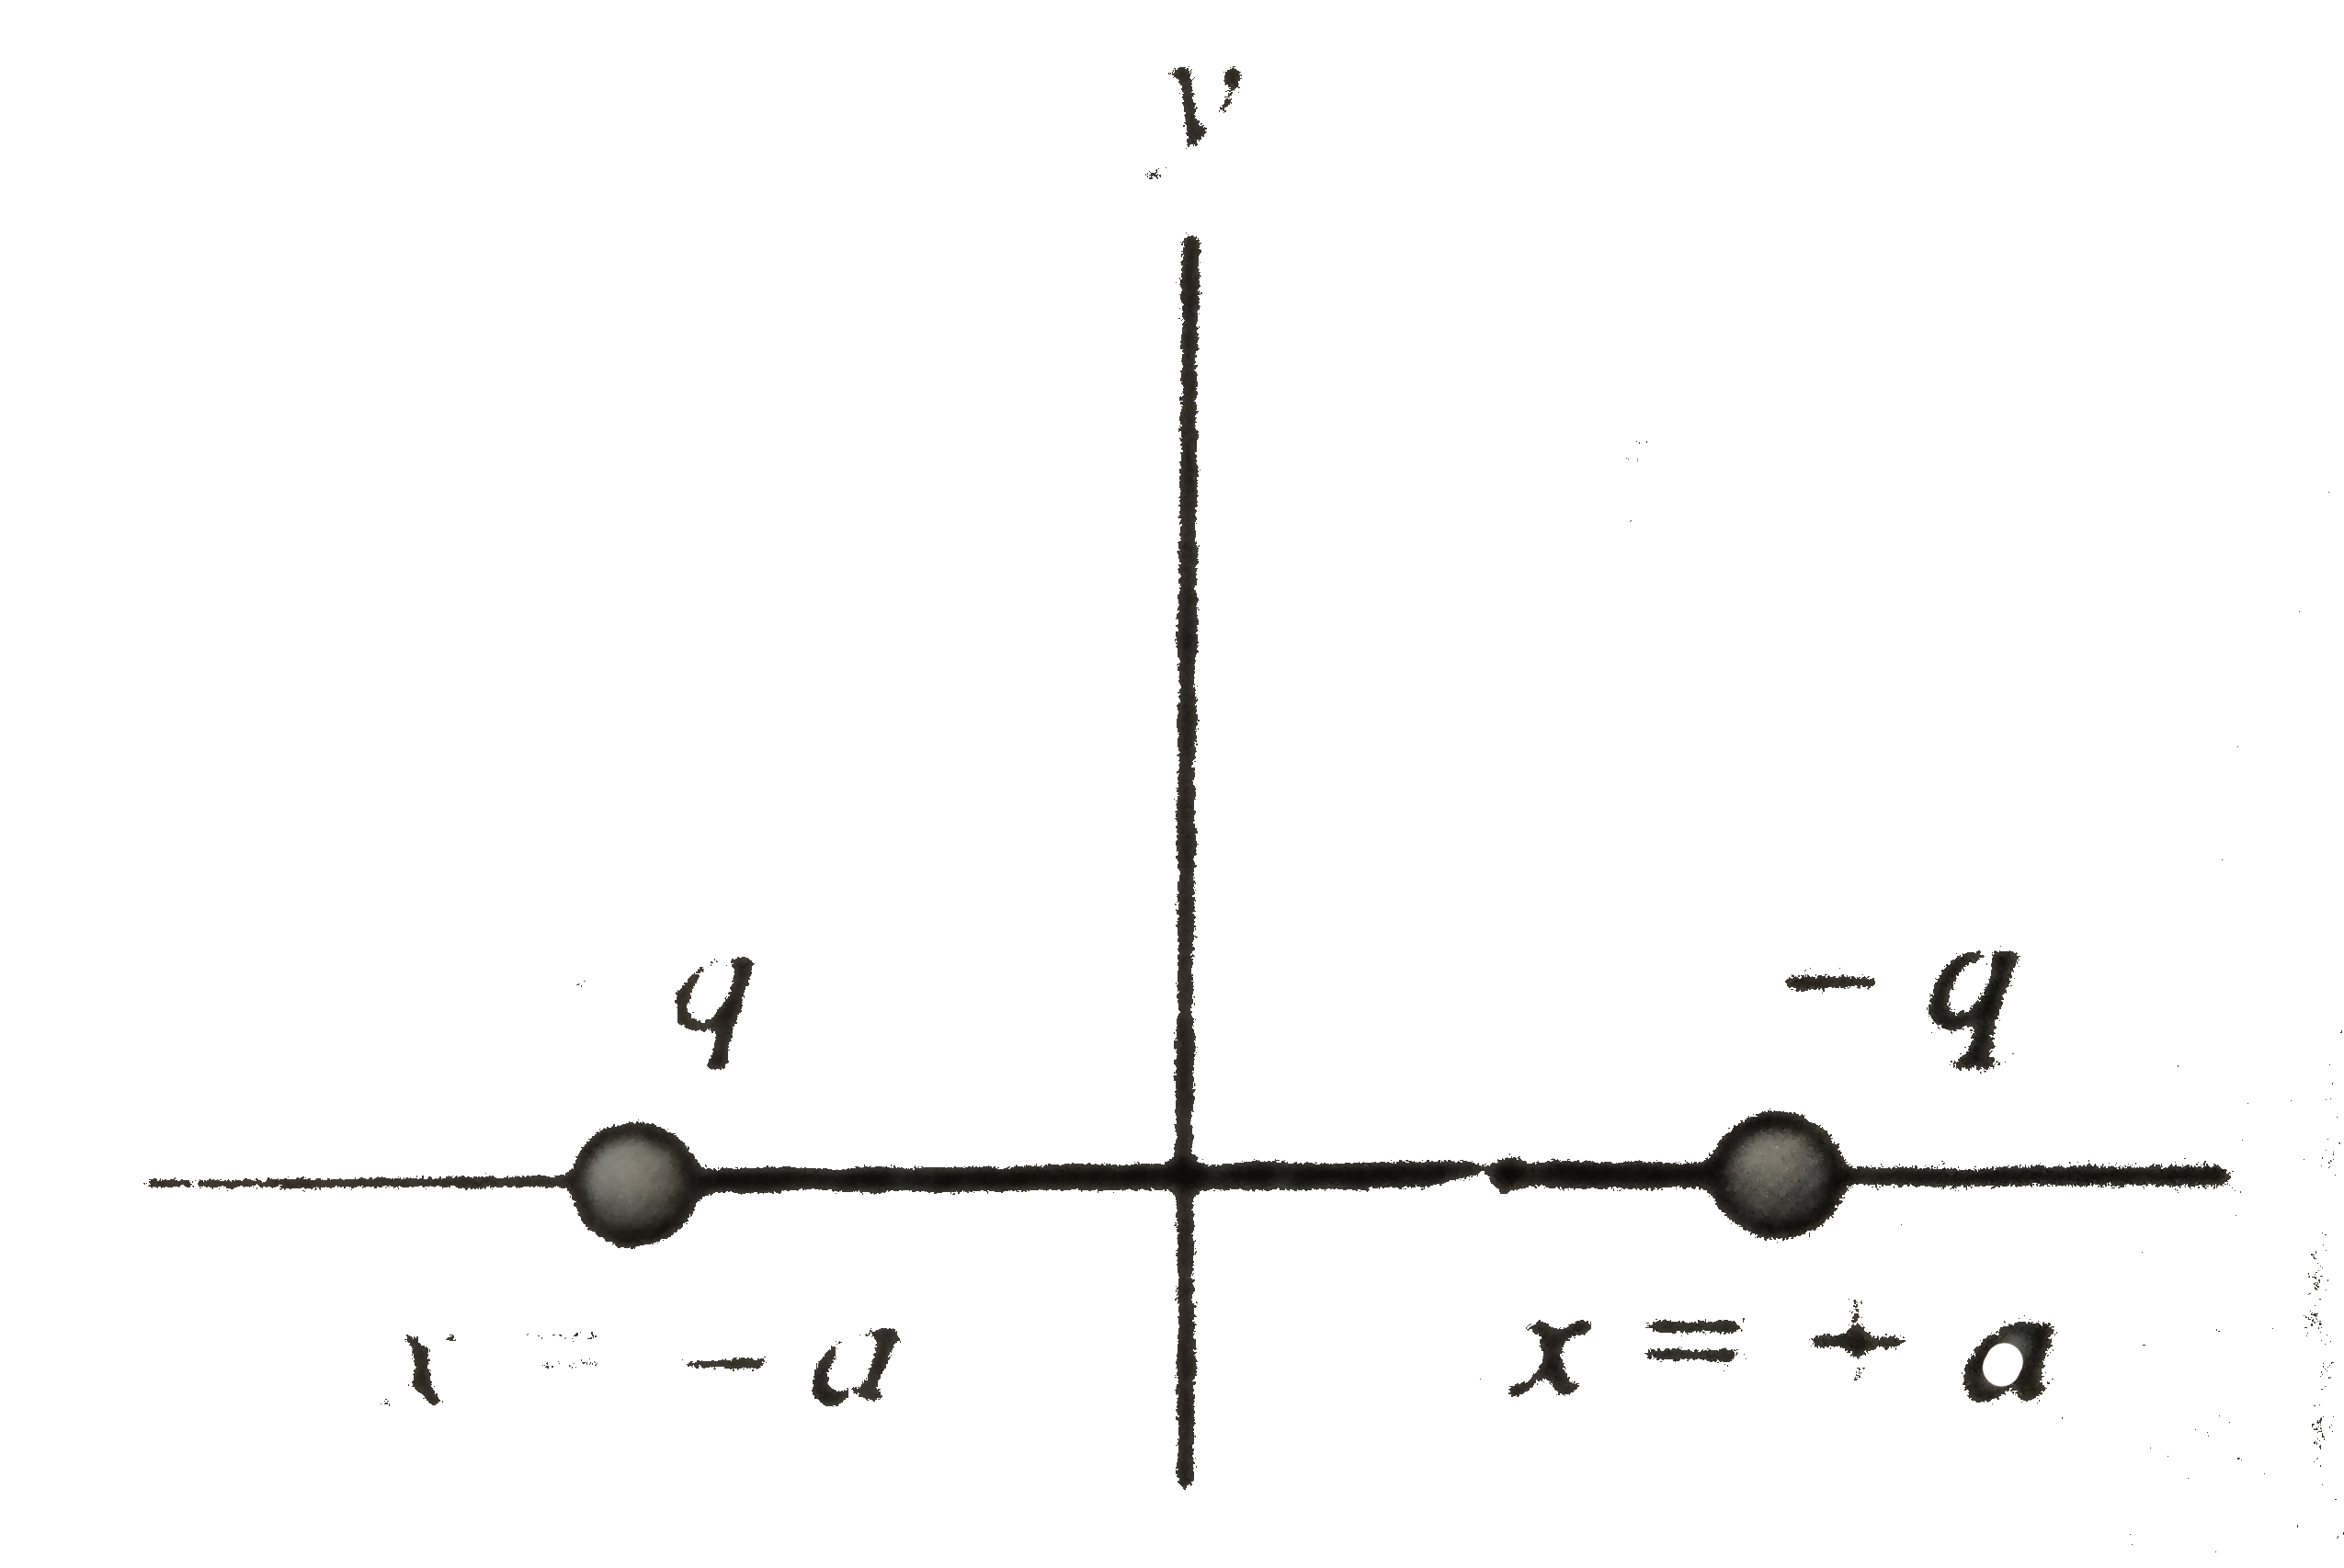
Two point charge ±q are placed on the axis at x=−a and x=+a, as shown in fig.
(i) Plot the variation of E along the x-axis.
(ii) Plot the variation of E along the y-axis.

View SolutionTwo point charge ±q are placed on the axis at x=−a and x=±a, as shown in fig.
(i) Plot the variation of E along the x-axis.
(ii) Plot the variation of E along the y-axis.

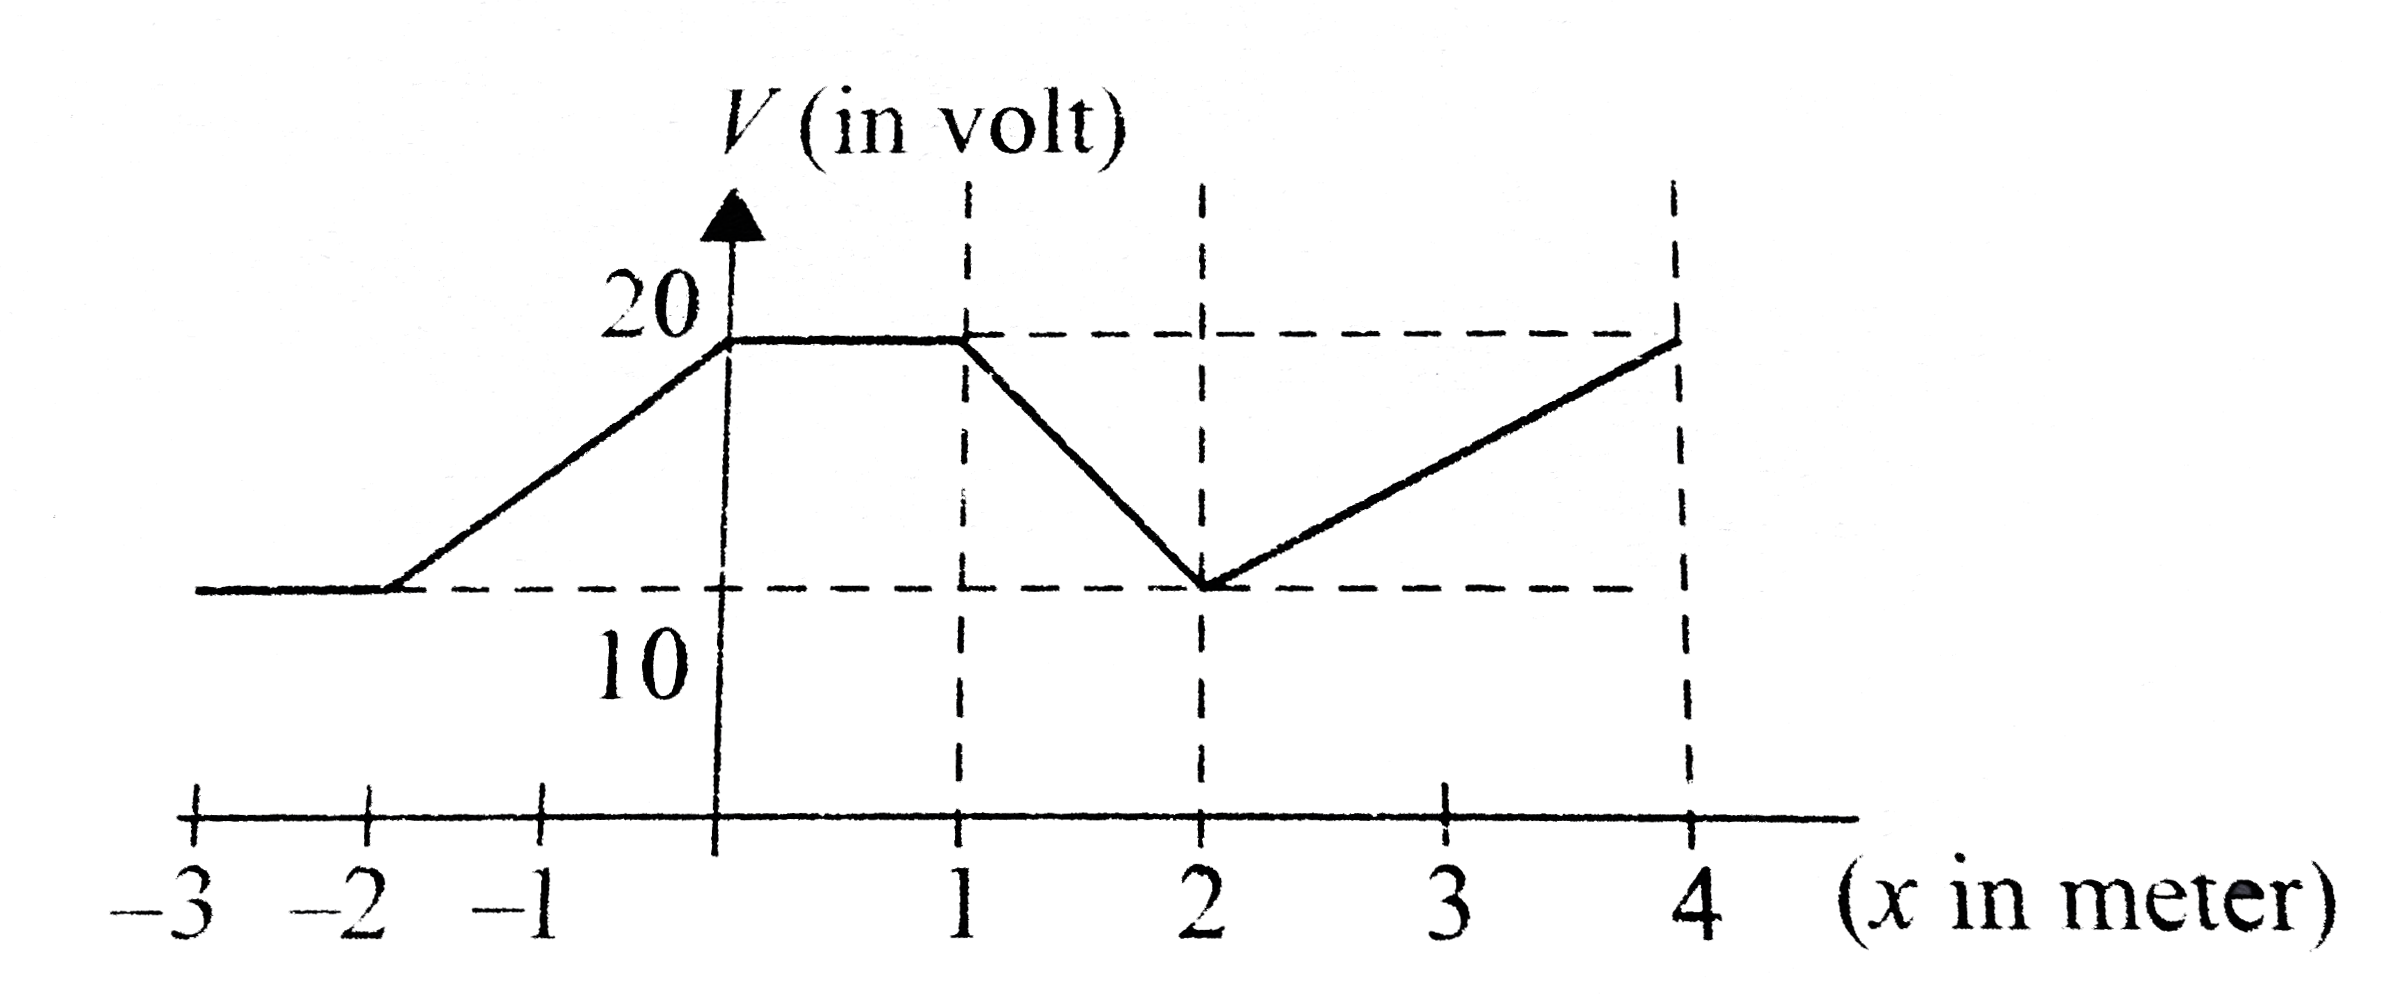
View SolutionThe variation of electric potential for an electric field directed parallel to the x - axis is shown in (Fig. 3.110). Draw the variation of electric field strength with the x- axis.
 .
.
View SolutionThe variation of electric potential for an electric field directed parallel to the x - axis is shown in (Fig. 3.110). Draw the variation of electric field strength with the x- axis.
 .
.
View SolutionThe slope of the graph showing the variation of potential difference V on X-axis and current Y-axis gives conductor
View Solution

