U-V DIAGRAM FOR CONVEX LENS
To create a step-by-step text solution for the U-V diagram of a convex lens, we will follow the concepts discussed in the video transcript.
1. Understanding the Variables:
- Let U be the distance of the object from the lens.
- Let V be the distance of the image from the lens.
- Let F be the focal length of the lens.
2. Lens Formula:
- The relation between U, V, and F is given by the lens formula:
1V−1U=1F
3. Setting Up the U-V Diagram:
- On the X-axis, plot U (object distance).
- On the Y-axis, plot V (image distance).
- Rearranging the lens formula gives:
1V=1F+1U
- This can be rewritten as:
1Y−1X=1F
- This equation represents a hyperbola.
4. Identifying Key Points:
- When U→−∞ (object at infinity):
- The image distance V approaches F (focus).
- Point: (−∞,F)
- When U=−2F (object at the center of curvature):
- The image distance V is also +2F.
- Point: (−2F,2F)
- When U=−F (object at the focus):
- The image distance V approaches +∞.
- Point: (−F,∞)
5. Considering Virtual Objects:
- When U=−F (virtual object):
- The image distance V approaches −∞.
- Point: (−F,−∞)
- When U→−∞ (parallel rays):
- The image distance V approaches F (focus).
- Point: (−∞,F)
6. Sketching the Hyperbolas:
- Plot the points identified above on the graph.
- The hyperbola for real objects will be in the first quadrant (positive V and negative U).
- The hyperbola for virtual objects will be in the second quadrant (negative V and negative U).
7. Finalizing the U-V Diagram:
- Connect the points smoothly to form the two branches of the hyperbola.
- Label the axes and the key points for clarity.
- Let U be the distance of the object from the lens.
- Let V be the distance of the image from the lens.
- Let F be the focal length of the lens.
- The relation between U, V, and F is given by the lens formula:
1V−1U=1F
- On the X-axis, plot U (object distance).
- On the Y-axis, plot V (image distance).
- Rearranging the lens formula gives:
1V=1F+1U
- This can be rewritten as:
1Y−1X=1F
- This equation represents a hyperbola.
- When U→−∞ (object at infinity):
- The image distance V approaches F (focus).
- Point: (−∞,F)
- When U=−2F (object at the center of curvature):
- The image distance V is also +2F.
- Point: (−2F,2F)
- When U=−F (object at the focus):
- The image distance V approaches +∞.
- Point: (−F,∞)
- When U=−F (virtual object):
- The image distance V approaches −∞.
- Point: (−F,−∞)
- When U→−∞ (parallel rays):
- The image distance V approaches F (focus).
- Point: (−∞,F)
- Plot the points identified above on the graph.
- The hyperbola for real objects will be in the first quadrant (positive V and negative U).
- The hyperbola for virtual objects will be in the second quadrant (negative V and negative U).
- Connect the points smoothly to form the two branches of the hyperbola.
- Label the axes and the key points for clarity.
Similar Questions
Knowledge Check
A convex lens
AIs thicker at the middle than at the edgesBis thicker at the edges than at the middleChas uniform thickness everywhereDis called a diverging lensThe distance v of the real image formed by a convex lens is measured for various object distance u. A graph is poltted between v and u, which one of the following graphs is correct
A B
B C
C D
D
The distance v of the real image formed by a convex lens is measured for various object distance u . A graph is plotted between v and u , which one of the following graphs is correct
A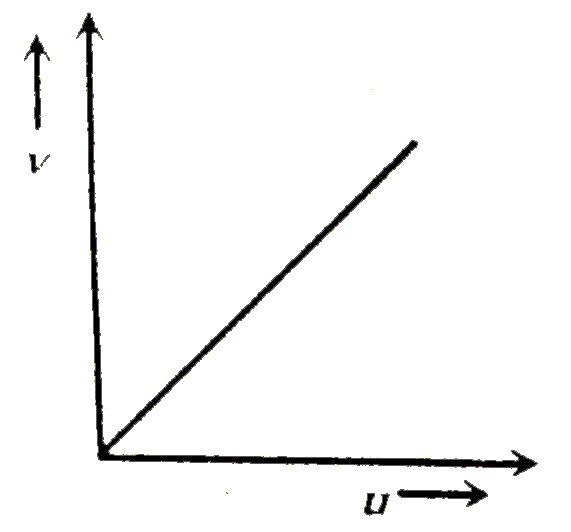 B
B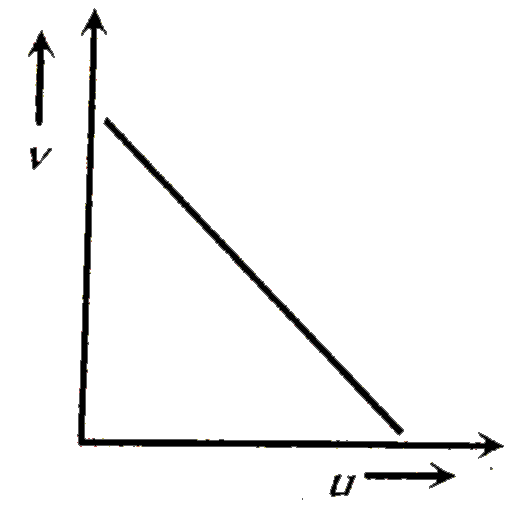 C
C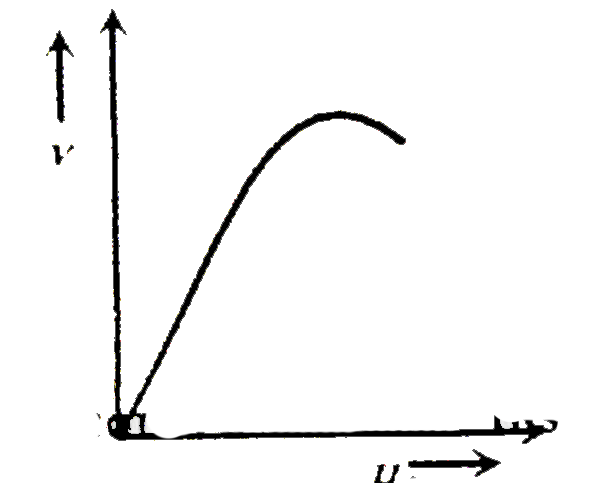 D
D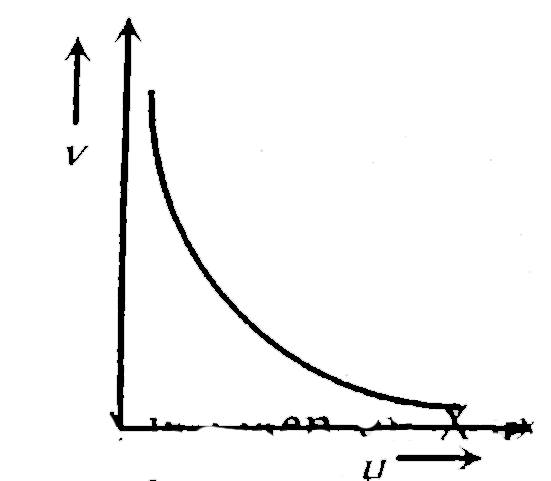
b.Concave lens and Convex Lens.
View SolutionDerive the lens formula 1f=1v−1u for a concave lens, using the necessary ray diagram.
View Solutiona) Explain with the help of a diagram, why the concave lens is also called a diverging lens.
b) Define the principle focus of a convex lens.
View SolutionThe diagram below shown the refracted ray QR through a convex lens.
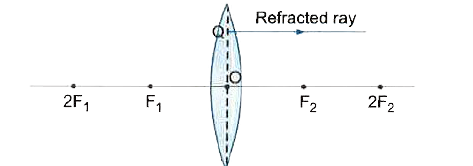
Complete the diagram by drawing the corresponding incident ray.
View Solutiona) With the help of a labelled diagram, explain how a concave lens diverges a beam of parallel light rays. Mark the princple axis, optical center, principle focus and focal length of the convex lens on the diagram.
b) State whether concave lens and convex lens mirror have in common.
View Solution
