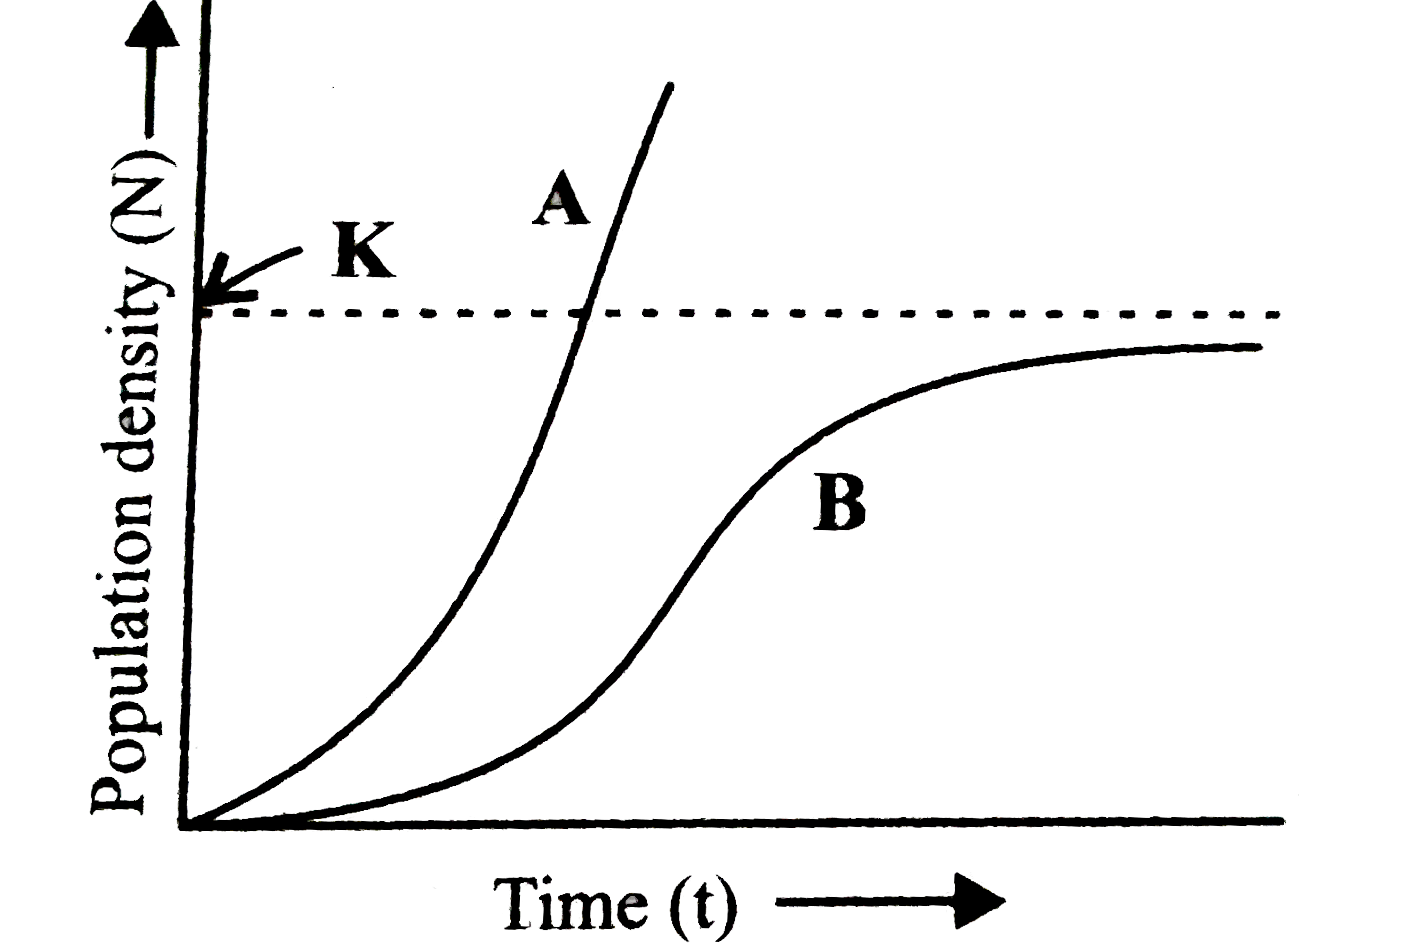
(a) Name the two growth models that represent population growth and draw the respective growth curves they represent.
(b) State the basis for the difference in the shape of these curves.
(c) Which one of the curves represent the human population growth at present? Do you think such a curve is sustainable ? Give reason in support of your answer.
Step by step video & image solution for (a) Name the two growth models that represent population growth and draw the respective growth curves they represent. (b) State the basis for the difference in the shape of these curves. (c) Which one of the curves represent the human population growth at present? Do you think such a curve is sustainable ? Give reason in support of your answer. by Biology experts to help you in doubts & scoring excellent marks in Class 12 exams.
Topper's Solved these Questions
- BOOK - PRADEEPCHAPTER - BIODIVERSITY AND CONSERVATION EXERCISE - PRACTICE QUESTION (ASSERTION REASON TYPE QUESTIONS )10videos
BIODIVERSITY AND CONSERVATION
- BOOK - PRADEEPCHAPTER - BIOTECHNOLOGY AND ITS APPLICATIONS EXERCISE - NCERT EXERCISES PRACTICE QUESTION (II. Assertion Reason Type Question)14videos
BIOTECHNOLOGY AND ITS APPLICATIONS
Similar Questions
Knowledge Check
- Question 1 - Select One
Sigmoid/logistic growth curve is represented by
AdNdt=rNBdNdt=rN(1−N/k)CNt=N0+B+I−D−EDdNdt=1−NK - Question 2 - Select One
High growth at the time of exponential phase of human population growth curve is due to :
Alow birth and death ratesBhigh birth and death ratesChigh birth and death ratesDhigh birth and low death rates - Question 3 - Select One
The equation for J-shaped population growth curve is
AdNdt=rNBdNdt=rN(K−NK)CNt=N0+B+I−D−EDD=NS
Which of the following equations corretly represents the exponential population growth curve ?
View SolutionFormula of a growth which can be represented in linear curve as
View SolutionIn the logistic population growth curve shown below, the rate of growth is greatest at which point?
 View Solution
Arithmetic growth curve is represented by which of the following equation?
View SolutionStudy the population growth curves (A and B) in the given graph and select the incorrect option.
 View Solution

