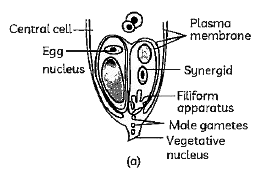
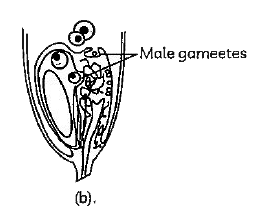
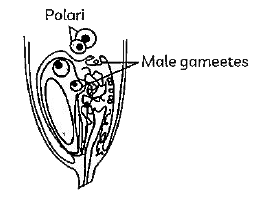
The figure (a) and (b) are depicting:
Entry of pollen tube into filiform appara tus
Fertilisation of germ cells and zygote for mation
Entry of pollen tube into synergids
Entry of pollen tube and the discharge of male gametes into synergids
The correct Answer is:D
Entry of pollen tube and the discharge of male gametes into synergids.
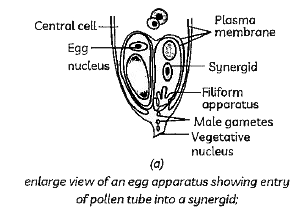
Explanation: Generally pollen tube enters through micropylar end and then enters one of the synergids through the filiform apparatus, The filiform apparatus present at the micropylar part, guides the entry of the pollen tube.
Topper's Solved these Questions
Similar Questions
Knowledge Check
Slides A and B show stages of asexual reproduction in two different organisms:

The slides A and B are depicting:Abinary fission in both Amoeba and YeastBbudding in both Amoeba and YeastCbinary fission in yeast and budding in AmoebaDbinary fission in Amoeba and budding in YeastLichen depicts
AParasitism between alga and fungusBParasitism between protist and bryophyteCSymbiosis between alga and fungusDSymbiosis between alga and gymnosperm
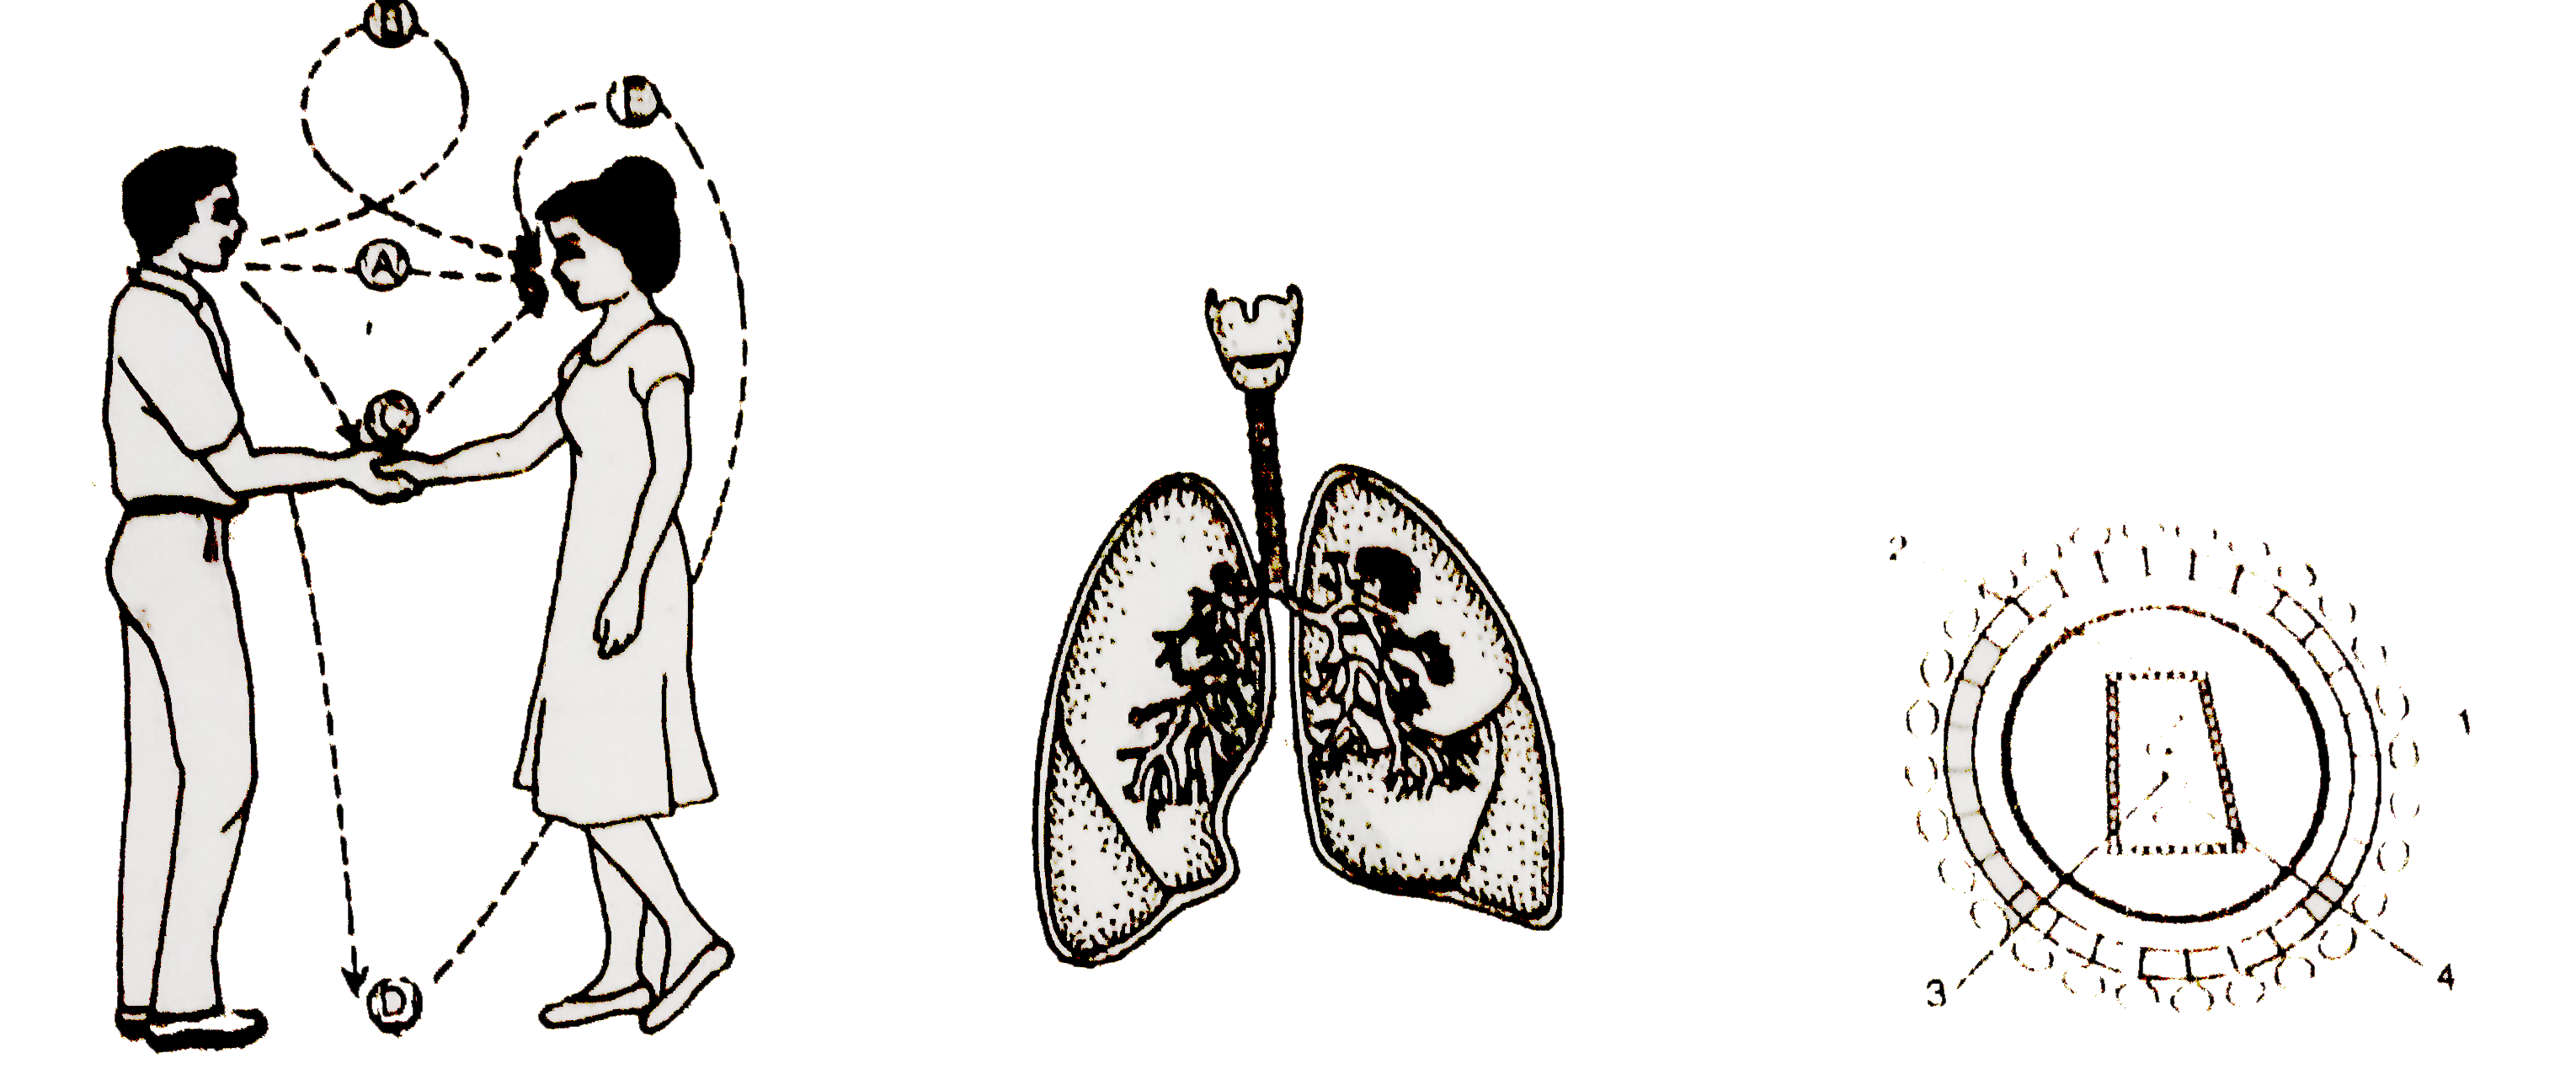
Observe the following figure and answer.
(i) What is shown by this figure?
(ii) What is depicted by labels A,B,C,D and E.
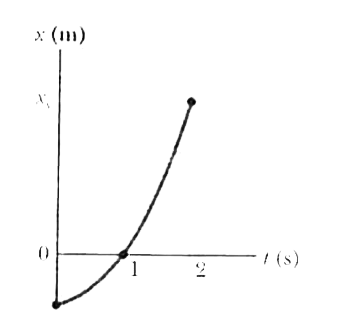
View SolutionFigure 2−19 depicts the motion of a particle moving along an x axis with a constant acceleration. The figure's vertical scaling is set by xs=6.0m. What are the (a) magnitude and (b) direction of the particle's acceleration ?
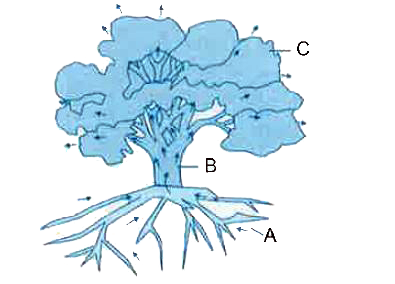
View SolutionIn the given figure , the arrows depict the movement of water in the tree.
(a) What do the arrows A, B and C represent ?
(b) What kind of movement is A and what is C ?
(c) Explain the three forces responsible for uptake of water .
View Solution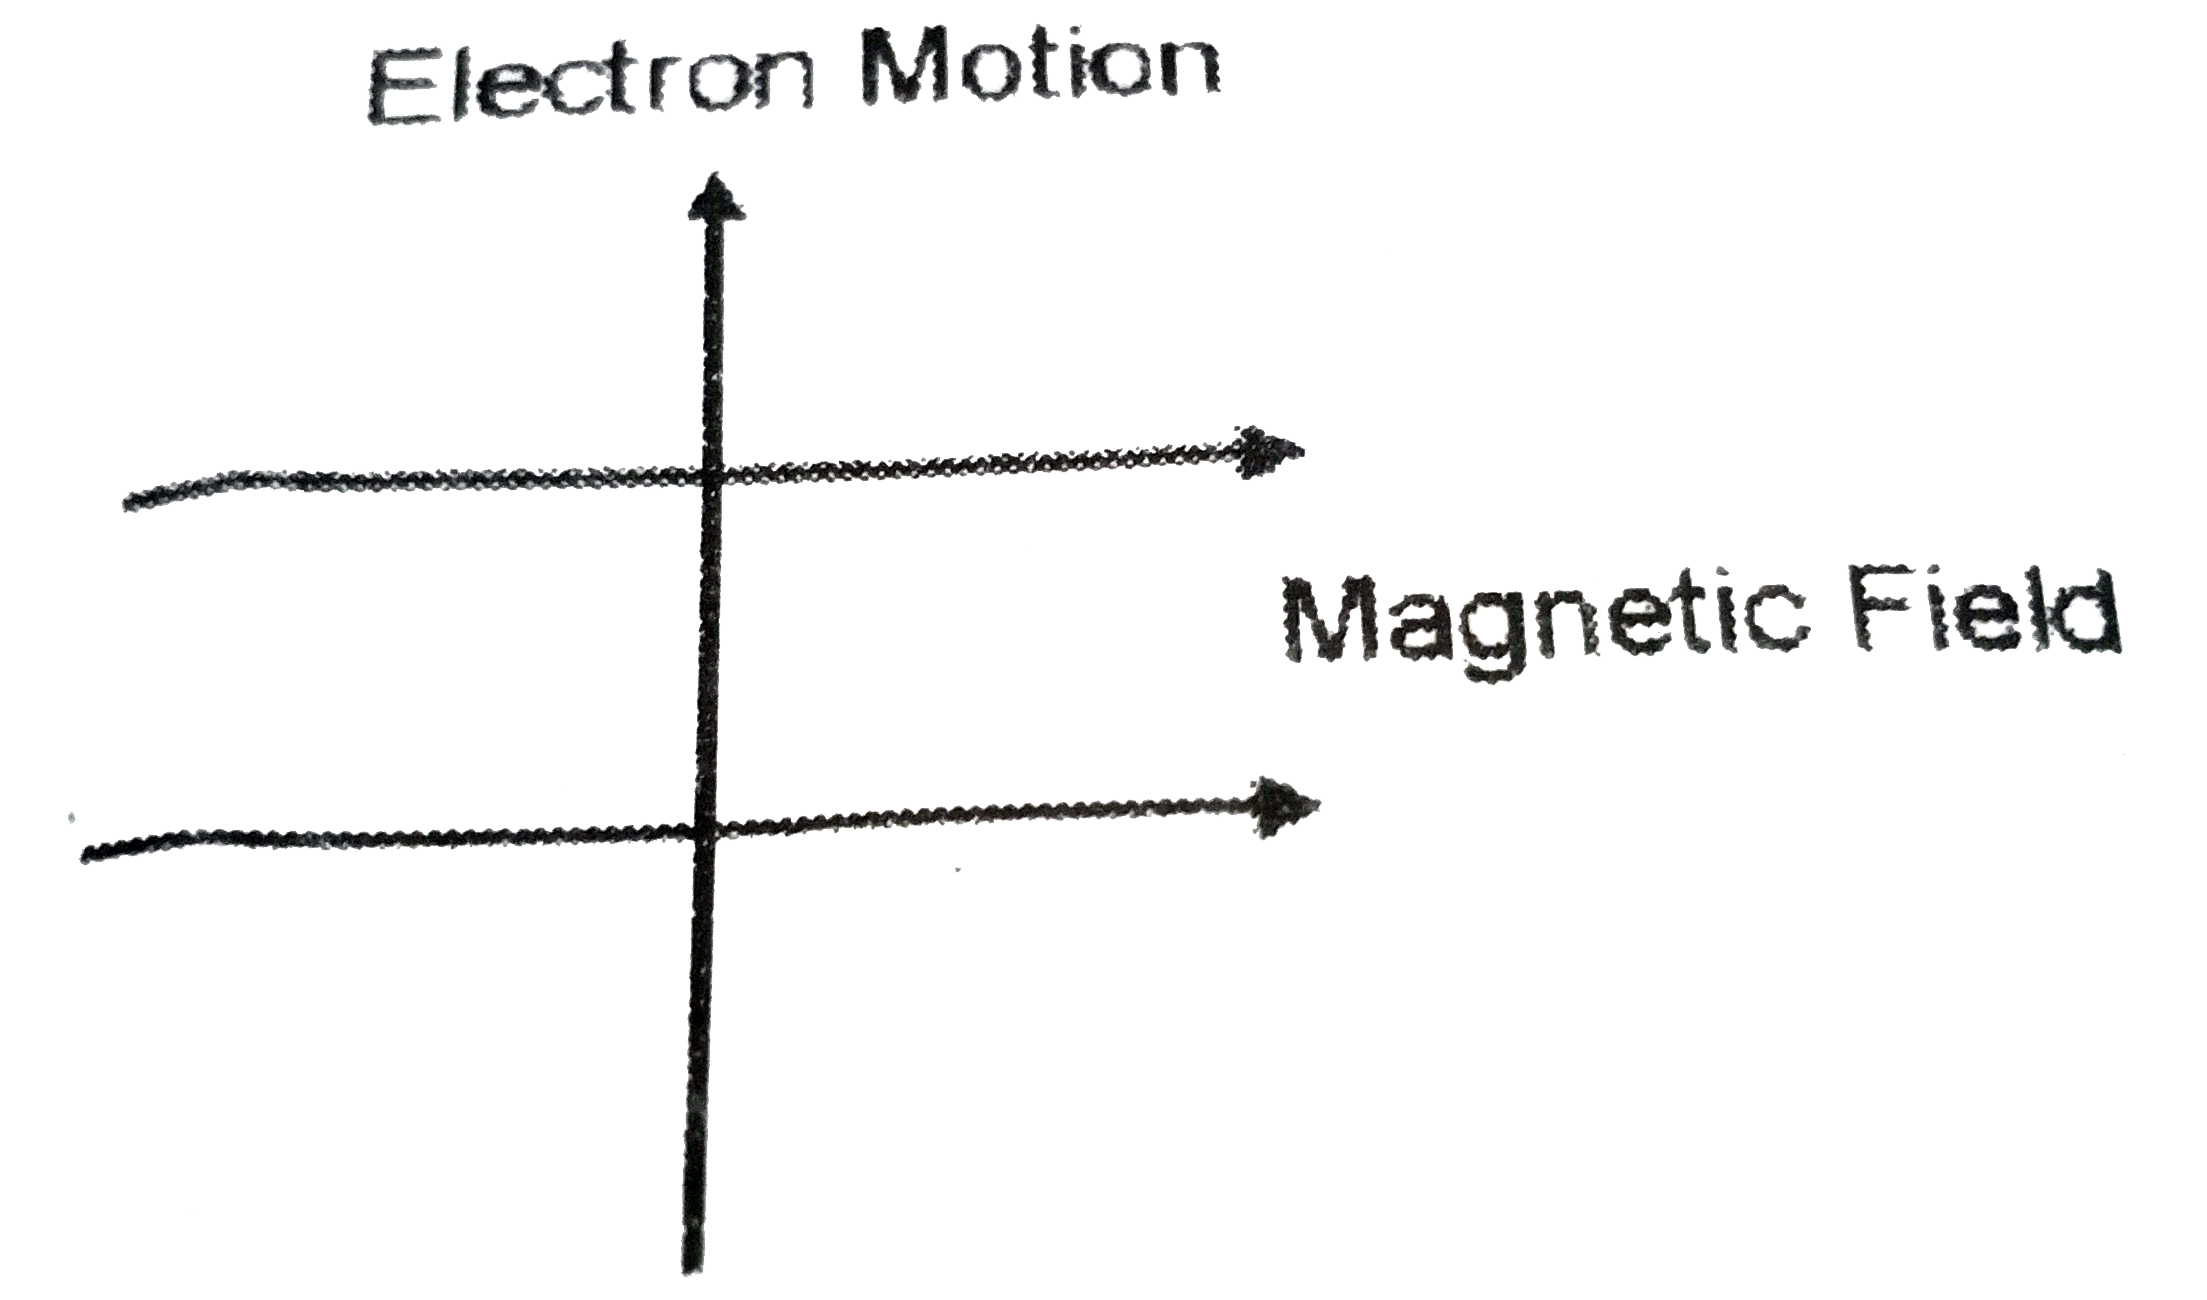
The motion of an electron in presence of a magnetic field is depicted in the figure. Force acting on the electron will be directed
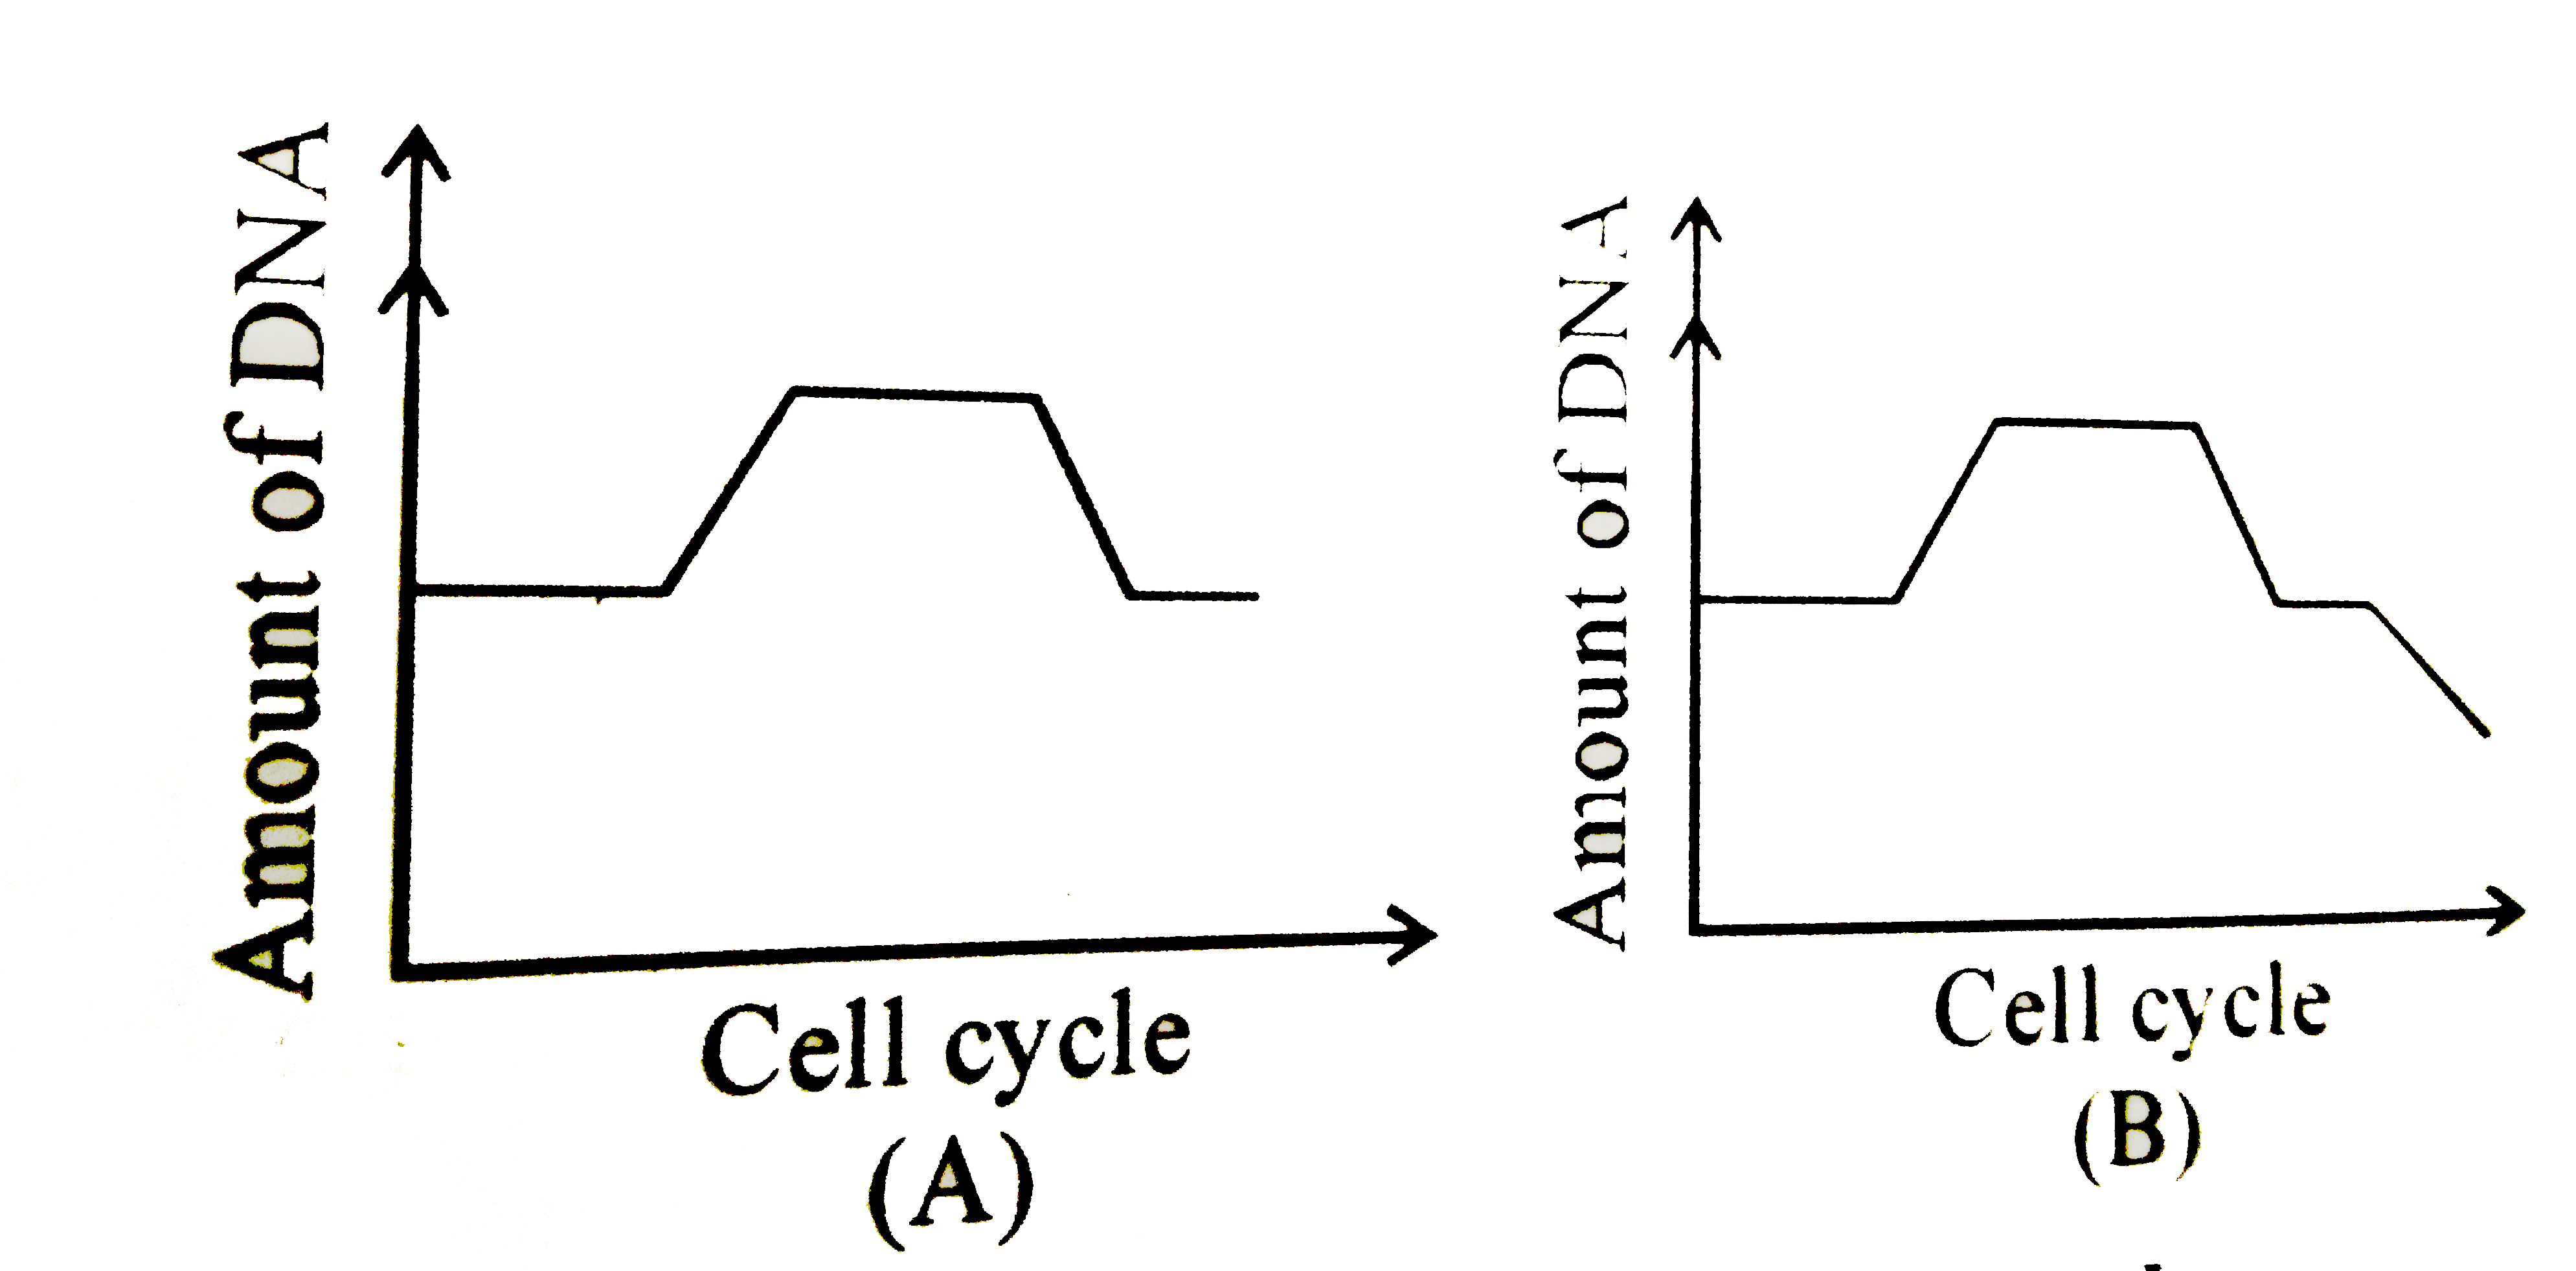
View SolutionThe following graphs (A and B) depicts changes in DNA Content during cell cycle. Identify the cell divison from A and B :-
View SolutionFigures (a),(b)and(c) depict three cyclic processes in the pV−,VT−,andpT− cooroinates. The ourvi linear sections in Figure (a) are isotherms. Depict the same processes in the pT- and VT-eoordinates (for process (a)), the pV−andpT− coordinates (for process (b)), and the pV−andVT− coordinates (for process (c)).
View Solution


