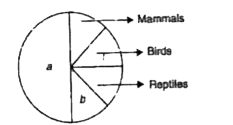
Name the unlabelled areas 'a' and 'b' of the pie chart representing biodiversity of vertebrates showing the proportionate number of species of major taxa.
 Solution in Punjabi
(a) Fishes, (b) Amphibians
Topper's Solved these Questions
- BOOK - BETTER CHOICE PUBLICATIONCHAPTER - BIODIVERSITY AND CONSERVATIONEXERCISE - SHORT ANSWER TYPE QUESTIONS (3 MARKS)13videos
BIODIVERSITY AND CONSERVATION
- BOOK - BETTER CHOICE PUBLICATIONCHAPTER - BIODIVERSITY AND CONSERVATIONEXERCISE - SHORT ANSWER TYPE QUESTIONS (MOST EXPECTED QUESTIONS 3 MARKS)16videos
BIODIVERSITY AND CONSERVATION
- BOOK - BETTER CHOICE PUBLICATIONCHAPTER - BIODIVERSITY AND CONSERVATIONEXERCISE - SHORT ANSWER TYPE QUESTIONS ( 2 MARKS)12videos
BIODIVERSITY AND CONSERVATION
- BOOK - BETTER CHOICE PUBLICATIONCHAPTER - BIOTECHNOLOGY AND ITS APPLICATIONSEXERCISE - LONG ANSWER TYPE QUESTIONS18videos
BIOTECHNOLOGY AND ITS APPLICATIONS
Similar Questions
Give the main causes of extinction of a species by human intervention.
02:16View SolutionWhat is the significance of the slope of regression in a species - area relationship?
02:05View SolutionExplain what is meant by species diversity.
View SolutionExplain the role of biotechnology in therapeutics.
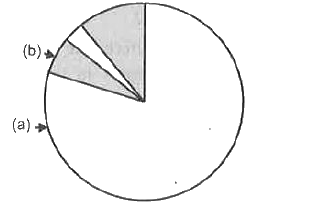
01:14View SolutionThe given pie diagram represents the proportionate number of species of major taxa of vertebrates. Identify the group A and B.
 02:00View Solution
Identify the groups of organism marked A and B in the given pie diagram representing the proportionate number of species of major taxa of plants.
01:39View SolutionGlobal biodiversity representing proportionate number of species of major taxa of invertebrates, vertbrates and plants are given below , Identify I,II and III by selecting the correct option :
 01:38View Solution
Identify 'a' and'b' in the figure given below representing proportionate number of major vertebrate taxa.
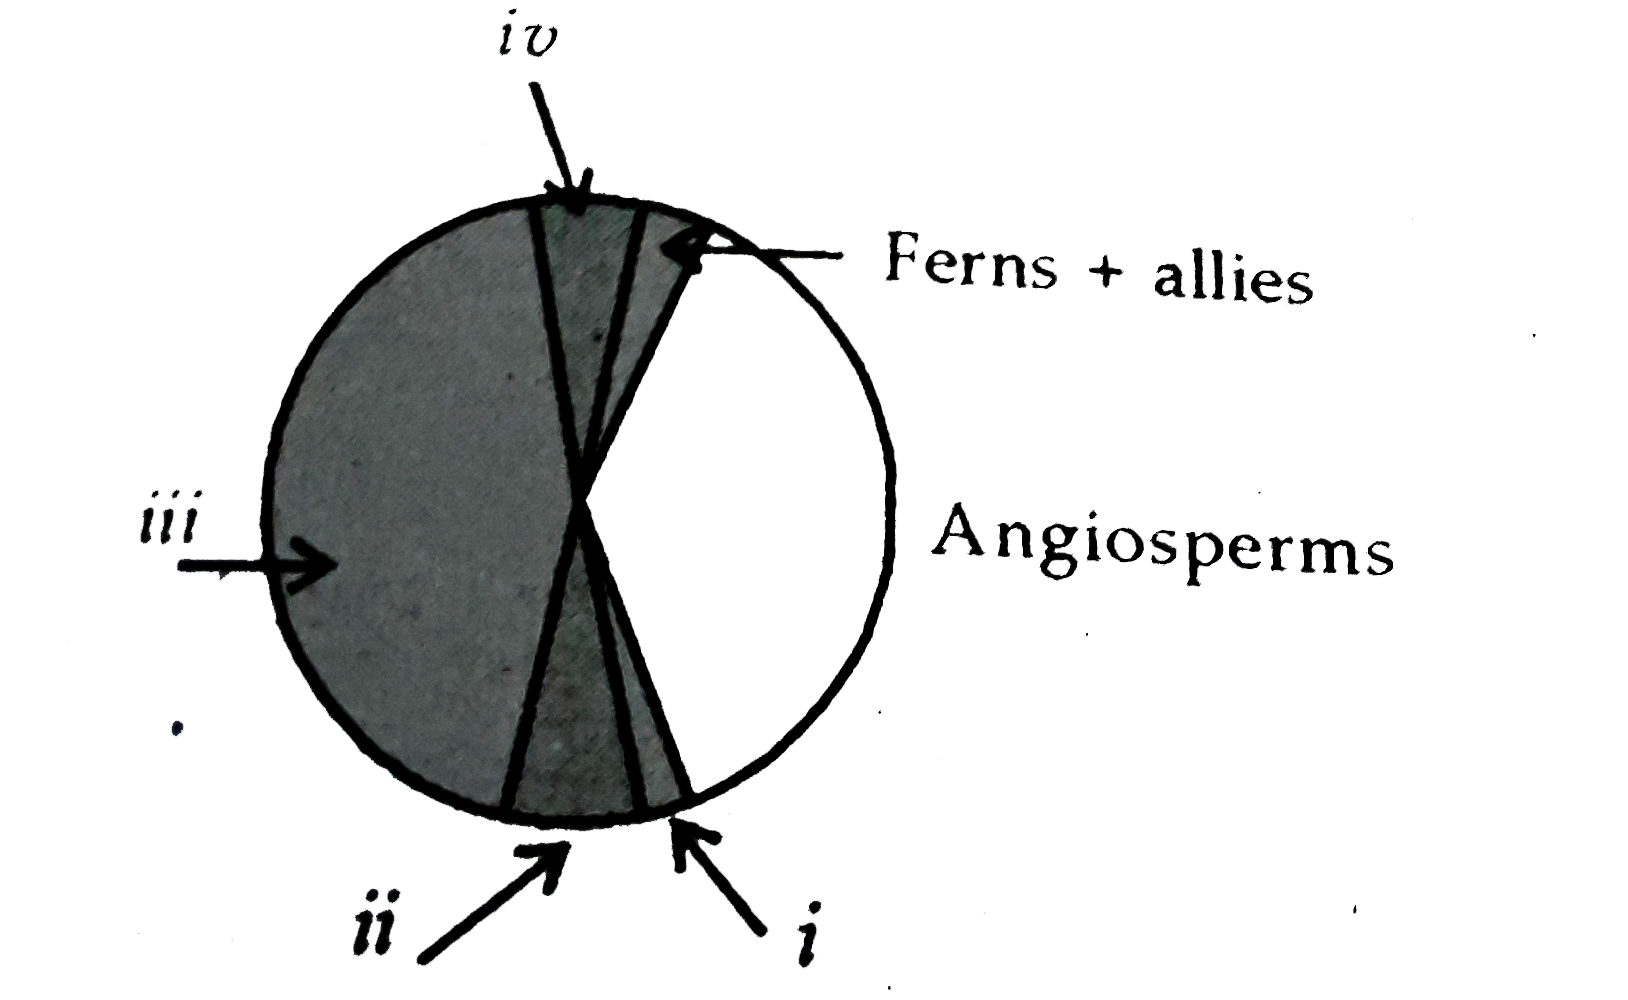
02:01View SolutionIndentify the areas labelled (i), (ii), (iii) and (iv) in the pie chart given below representing the biodiversity of plants showing their proportionate number of species of major taxa.
 02:27View Solution
Study the given diagram and answer the following :

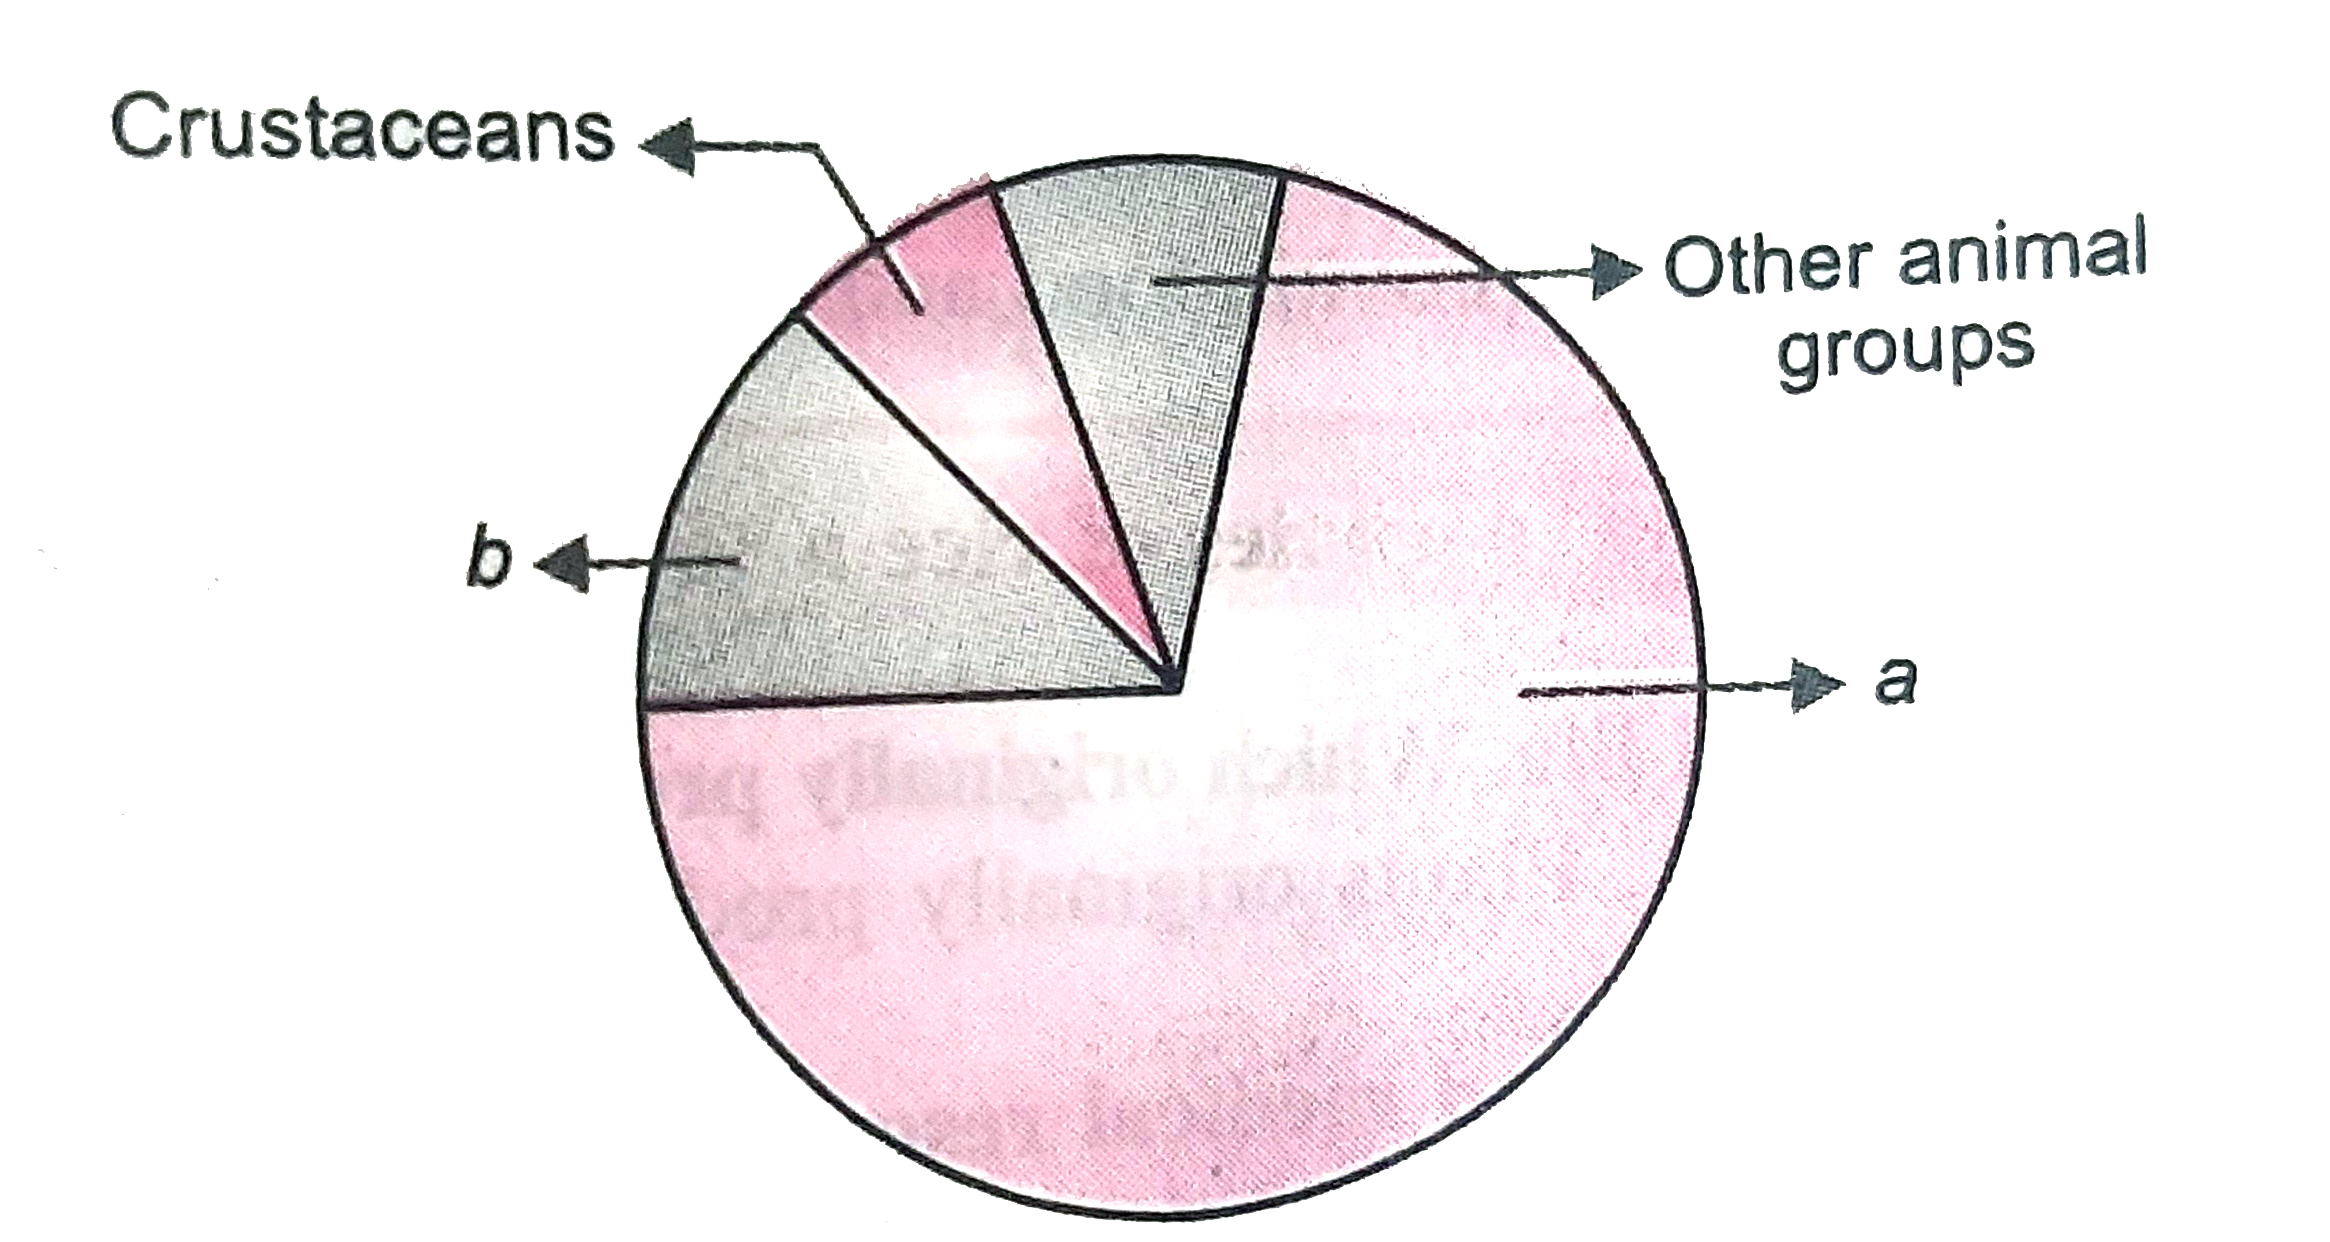
Name the labelled area 'a' and 'b' of the pie diagram representing the global biodiversity of invertebrates showing their proportionate number of species of major taxa.03:19View SolutionName the unlabelled areas 'a' and 'b' of the pie chart representing the biodiversity of plants showing their proportionate number of species of major taxa.
View SolutionName the unlabeled areas 'a' and 'b' of the pie chart (given above) representing the global biodiversity of invertebrates showing their proportionate number of species of major taxa.
 View Solution
Identify 'a' and'b' in the figure given below representing proportionate number of major vertebrate taxa.
02:21View SolutionIdentify the areas labelled (i), (ii), (iii) and (iv) in the pie chart given below representing the biodiversity of plants showing their proportionate number of species of major taxa.
 02:03View Solution
The given pie diagram represents the proportionate number of species of major taxa of vertebrates. Identify the group A and B.
 02:48View Solution
Identify the groups of organism marked A and B in the given pie diagram representing the proportionate number of species of major taxa of plants.
03:27View Solution

