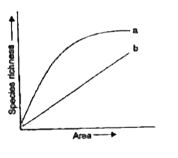
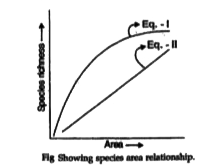
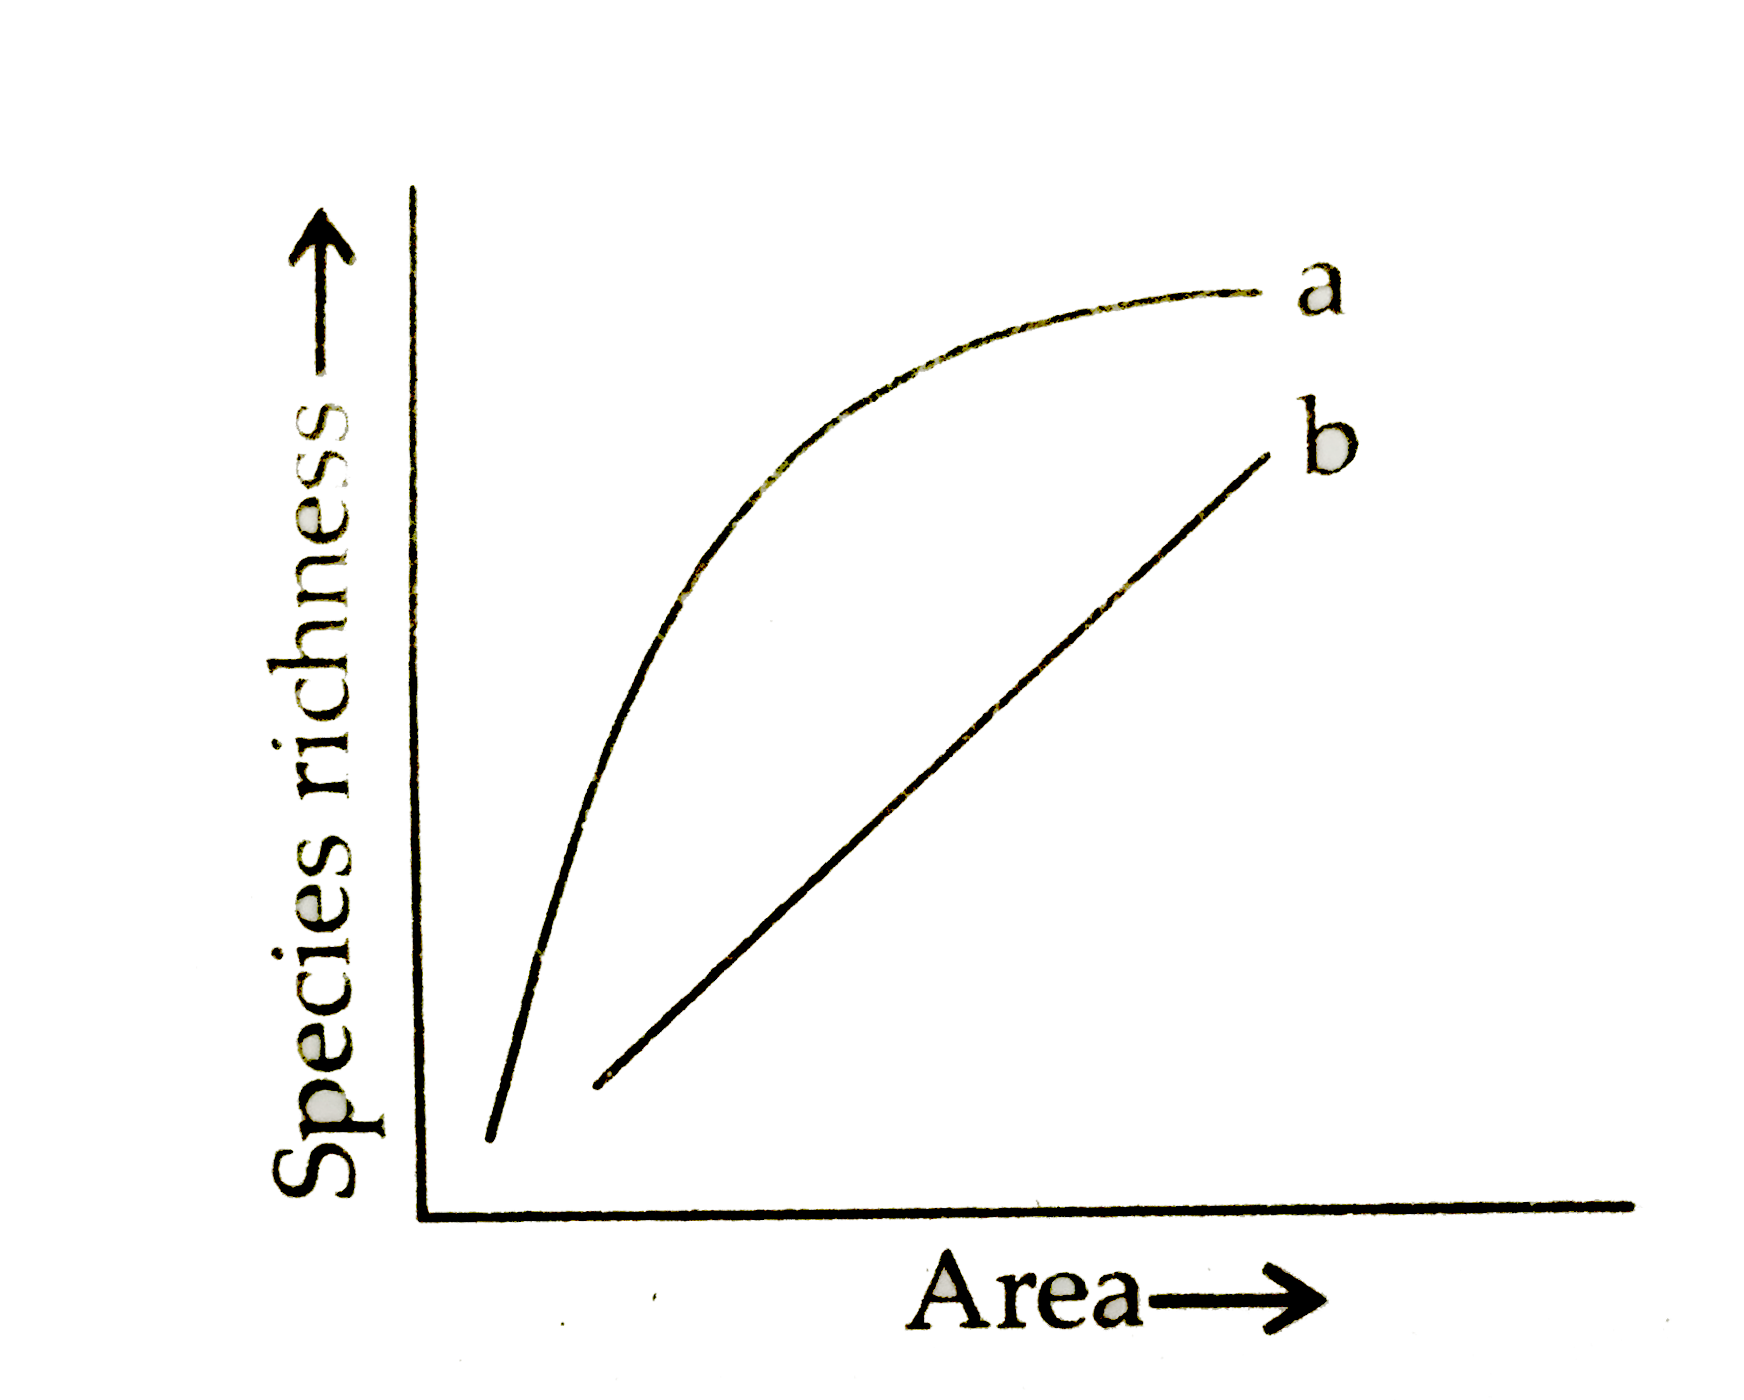
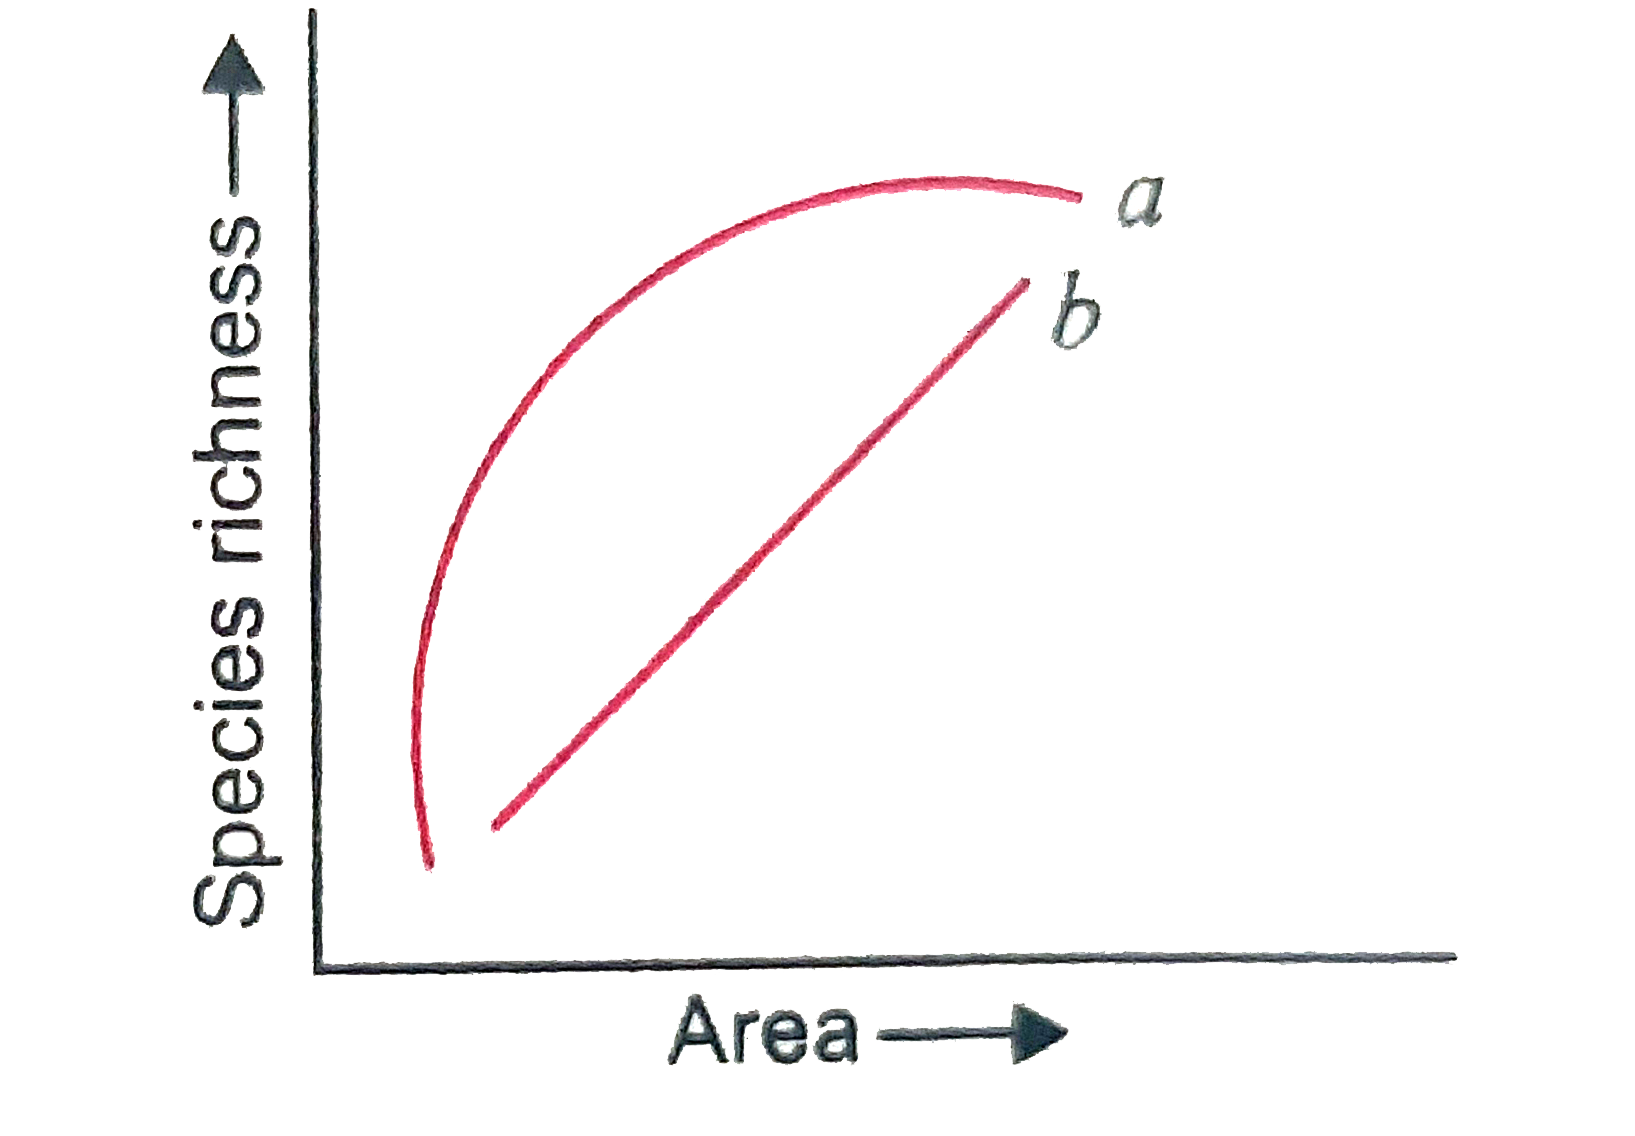
The relation between species richness and area for a wide variety of taxa turns out to be rectangular hyperbola. Give a brief explanation.
The above graph shows Species-Area relationship. Write the equation of the curve 'a' and example.

S=CAz
(i) with a region,species richness increases with increasing explored area but only upto a limit.
(ii) Relationship between species richness and area for a wide variety of taxa turns out to be a rectangular hyperbola.
Topper's Solved these Questions
- BIODIVERSITY AND CONSERVATIONBOOK - BETTER CHOICE PUBLICATIONCHAPTER - BIODIVERSITY AND CONSERVATIONEXERCISE - SHORT ANSWER TYPE QUESTIONS (3 MARKS)
13 Videos
- BIODIVERSITY AND CONSERVATIONBOOK - BETTER CHOICE PUBLICATIONCHAPTER - BIODIVERSITY AND CONSERVATIONEXERCISE - SHORT ANSWER TYPE QUESTIONS (MOST EXPECTED QUESTIONS 3 MARKS)
16 Videos
- BIODIVERSITY AND CONSERVATIONBOOK - BETTER CHOICE PUBLICATIONCHAPTER - BIODIVERSITY AND CONSERVATIONEXERCISE - SHORT ANSWER TYPE QUESTIONS ( 2 MARKS)
12 Videos
- BIOTECHNOLOGY AND ITS APPLICATIONSBOOK - BETTER CHOICE PUBLICATIONCHAPTER - BIOTECHNOLOGY AND ITS APPLICATIONSEXERCISE - LONG ANSWER TYPE QUESTIONS
18 Videos
Similar Questions
The relation between species richness and area for a wide variety of taxa turns out to be a rectangular hyperbola. Give a brief explanation.
View SolutionThe relation between species richness and area for a wide variety of taxa turns out to be a rectangular hyperbola. Give a brief explanation.
View Solution
Knowledge Check
The relation between species richness and area is correctly depicted by
ALogS=logC−ZlogABLogS=ZlogACLogS=logC+ZlogADLogS=logCThe relation between species richness and area for a wide variety of taxa (angiosperm plants, birds, bats, freshwater fishes) is a
AParabolaBRectangular hyperbolaCEllipseDStraight lineThe great German naturalist and geographer Alexander von Humboldt observed that within a region species richness increased with increasing explored area, but only up to a limit. In fact, relation between species richness and area for a wide variety of taxa (angiosperm plants, birds, bats, freshwater fi ishes) turns out to be a rectangular hyperbola. Now find out correct equations shown in the graph.
 AI - S−CAZ II -LogS=logC+ZlogABI - LogS=logC+ZlogA, II - S−CAZCI - S−CAZ+logC, II - LogS=logC+ZlogADI - S−CAZ+logA, II - LogS=logC+ZlogA
The above graph show Species-Area relationship. Write the equation of the curve a and explain.

View SolutionThe above graph show Species-Area relationship. Write the equation of the curve a and explain.

View SolutionThe given graph shows species-area relationship. Write the equation of the curve 'a' and explain.

View SolutionThe relation between species richness and area for a wide variety of taxa (angiosperm plants, birds, bats, freshwater fishes) is a
View SolutionThe graph formed by plotting species richness against area for a wide variety of taxa (angiosperm plants, birds , bats , fresh water fishes , etc) turns out to be a
View Solution
