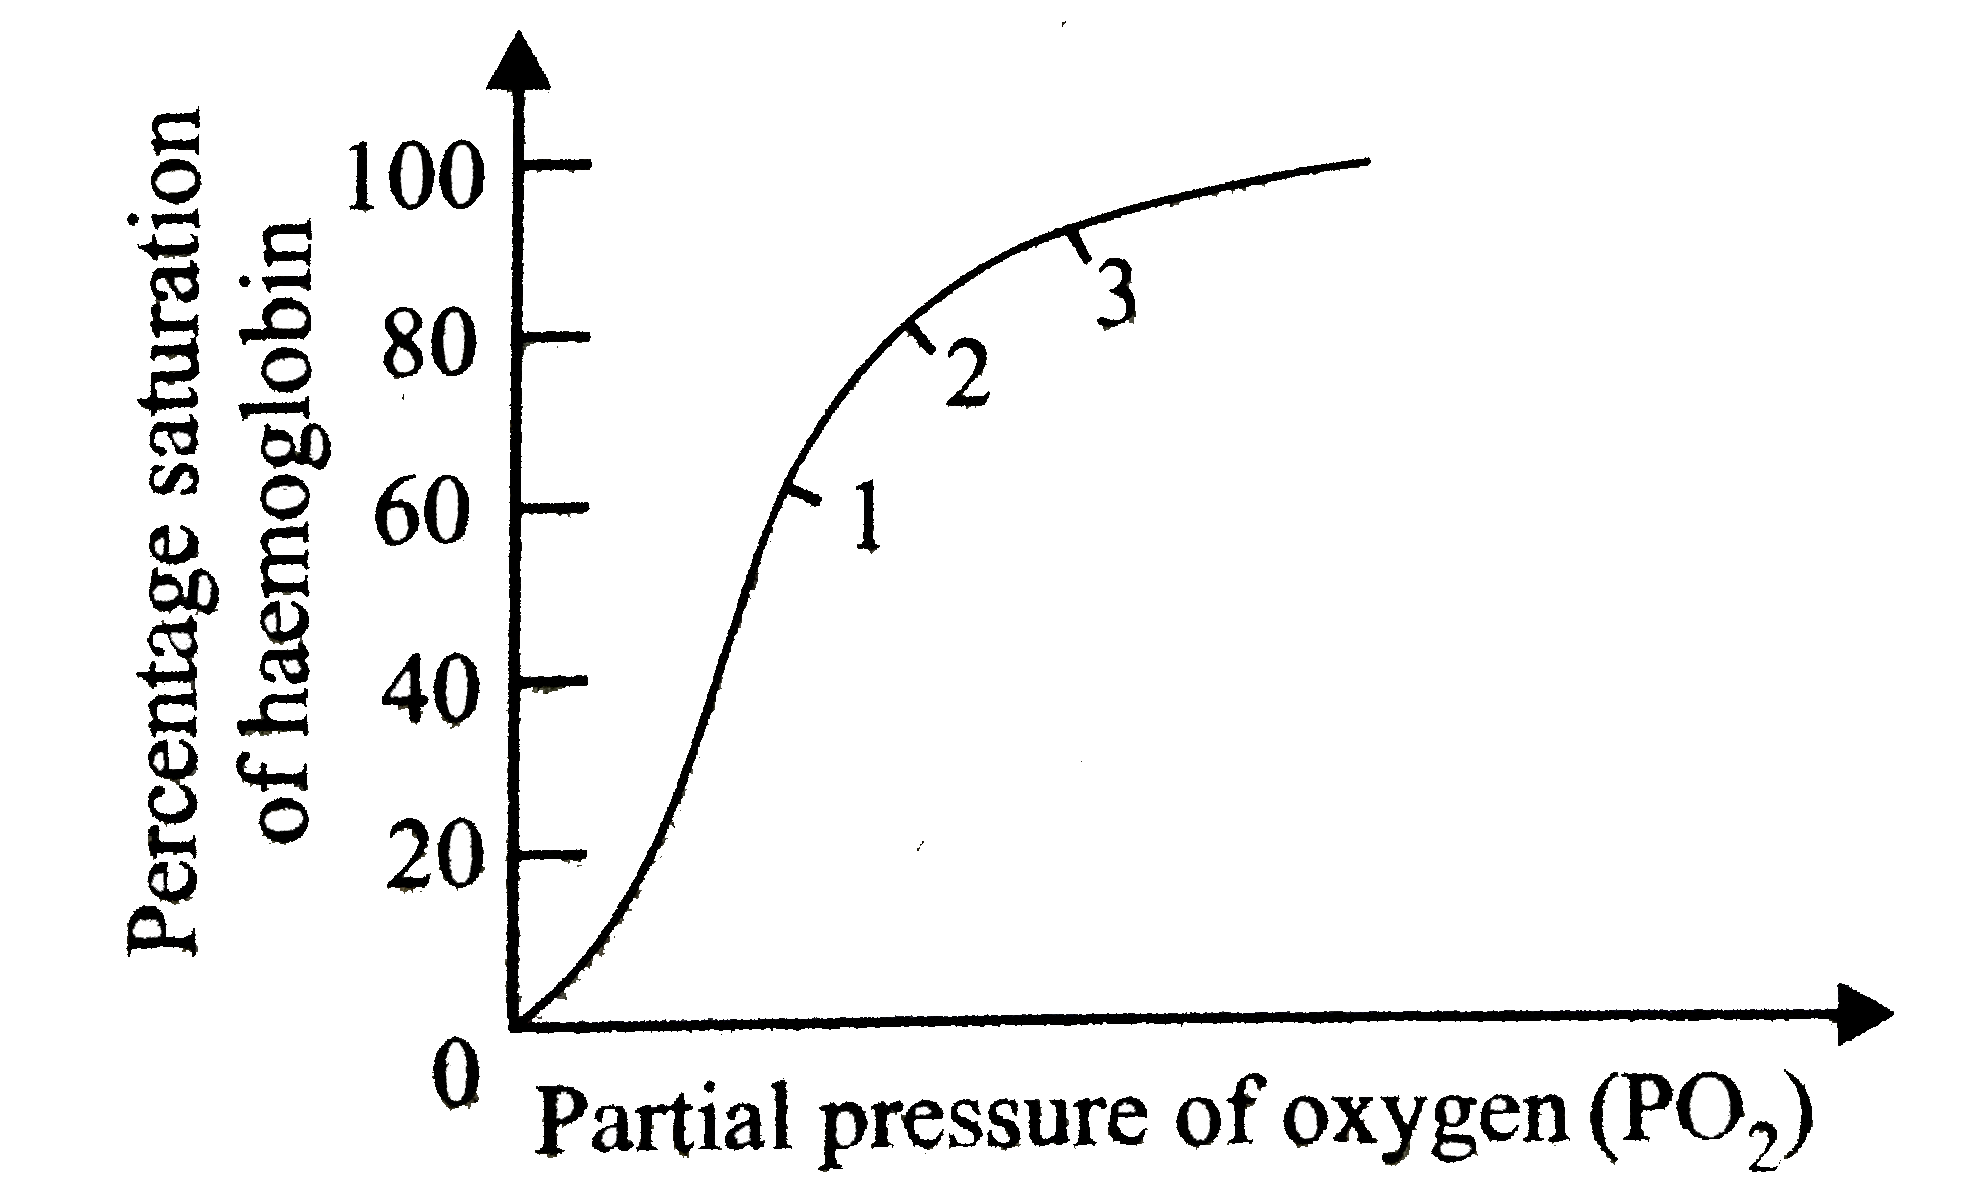
Oxygen dissociation curve of haemoglobin is
sigmoid
hyperbolic
hypobolic
hypobloic
The correct Answer is:A
Step-by-Step Solution:
1. Understanding the Oxygen Dissociation Curve: The oxygen dissociation curve of hemoglobin, also known as the oxyhemoglobin dissociation curve, is a graphical representation that shows how hemoglobin binds to oxygen at different partial pressures of oxygen (pO2).
2. Axes of the Curve: The curve is plotted with the proportion of hemoglobin that is saturated with oxygen on the vertical axis (y-axis) and the partial pressure of oxygen (pO2) on the horizontal axis (x-axis).
3. Shape of the Curve: The oxygen dissociation curve is characterized by a sigmoidal (S-shaped) curve. This shape indicates that hemoglobin's affinity for oxygen increases as more oxygen molecules bind to it.
4. Significance of the Sigmoidal Shape: The sigmoidal shape of the curve reflects cooperative binding, meaning that the binding of one oxygen molecule to hemoglobin increases the likelihood of additional oxygen molecules binding. This is crucial for efficient oxygen uptake in the lungs and release in the tissues.
5. Conclusion: Based on the understanding of the oxygen dissociation curve and its characteristics, the correct answer to the question is that the oxygen dissociation curve of hemoglobin is sigmoid.
Final Answer:
The oxygen dissociation curve of hemoglobin is sigmoid.
---
The oxygen dissociation curve of hemoglobin is sigmoid.
Topper's Solved these Questions
Similar Questions
Knowledge Check
The given graph shows an oxygen dissociation curve for haemoglobin.

Wher is the body will haemoglobin be saturated at the percentage shown at point 1,2 and 3 in graph ?ALeft ventriclePulmonary veinVena cava123BLeft ventriclePulmonary veinVena cava213CLeft ventriclePulmonary veinVena cava231DLeft ventriclePulmonary veinVena cava321The oxygen dissociation curve is
AparabolaBslopeCsigmoidDstright line.
Oxygen dissociation curve is
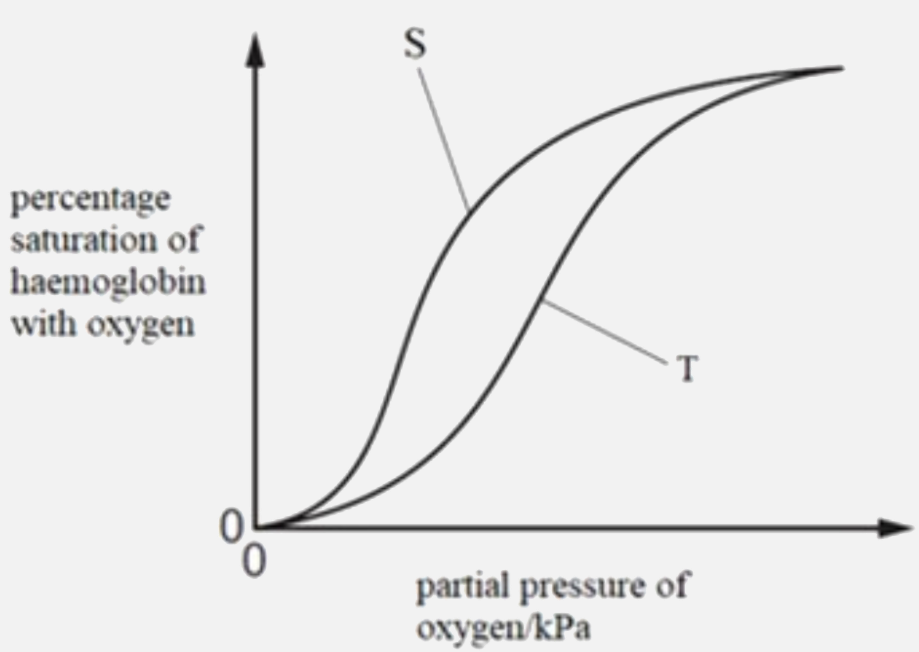
View SolutionThe graph shows the oxygen dissociation curves of haemoglobin from two species of mammals, s and T .

Which statements could explain the difference in the oxygen dissociation curves of species S and species T ?
I. Species T has higher haemoglobin concentration in its red blood cells than species S.
II. The haemoglobin in species T has a lower affinity for oxygen than the haemoglobin in species S.
III. Species T may be living at a higher altitudes than species S.
View SolutionWhat is the shape of O2 dissociation curve for haemoglobin ?
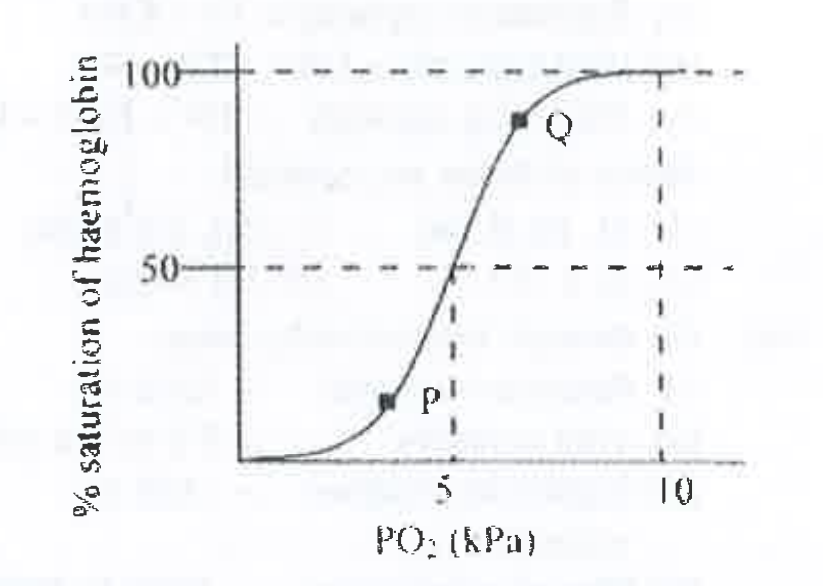
View SolutionOxygen saturation curve of haemoglobin molecule is show in the graph

The correct representation of haemoglobin molecule at points p and q is respectively
View SolutionAssertion :− Low concentration of oxygen allow dissociation of oxyhaemoglobin.
Reason :− CO has more affinity with Haemoglobin as compares to oxygen.
View SolutionO2 dissociation curve is:
View Solution
