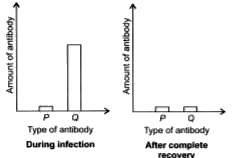
The given graphs show the amount of different antibodies P and Q in the blood of a person during a pathogenic infection and after complete recovery .
What could be inferred from the given graphs?
The person might have suffered from two pathogenic infections simultaneously for which his body produced antibodies P and Q.
The person has acquired artificial active immunity for pathogen against which his body produced antibody Q.
This time the person suffered from the pathogenic infection for which his body produced antibody Q.
The person has acquired passive immunity for both the pathogens for which his body produced antibodies P and Q.
The correct Answer is:C
The given graphs indicate that this time the person has suffered from pathogenic disease for which his body produced antibody Q as its amount was very high during infection which reduced significantly after recovery. Antibody P is present in small amount consistently in the person.s blood which indicates that they are memory cells and the person is either vaccinated for this pathogen (artificial active immunity) or has contracted the pathogenic disease and recovered from it (natural active immunity). Small amount of antibody Q in the blood after recovery from infection is actually the memory cells which shows that person has acquired natural active immunity against this disease.
Topper's Solved these Questions
Similar Questions
Knowledge Check
- Question 1 - Select One
Ritu was suffering from high fever for many days. Doctor advised her some antipyretic which she took according to the prescribed doses. Her temperature went down to normal but reoccurrence of fever continued. Doctor then advised Ritu to get her blood test done to rule out the presence of some antibodies and then gave her medications accordingly. She recovered soon. The given graphs show the result of her blood tests during illness (graph I) and after recovery (graph II).
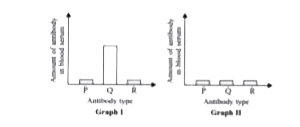
What could be inferred from the given graphs?ARitu suffered from three kinds of pathogenic infections simultaneously.BThis time Ritu suffered only from that pathogenic infection for which her body produced antibody Q.CRitu might be vaccinated or had contracted the actual diseases in her life for which her body produced antibodies P and R.DBoth (b) and (c) - Question 2 - Select One
The graphs show the concentration of glucose and insulin in the blood of healthy person. Which graph show she changes expected after a meal containing starch?
A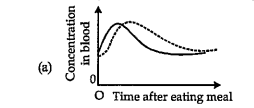 B
B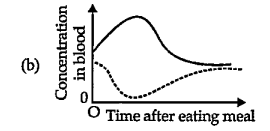 C
C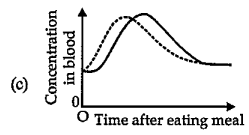 D
D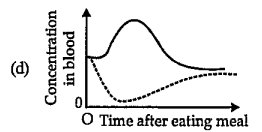
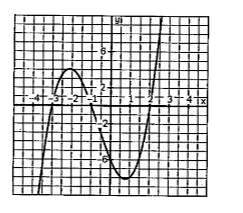
What are the number of zeroes of p(x) for the given graph?
 View Solution
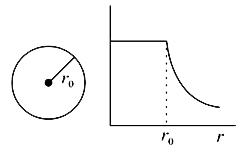
The given graph shows variation (with distance r from centre) of:
 View Solution
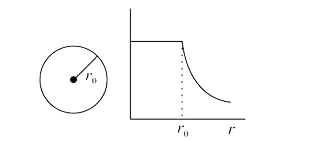
The given graph shows variation (with distance r from centre) of:
 View Solution
The line graph shows the production of product A and B (in thousands) during the period 2004 to 2009 and the second line Graph shows the percentage sale of these products.

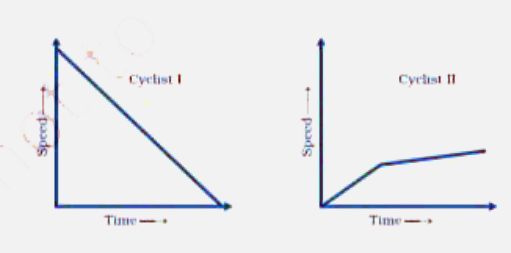
In the given line graph, what is the total sale of Products A and B in the year 2007?View SolutionThe given graphs show the progress of two different cyclists during a ride. For each graph, describe the rider’s progress over the period of time.
 View Solution
The line graph shows the production of product A and B during the period 2004 to 2009 and the second line graph shows the percentage sale of these products
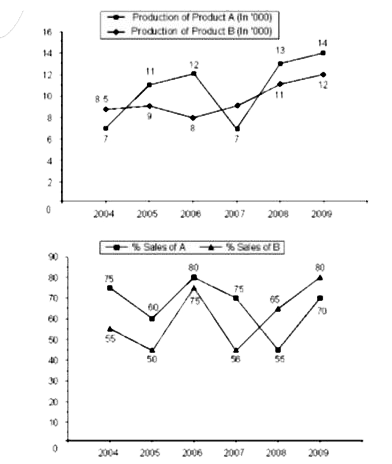
In the given line graph, what is the total sale of products A and B in the year 2007View Solution


