The given graphs show the progress of two different cyclists during a ride. For each graph, describe the rider’s progress over the period of time.
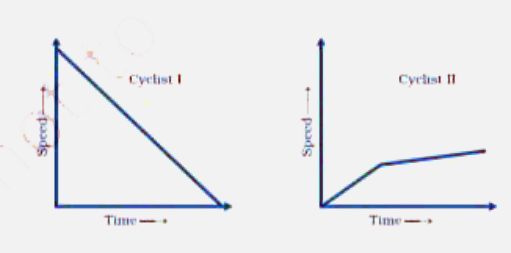
Step by step video & image solution for The given graphs show the progress of two different cyclists during a ride. For each graph, describe the rider’s progress over the period of time. by Maths experts to help you in doubts & scoring excellent marks in Class 8 exams.
Topper's Solved these Questions
- BOOK - NCERT EXEMPLARCHAPTER - INTRODUCTION TO GRAPHS EXERCISE - THINK AND DISCUSS4videos
INTRODUCTION TO GRAPHS
- BOOK - NCERT EXEMPLARCHAPTER - INTRODUCTION TO GRAPHS EXERCISE - EXERCISE86videos
INTRODUCTION TO GRAPHS
- BOOK - NCERT EXEMPLARCHAPTER - EXPONENTS AND POWERSEXERCISE - EXERCISE195videos
EXPONENTS AND POWERS
- BOOK - NCERT EXEMPLARCHAPTER - LINEAR EQUATIONS IN ONE VARIABLEEXERCISE - THINK AND DISCUSS3videos
LINEAR EQUATIONS IN ONE VARIABLE
Similar Questions
The given bar graph shows the number of students of two schools over a period of six years.
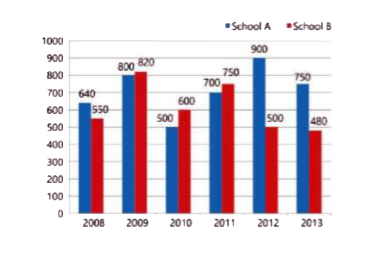
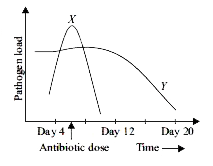
In the bar graph, what is the ratio of the average of total students from school B to the average of total students from school A?View SolutionThe given graph shows the pathogen load in the body of a person during the period of sickness.
Now select the correct option regarding this.
 View Solution
Knowledge Check
- Question 1 - Select One
The given bar graph shows the number of students of two schools over a period of six years.
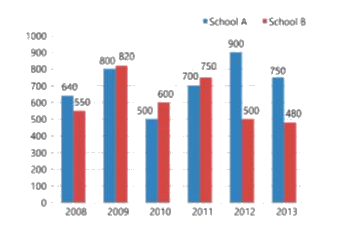
In the bar graph, what is the ratio of the average of the total students from school A to the average of the total students from school B ?A429:799B370:429C429:370D799:429 - Question 2 - Select One
A motorist and a scooterist made a journey of 120 km at the same time and form the same place. The graph shows the progress of the journey made by each person. Study the graph and answer the questions.
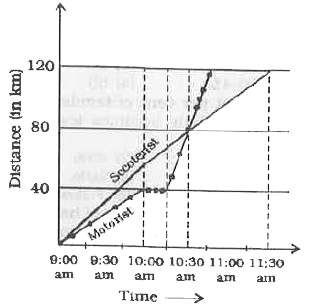
What was the speed of the scooterist during the journey ? (in kmph)A45B48C42D46 - Question 3 - Select One
The given line graph shows the growth rate of a kitten . During which 2 - month period, the kitten's weight increased the most
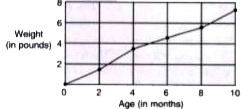 A0 to 2 monthsB2 to 4 monthsC4 to 6 monthsD6 to 8 months
In the following graph. the displacements of a particle of a progressive wave at different times are shown. Refer to this graph and answer the questions given below.
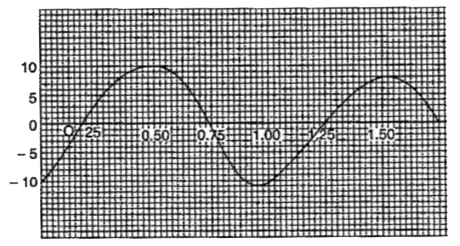
The period of vibration of the particle isView SolutionA motorist and a scooterist made a journey of 120 km at the same time and form the same place. The graph shows the progress of the journey made by each person. Study the graph and answer the questions.
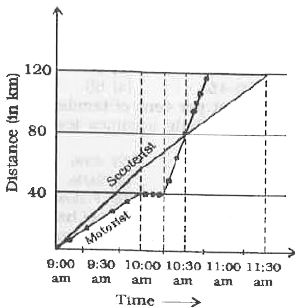
At what time did the motorist meet the scooterist ?View SolutionA motorist and a scooterist made a journey of 120 km at the same time and form the same place. The graph shows the progress of the journey made by each person. Study the graph and answer the questions.
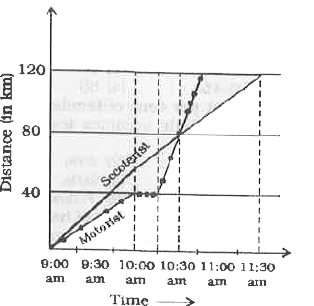
The scooterist completes the journey in (hours) :View SolutionA motorist and a scooterist made a journey of 120 km at the same time and form the same place. The graph shows the progress of the journey made by each person. Study the graph and answer the questions.
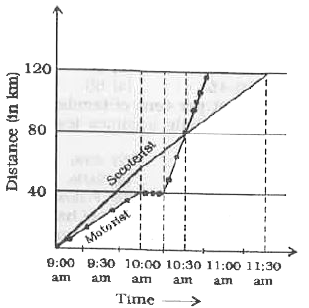
How far, from the start, did the motorist meet the scooterist ? (in km)View SolutionThe given bar graph shows the biscuit exports of India over a period of five years. Study the graph and answer the questions that follows

In which two year was the value per tonne equal?View Solution

