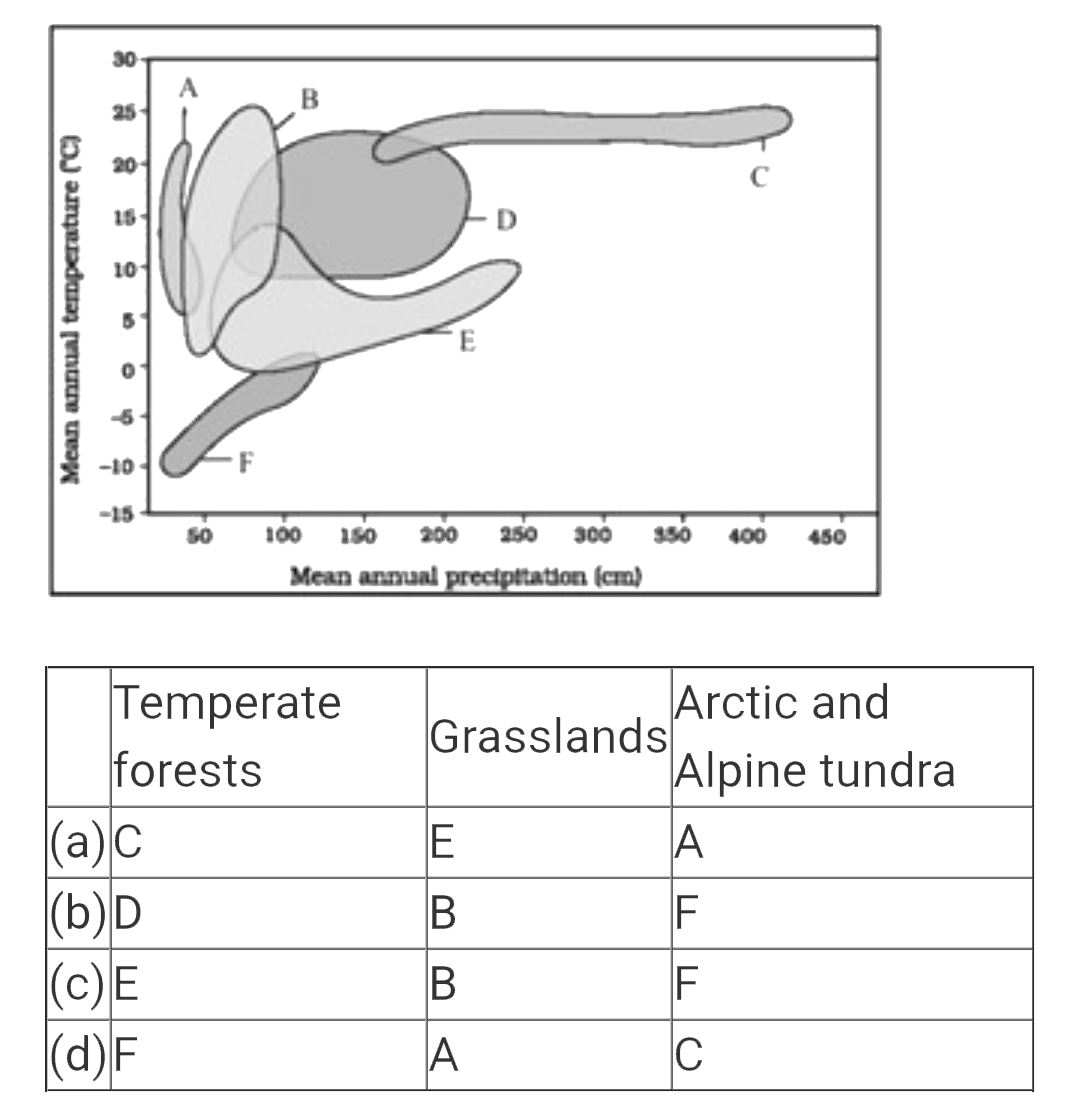
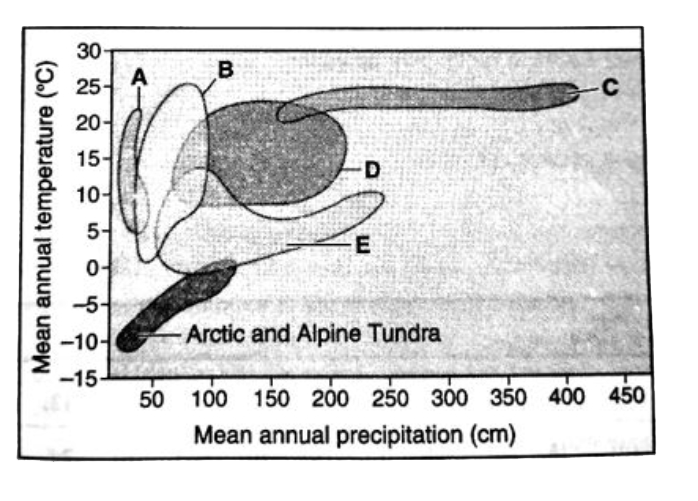
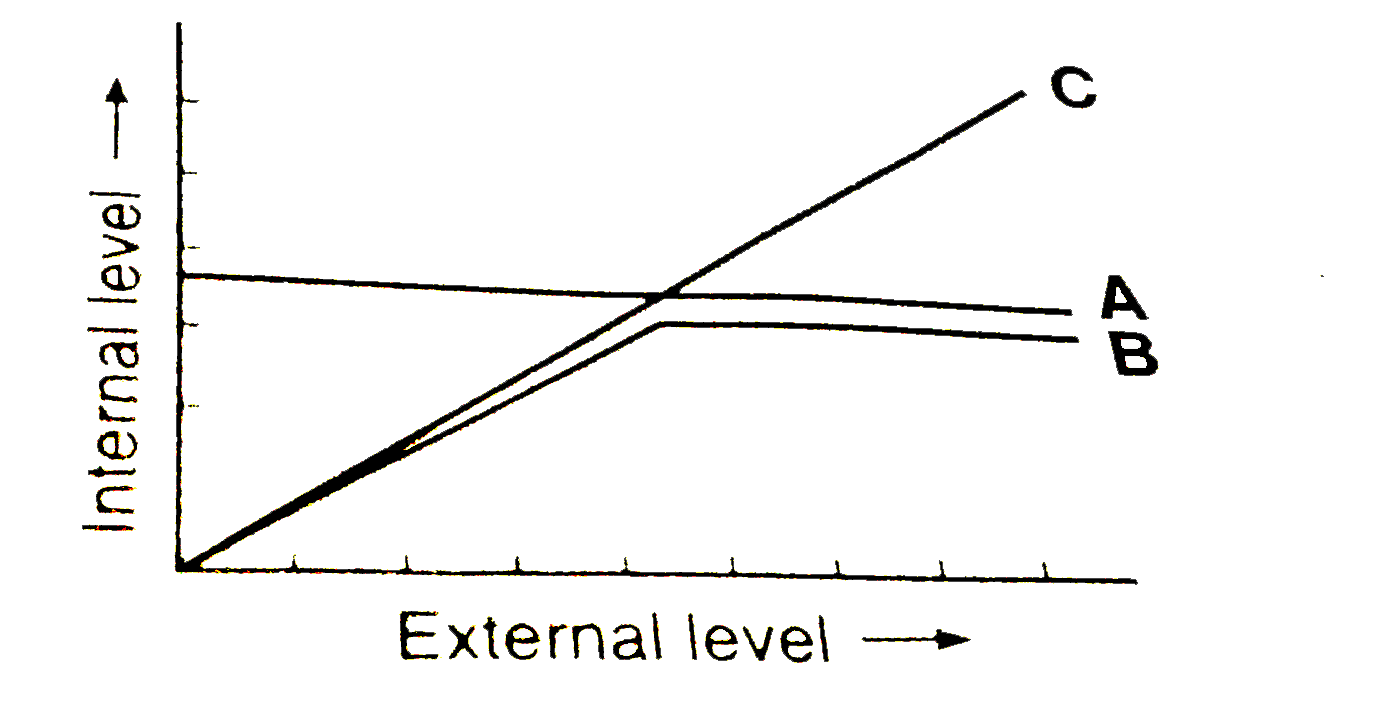
The graph given below is showing biome distribution with respect to annual temperature and precipitation. Identify A, B and C, respectively.
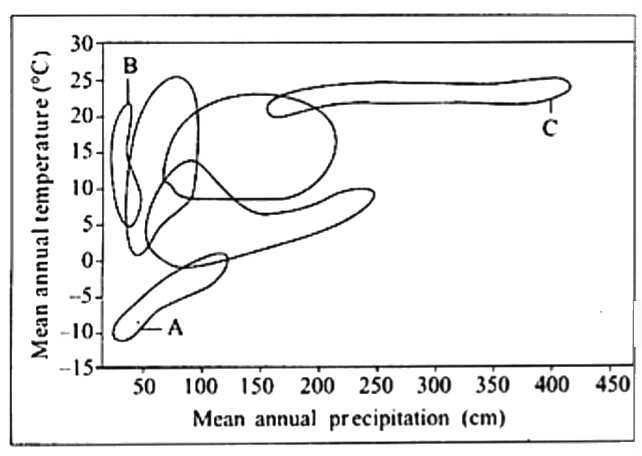
A-Desert, B-Arctic tundra: C-Coniferous forest
A-Arctic tundra, B-Desert, C-Tropical forest
A-Temperate forest, B-arctic tundra, C-Desert
A-Temperate forest, B-Arctic tundra, C-Grassland
Step by step video & image solution for The graph given below is showing biome distribution with respect to annual temperature and precipitation. Identify A, B and C, respectively. by Biology experts to help you in doubts & scoring excellent marks in Class 12 exams.
Updated on:21/07/2023Similar Questions
Knowledge Check
Study the table given below and answer the following questions :

Determine the annual range of temperature in station B.A10∘CB19.5∘CC10.8∘CD8.8∘C
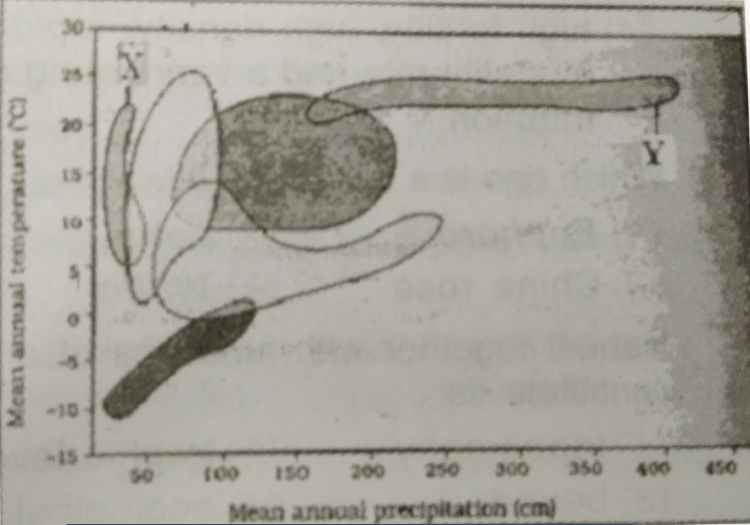
The given figure shows biome distribution with respect to temperature and precipitation. The option which correctly identifies the biomes marked X and Y respectively is.
View SolutionBiome distribution with respect to annual temperature and precipitation is given below. Identify grassland and coniferous forest by selecting the CORRECT option .
View SolutionComplete the followingg reactions:
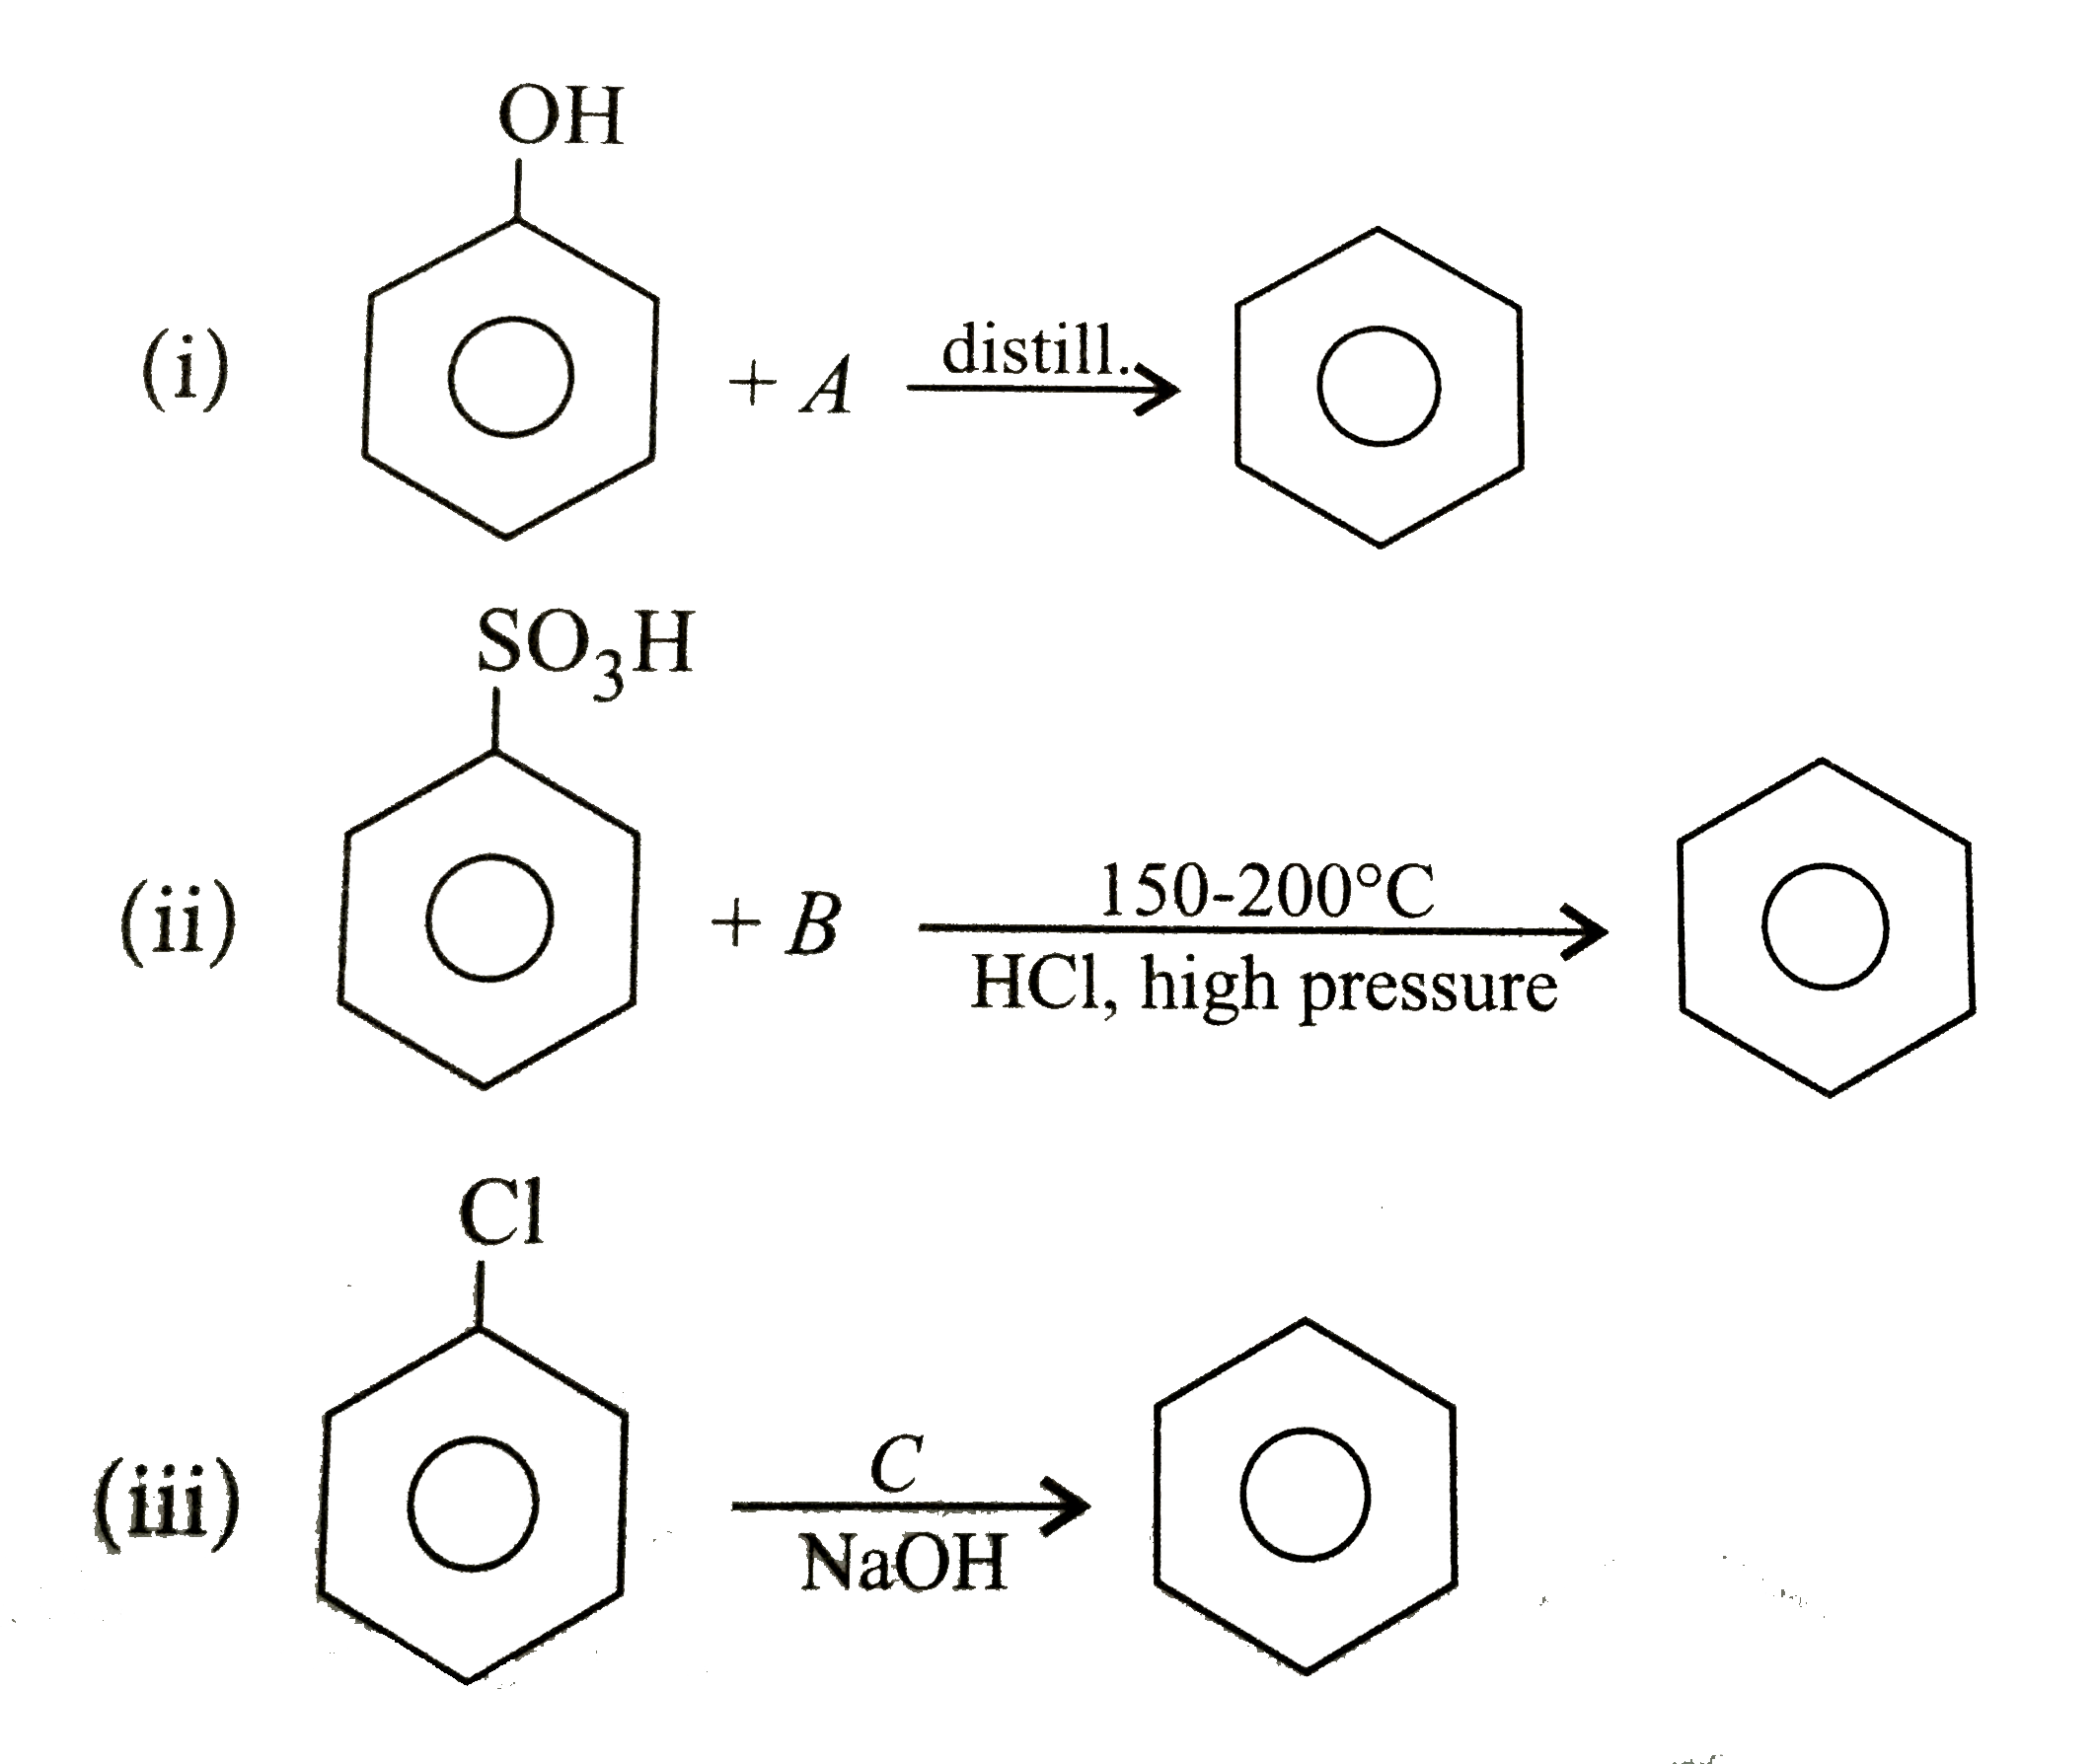
and identify A, B, C respectively.
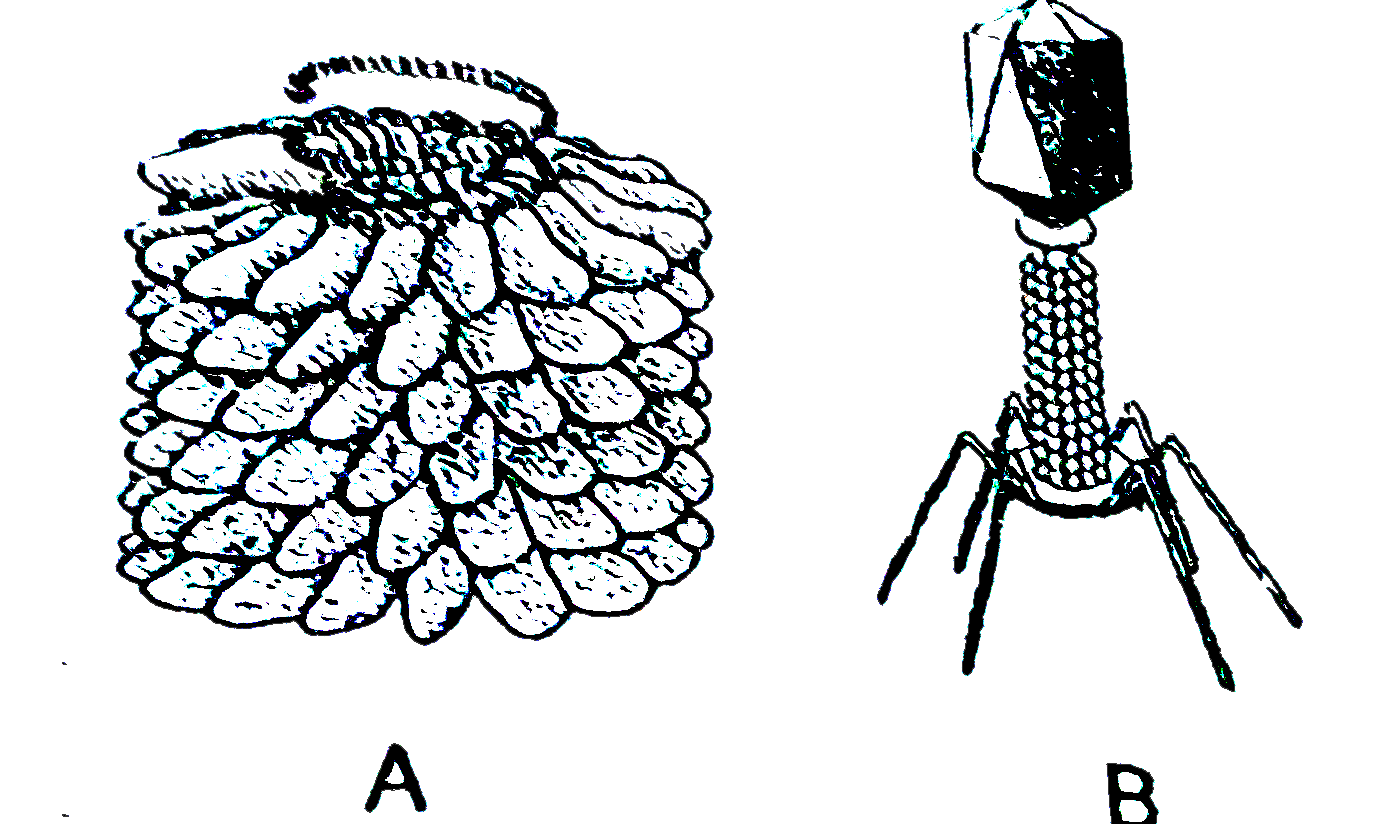
View SolutionIdentify A and B given below.
View SolutionCertain attributes of innate immunity are given in the table below. Identify A,B,C,D,E and F respectively in it.

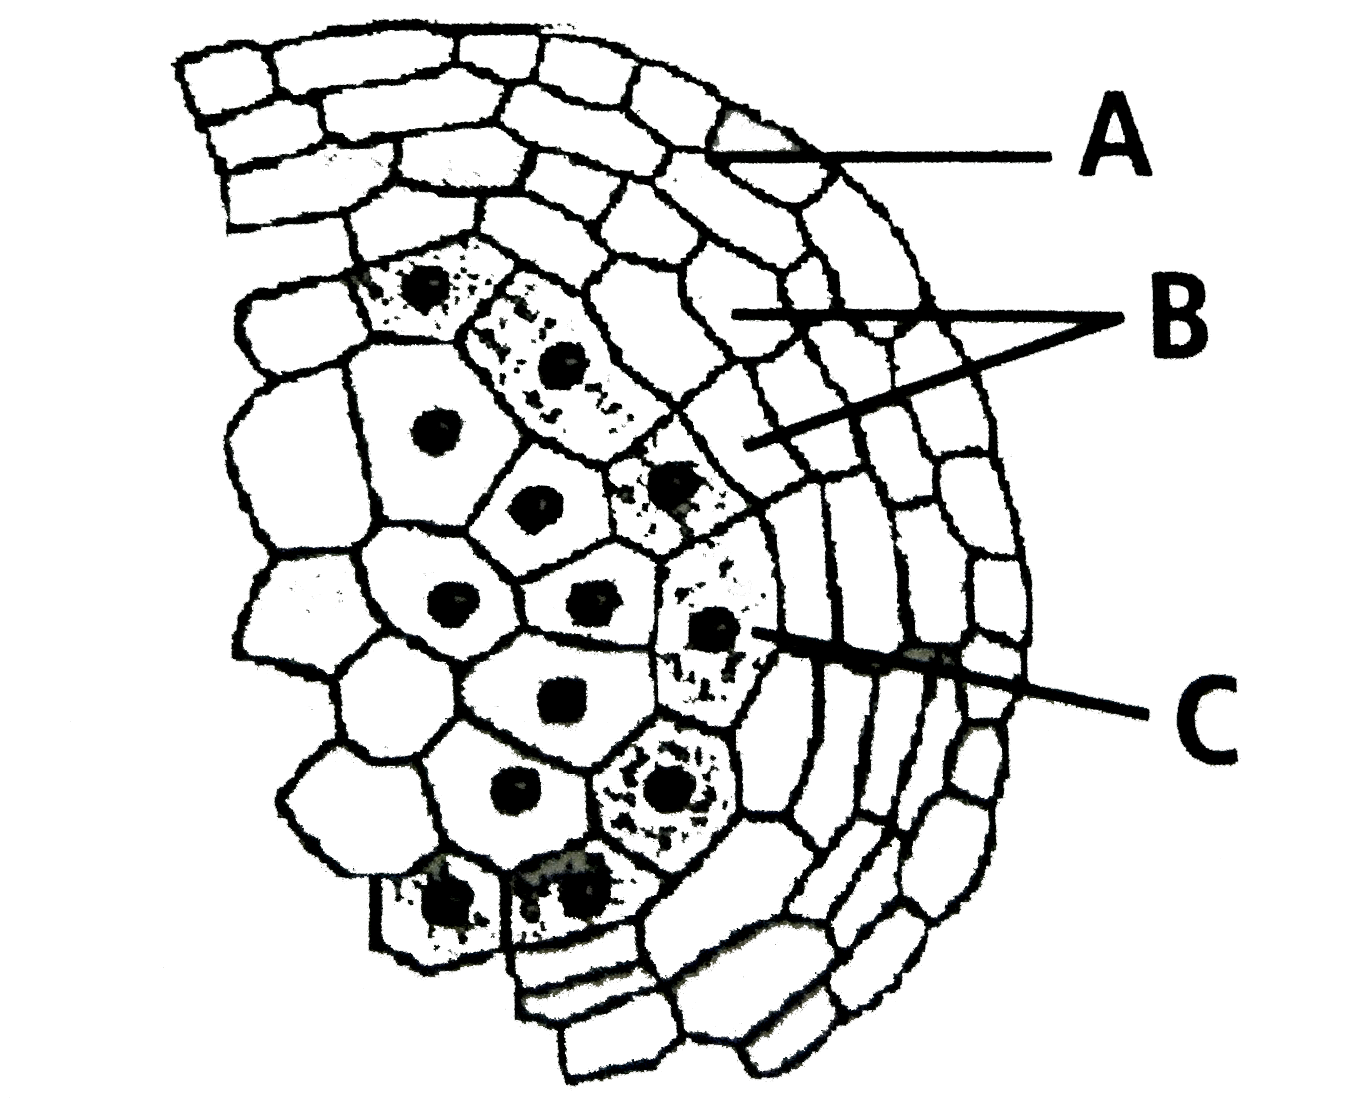
View SolutionThe given diagram shows microsporangium of a mature anther. Identify A,B and C.
View SolutionThe figure given below is a diagrammatic representation of response of organisms to abiotic factors. What do A, B and C represent respectively?
View Solution

