A plot of volume (V) versus temperature (T) for a gas at constant pressure is a straight line passing through the origin.
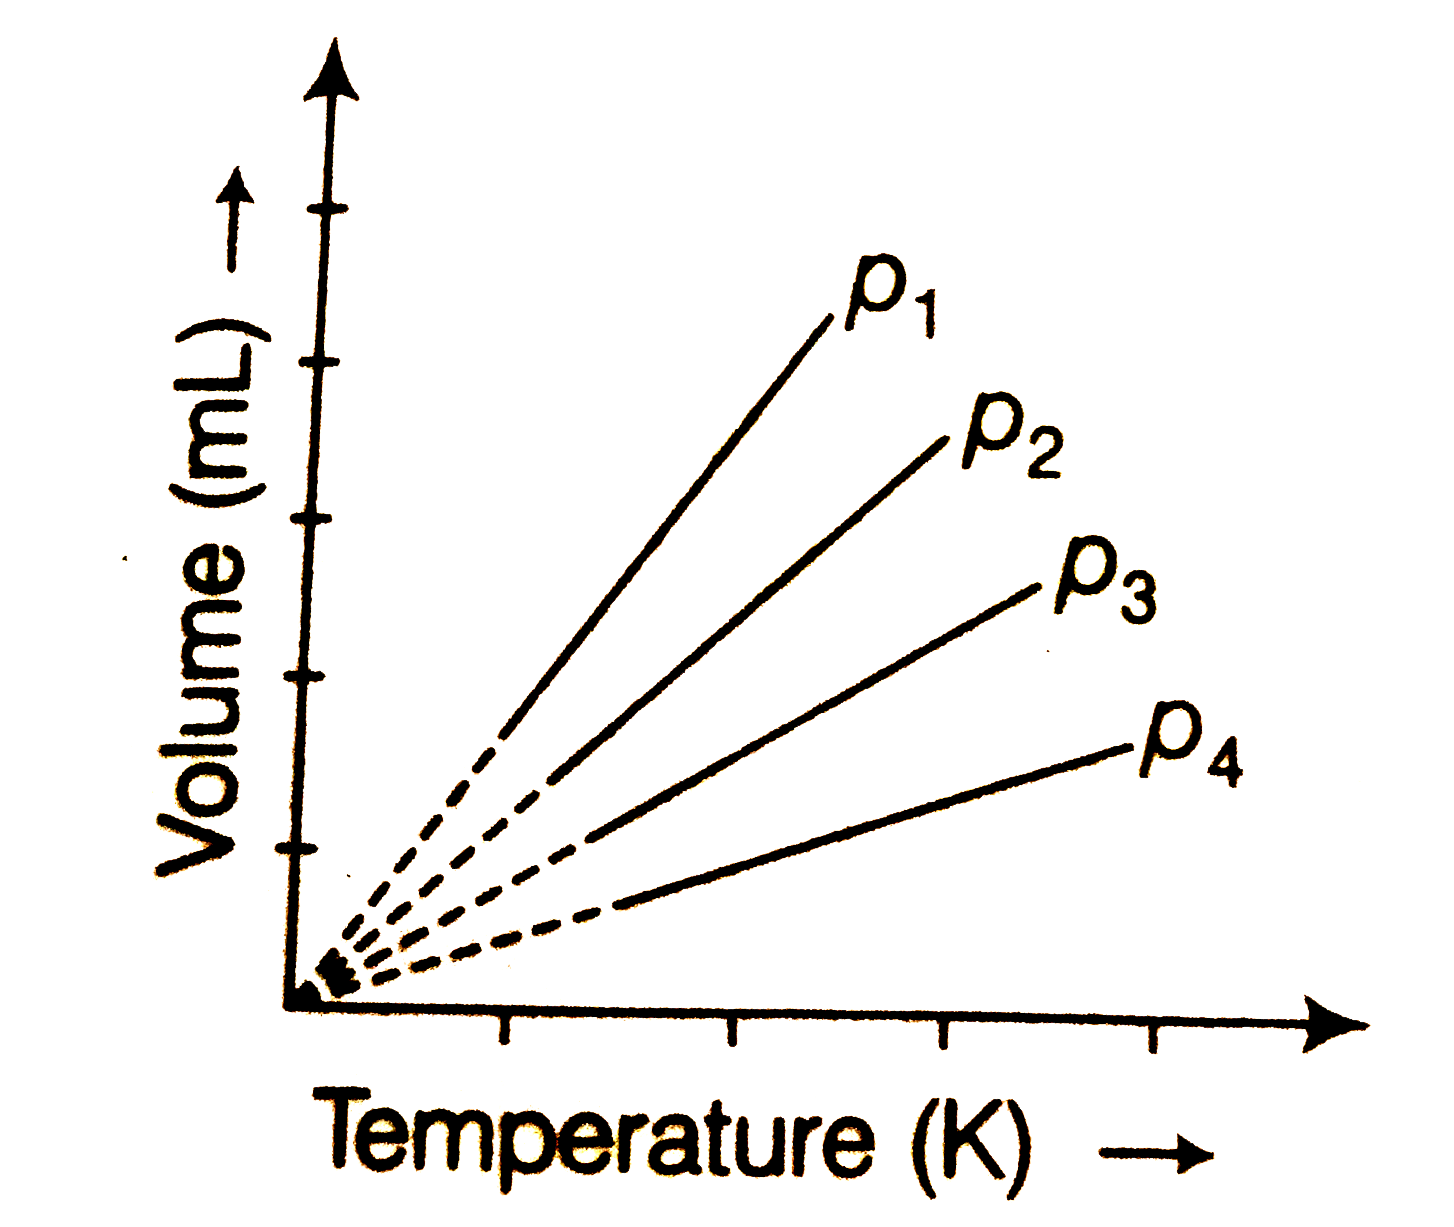
The plots at different values of pressure are shown in figure. Which of the following order of pressure is correct foir this gas?
p1>p2>p3>p4
p1=p2=p3=p4
p1<p2<p3<p4
p1<p2=p3<p4
The correct Answer is:C
At a particular temperature
pV=constant
p∝1V
Thus, p1V1=p2V2=p3V3=p4V4
As V1>V2>V3>V4
Therefore, p1<p2<p3<p4
Topper's Solved these Questions
- BOOK - MHTCET PREVIOUS YEAR PAPERS AND PRACTICE PAPERSCHAPTER - STATES OF MATTEREXERCISE - Exercise 2 (Miscellaneous Problems)30videos
STATES OF MATTER
- BOOK - MHTCET PREVIOUS YEAR PAPERS AND PRACTICE PAPERSCHAPTER - SOME BASIC CONCEPTS OF CHEMISTRYEXERCISE - EXERCISE 230videos
SOME BASIC CONCEPTS OF CHEMISTRY
- BOOK - MHTCET PREVIOUS YEAR PAPERS AND PRACTICE PAPERSCHAPTER - SURFACE CHEMISTRYEXERCISE - EXERCISE 222videos
SURFACE CHEMISTRY
Similar Questions
Knowledge Check
- Question 1 - Select One
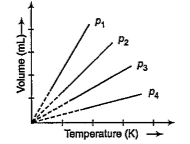
A plot of volume (V)versus temperature (T) for agas at constant pressure is a straight line passing through the origin the plots at different values of pressure are show in the figure which of the following order of pressure is correct for this gas?
 Ap1>p2>p3>p4Bp1=p2=p3=p4Cp1<p2<P3<p4Dp1<p2=p=3<p4
 - Question 2 - Select One
For 1 mole of an ideal gas, a graph of pressure vs volume is plotted as shown. Which of the following option is correct ?
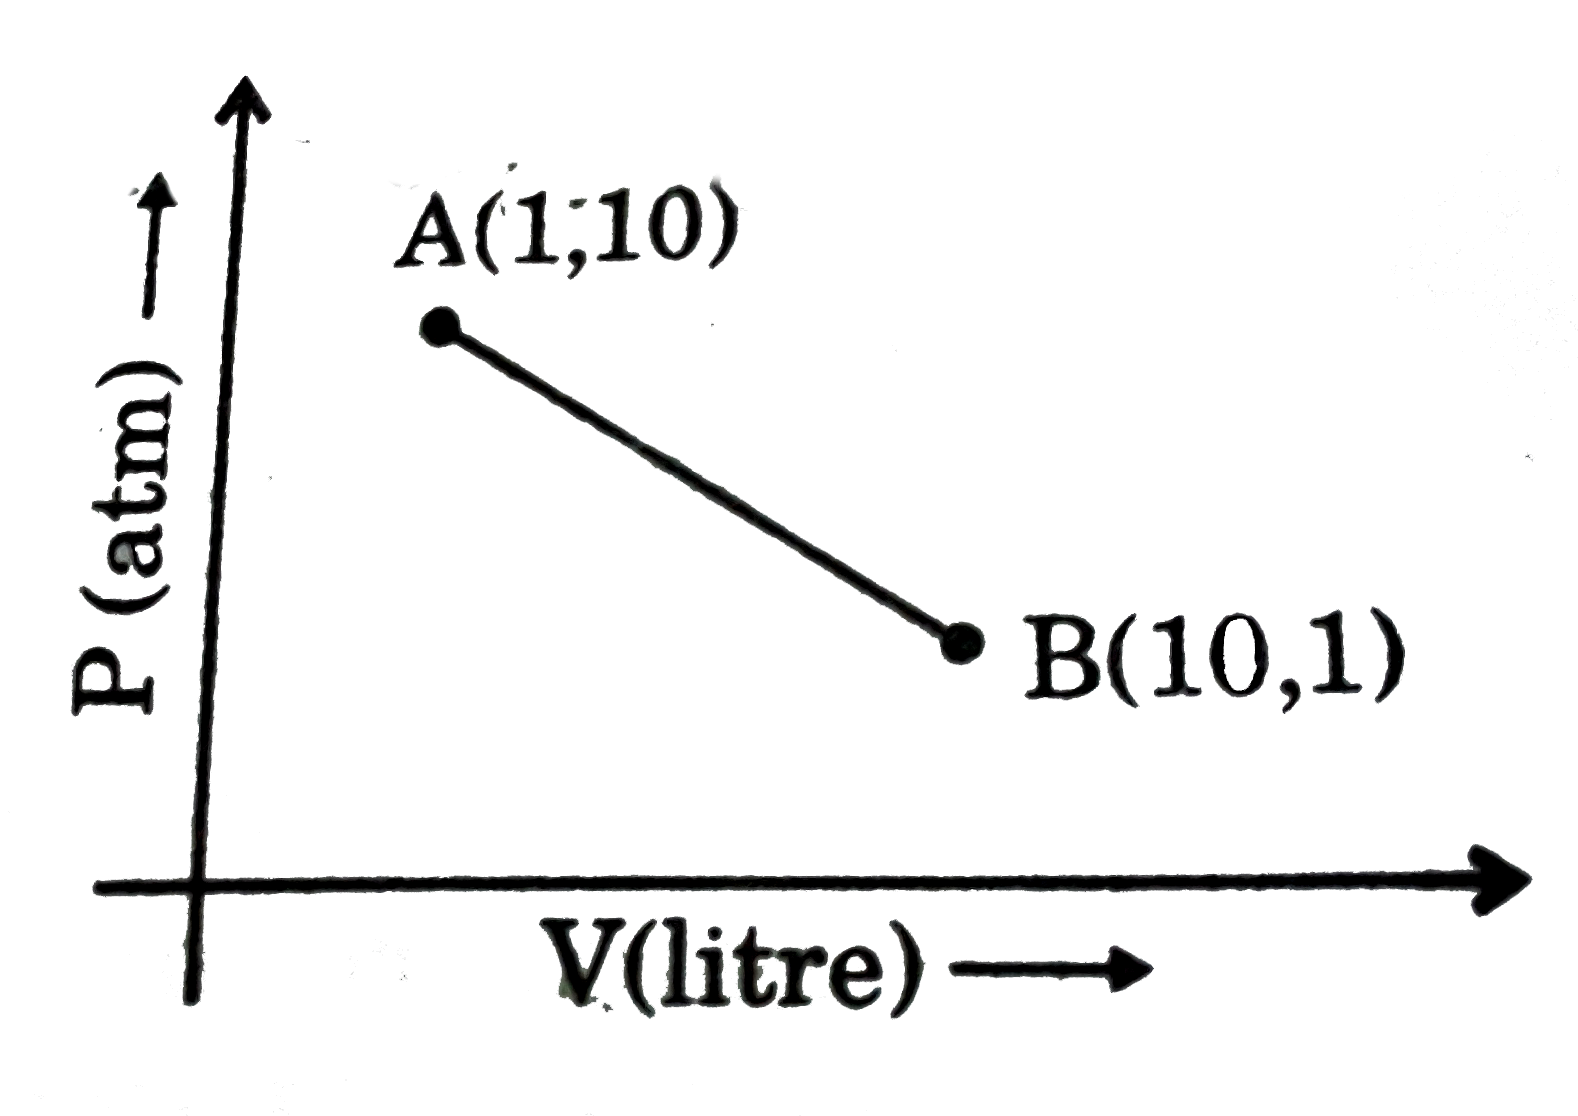 AAB process is isothermal.BMaximum temperature of the gas can be 100.0821K.CMinimum temperature of the gas can be 114×0.0821K.DNone of the above
 - Question 3 - Select One
For 1 mole of an ideal gas, a graph of pressure vs volume is plotted as shown. Which of the following options is correct ?
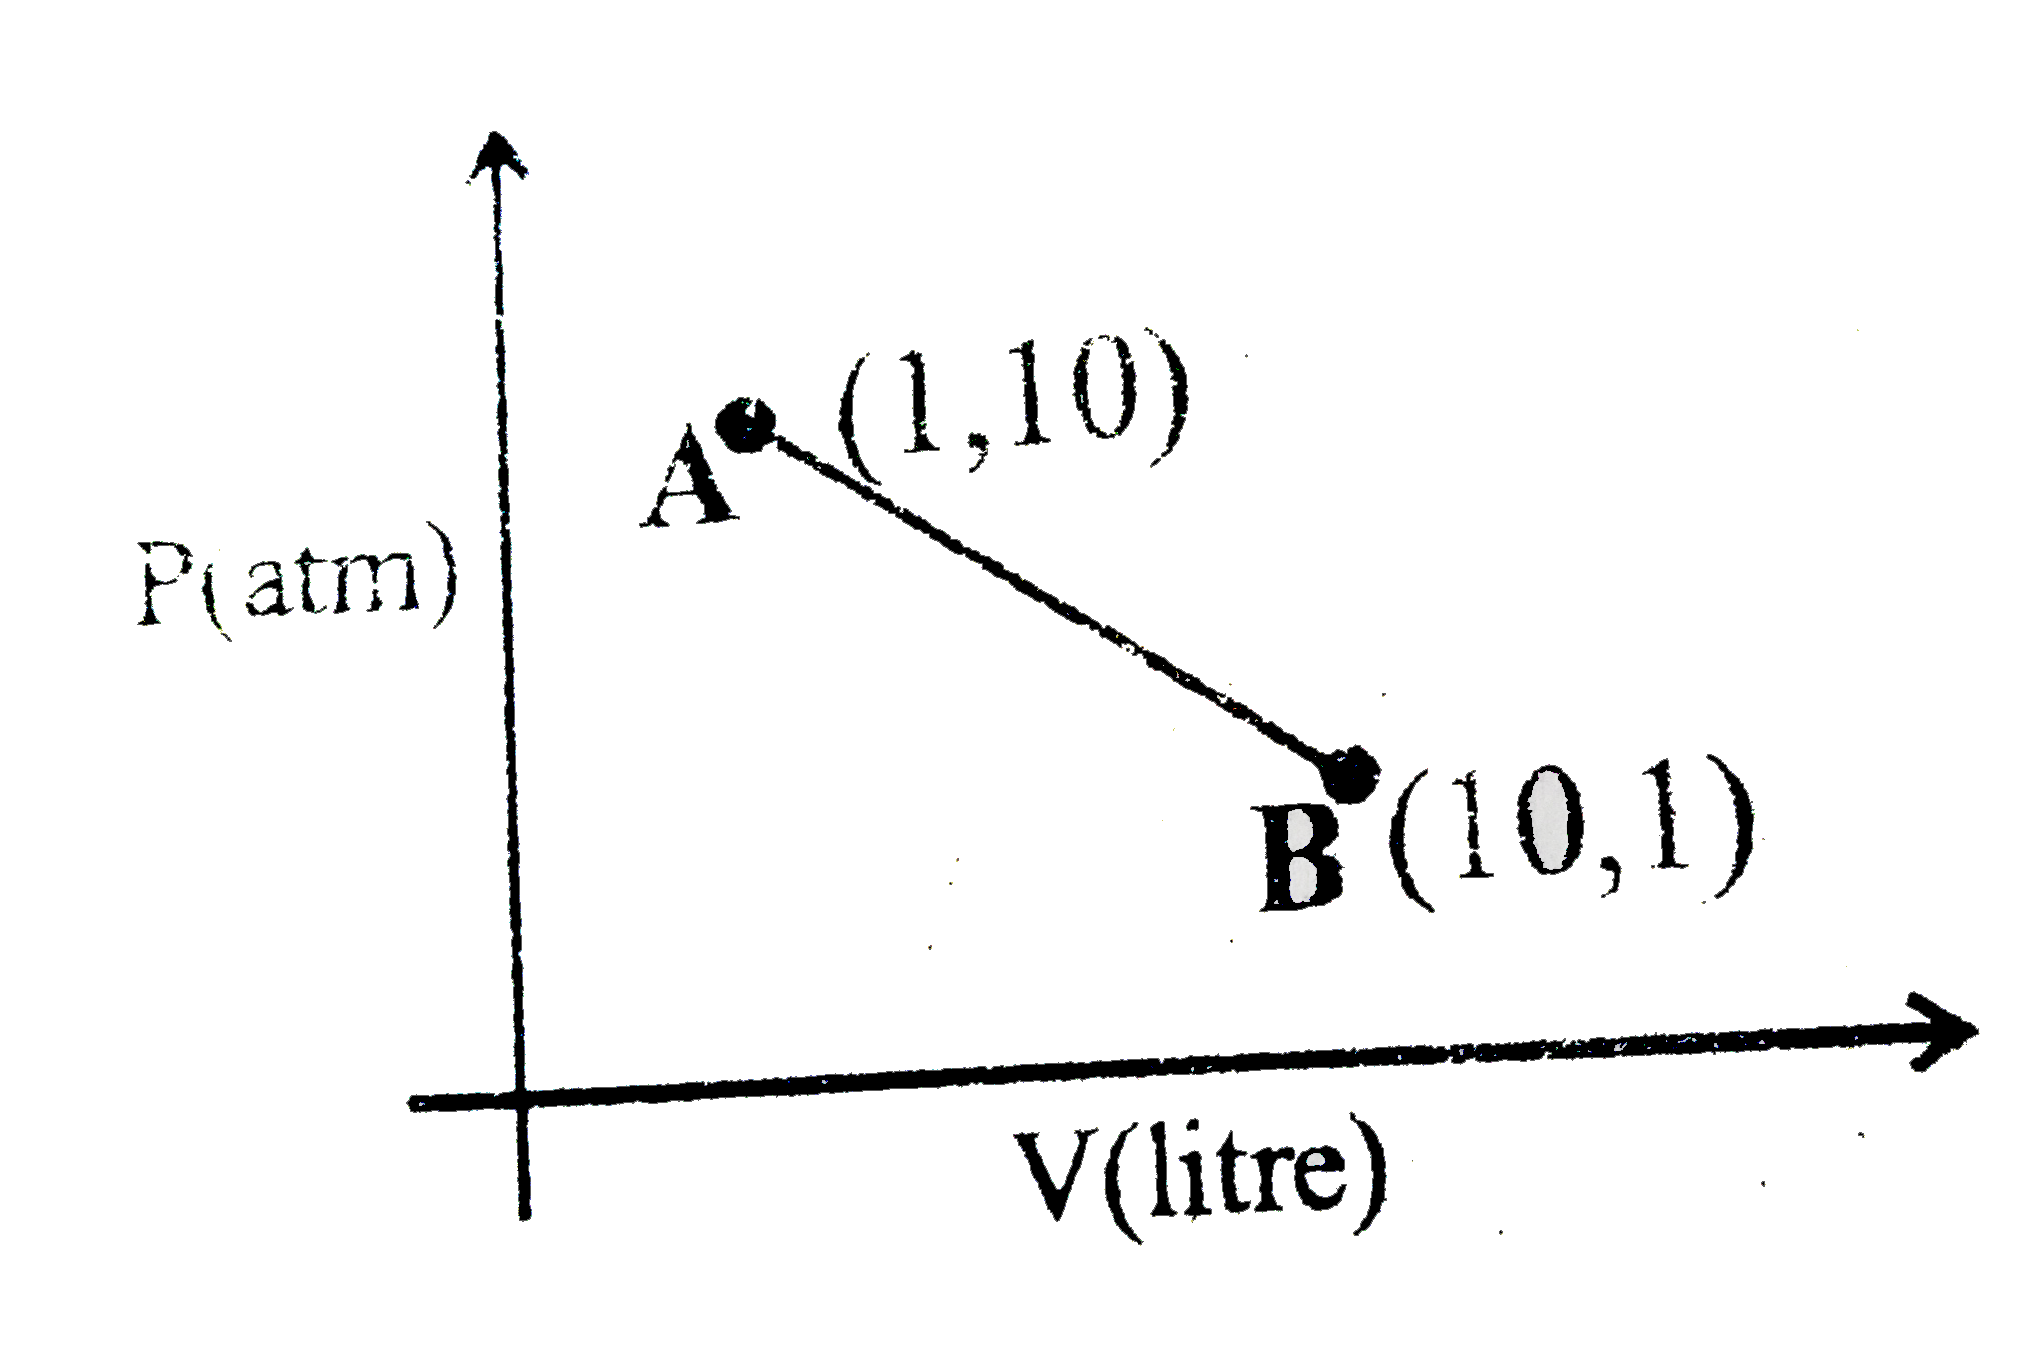 AAB process is isothermalBMaximum temperature of the gas can be 100.0821KCMinimum temperature of the gas can be 114×0.0821KDNone of these
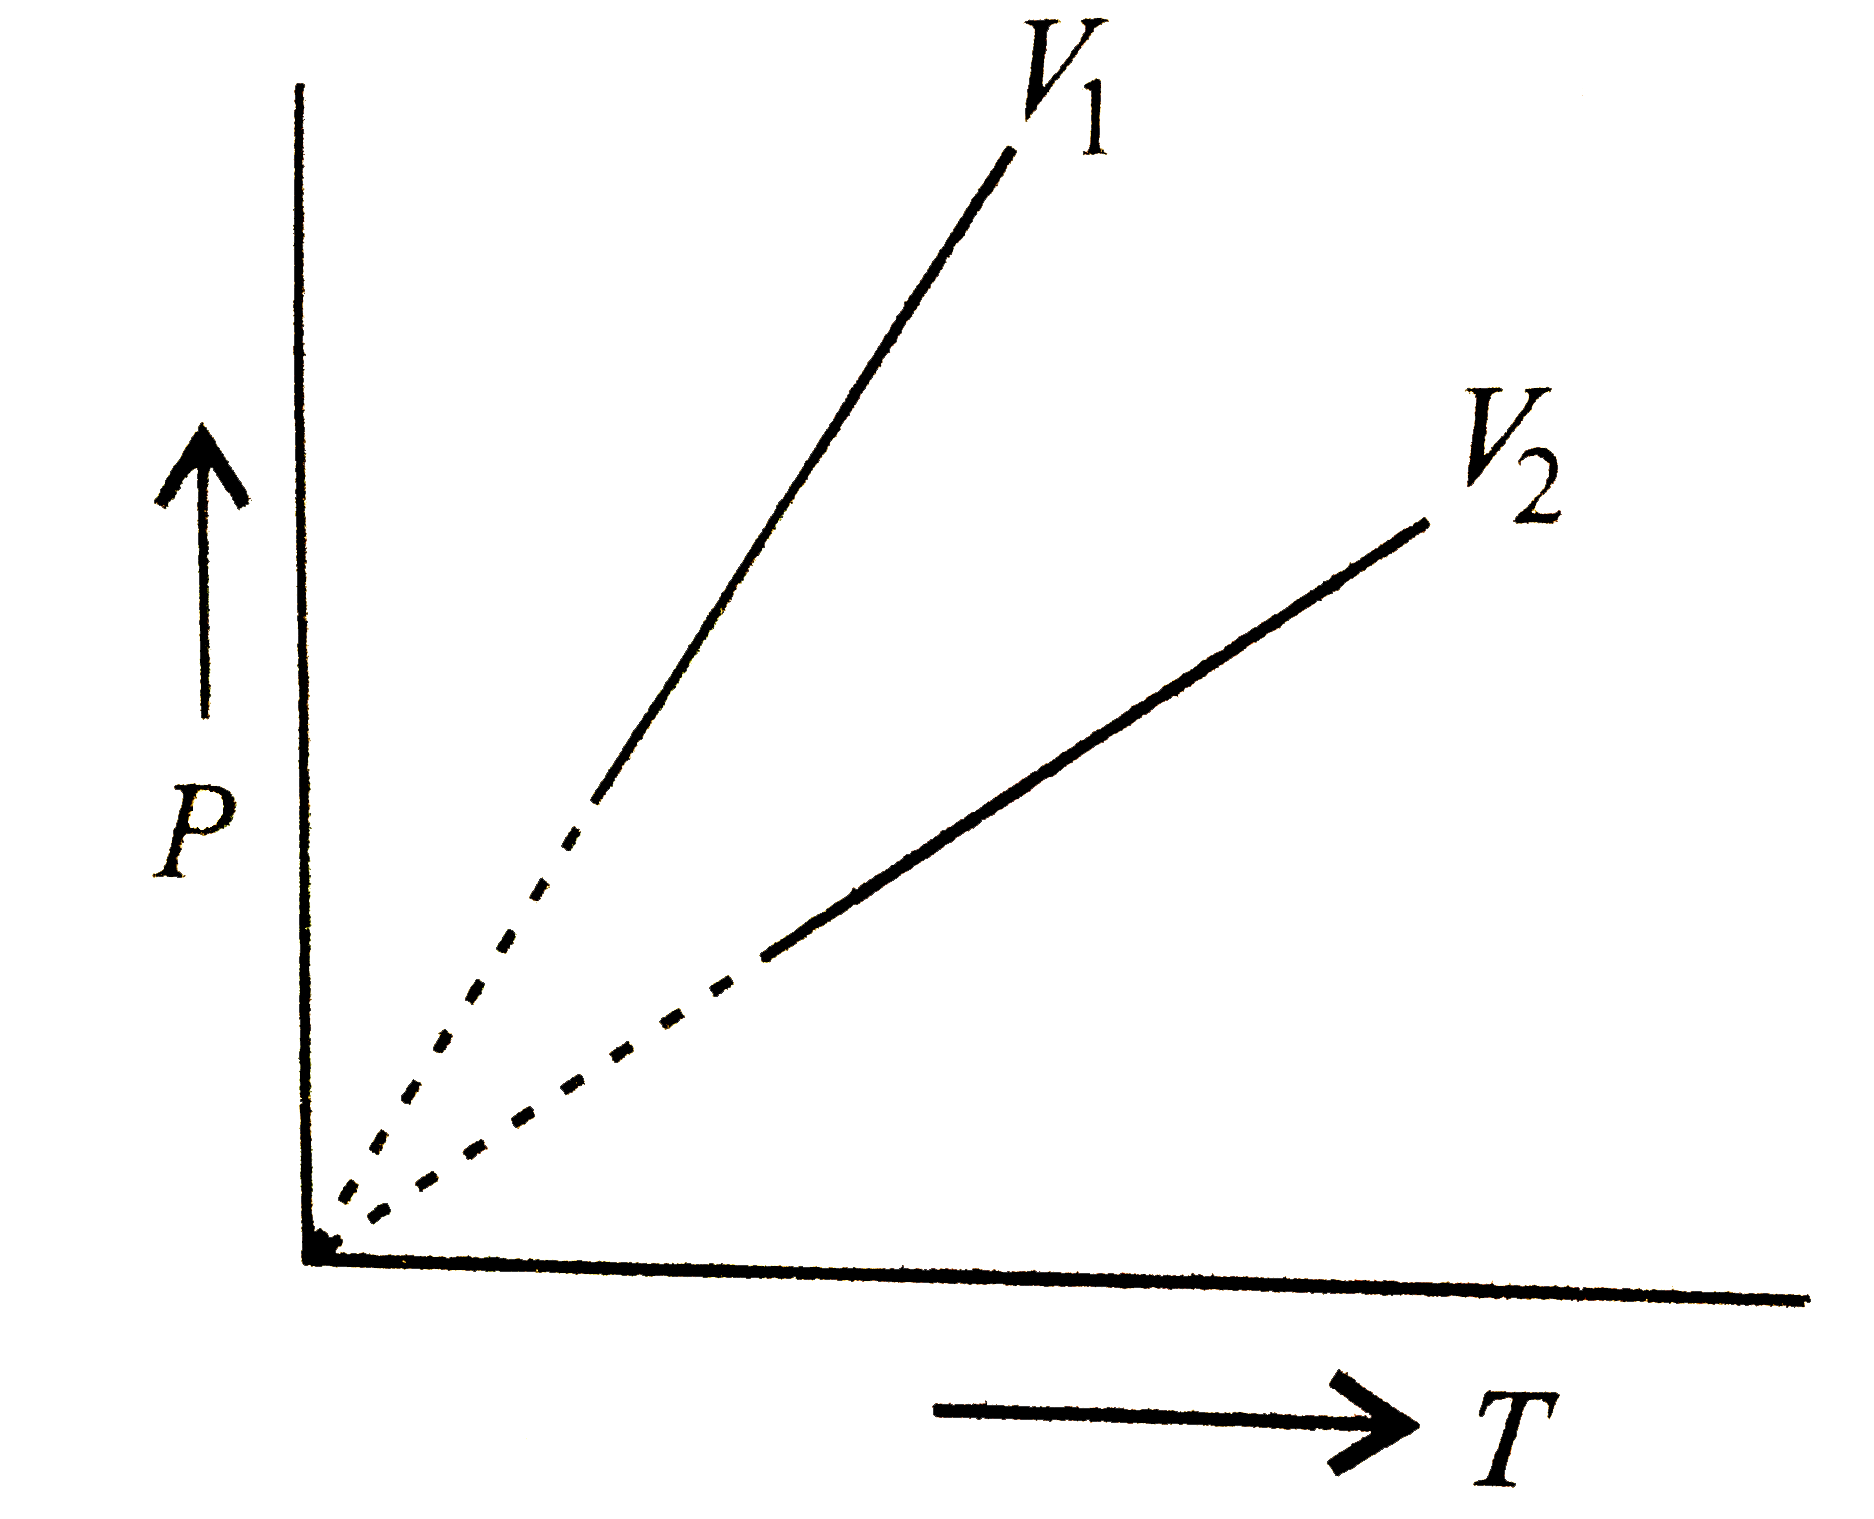
A plot of P vs T for a given mass of gas at constant volume is a straight line . P vs T at constant volumes V1 and V2 for an ideal gas are shown below :
Which of the following is correct ?
 View Solution
A plot of P vs T for a given mass of gas at constant volume is a straight line . P vs T at constant volumes V1 and V2 for an ideal gas are shown below :
Which of the following is correct ?
 View Solution
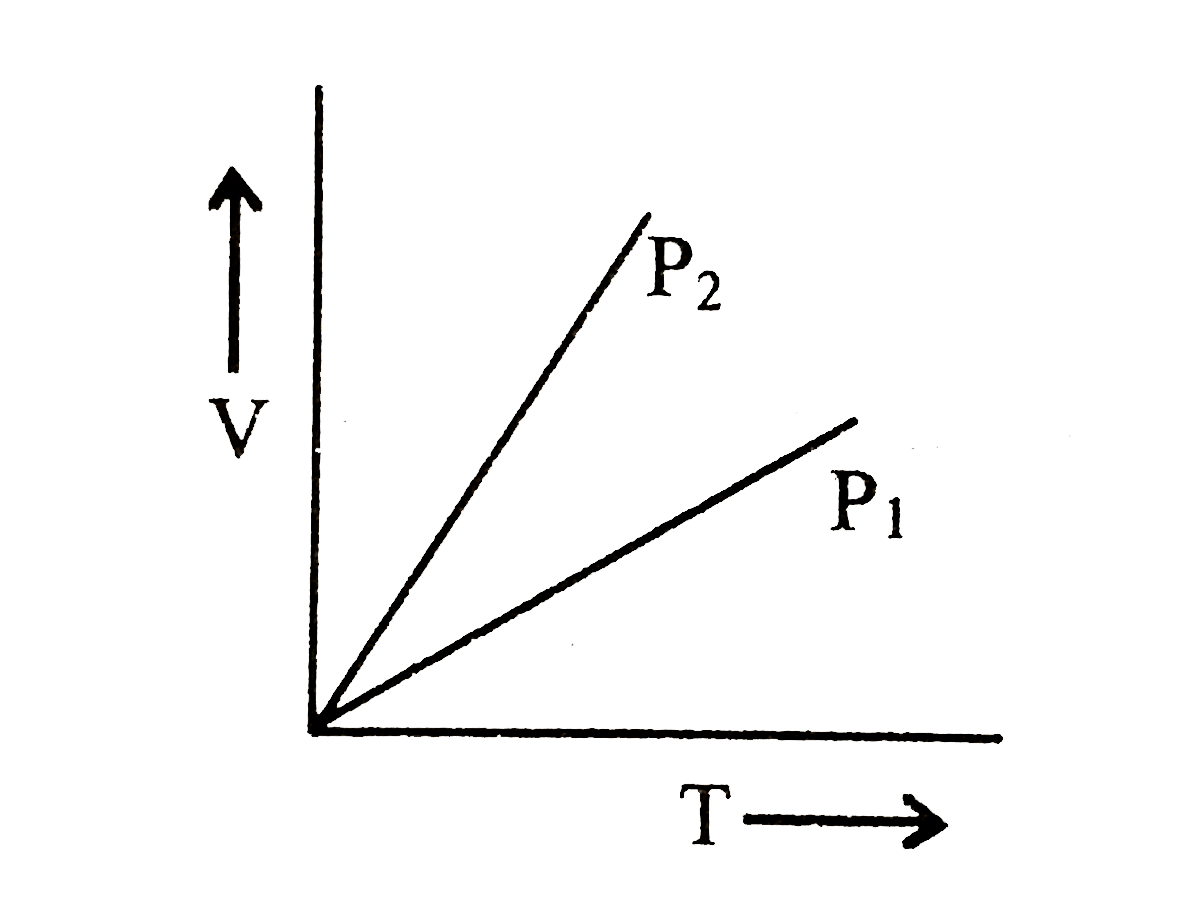
For V versus T curves at constant pressure P1andP2 for and ideal gas shown in figure-
 View Solution
For V versus T curves at constant pressure P1andP2 for and ideal gas shown in figure-
 View Solution
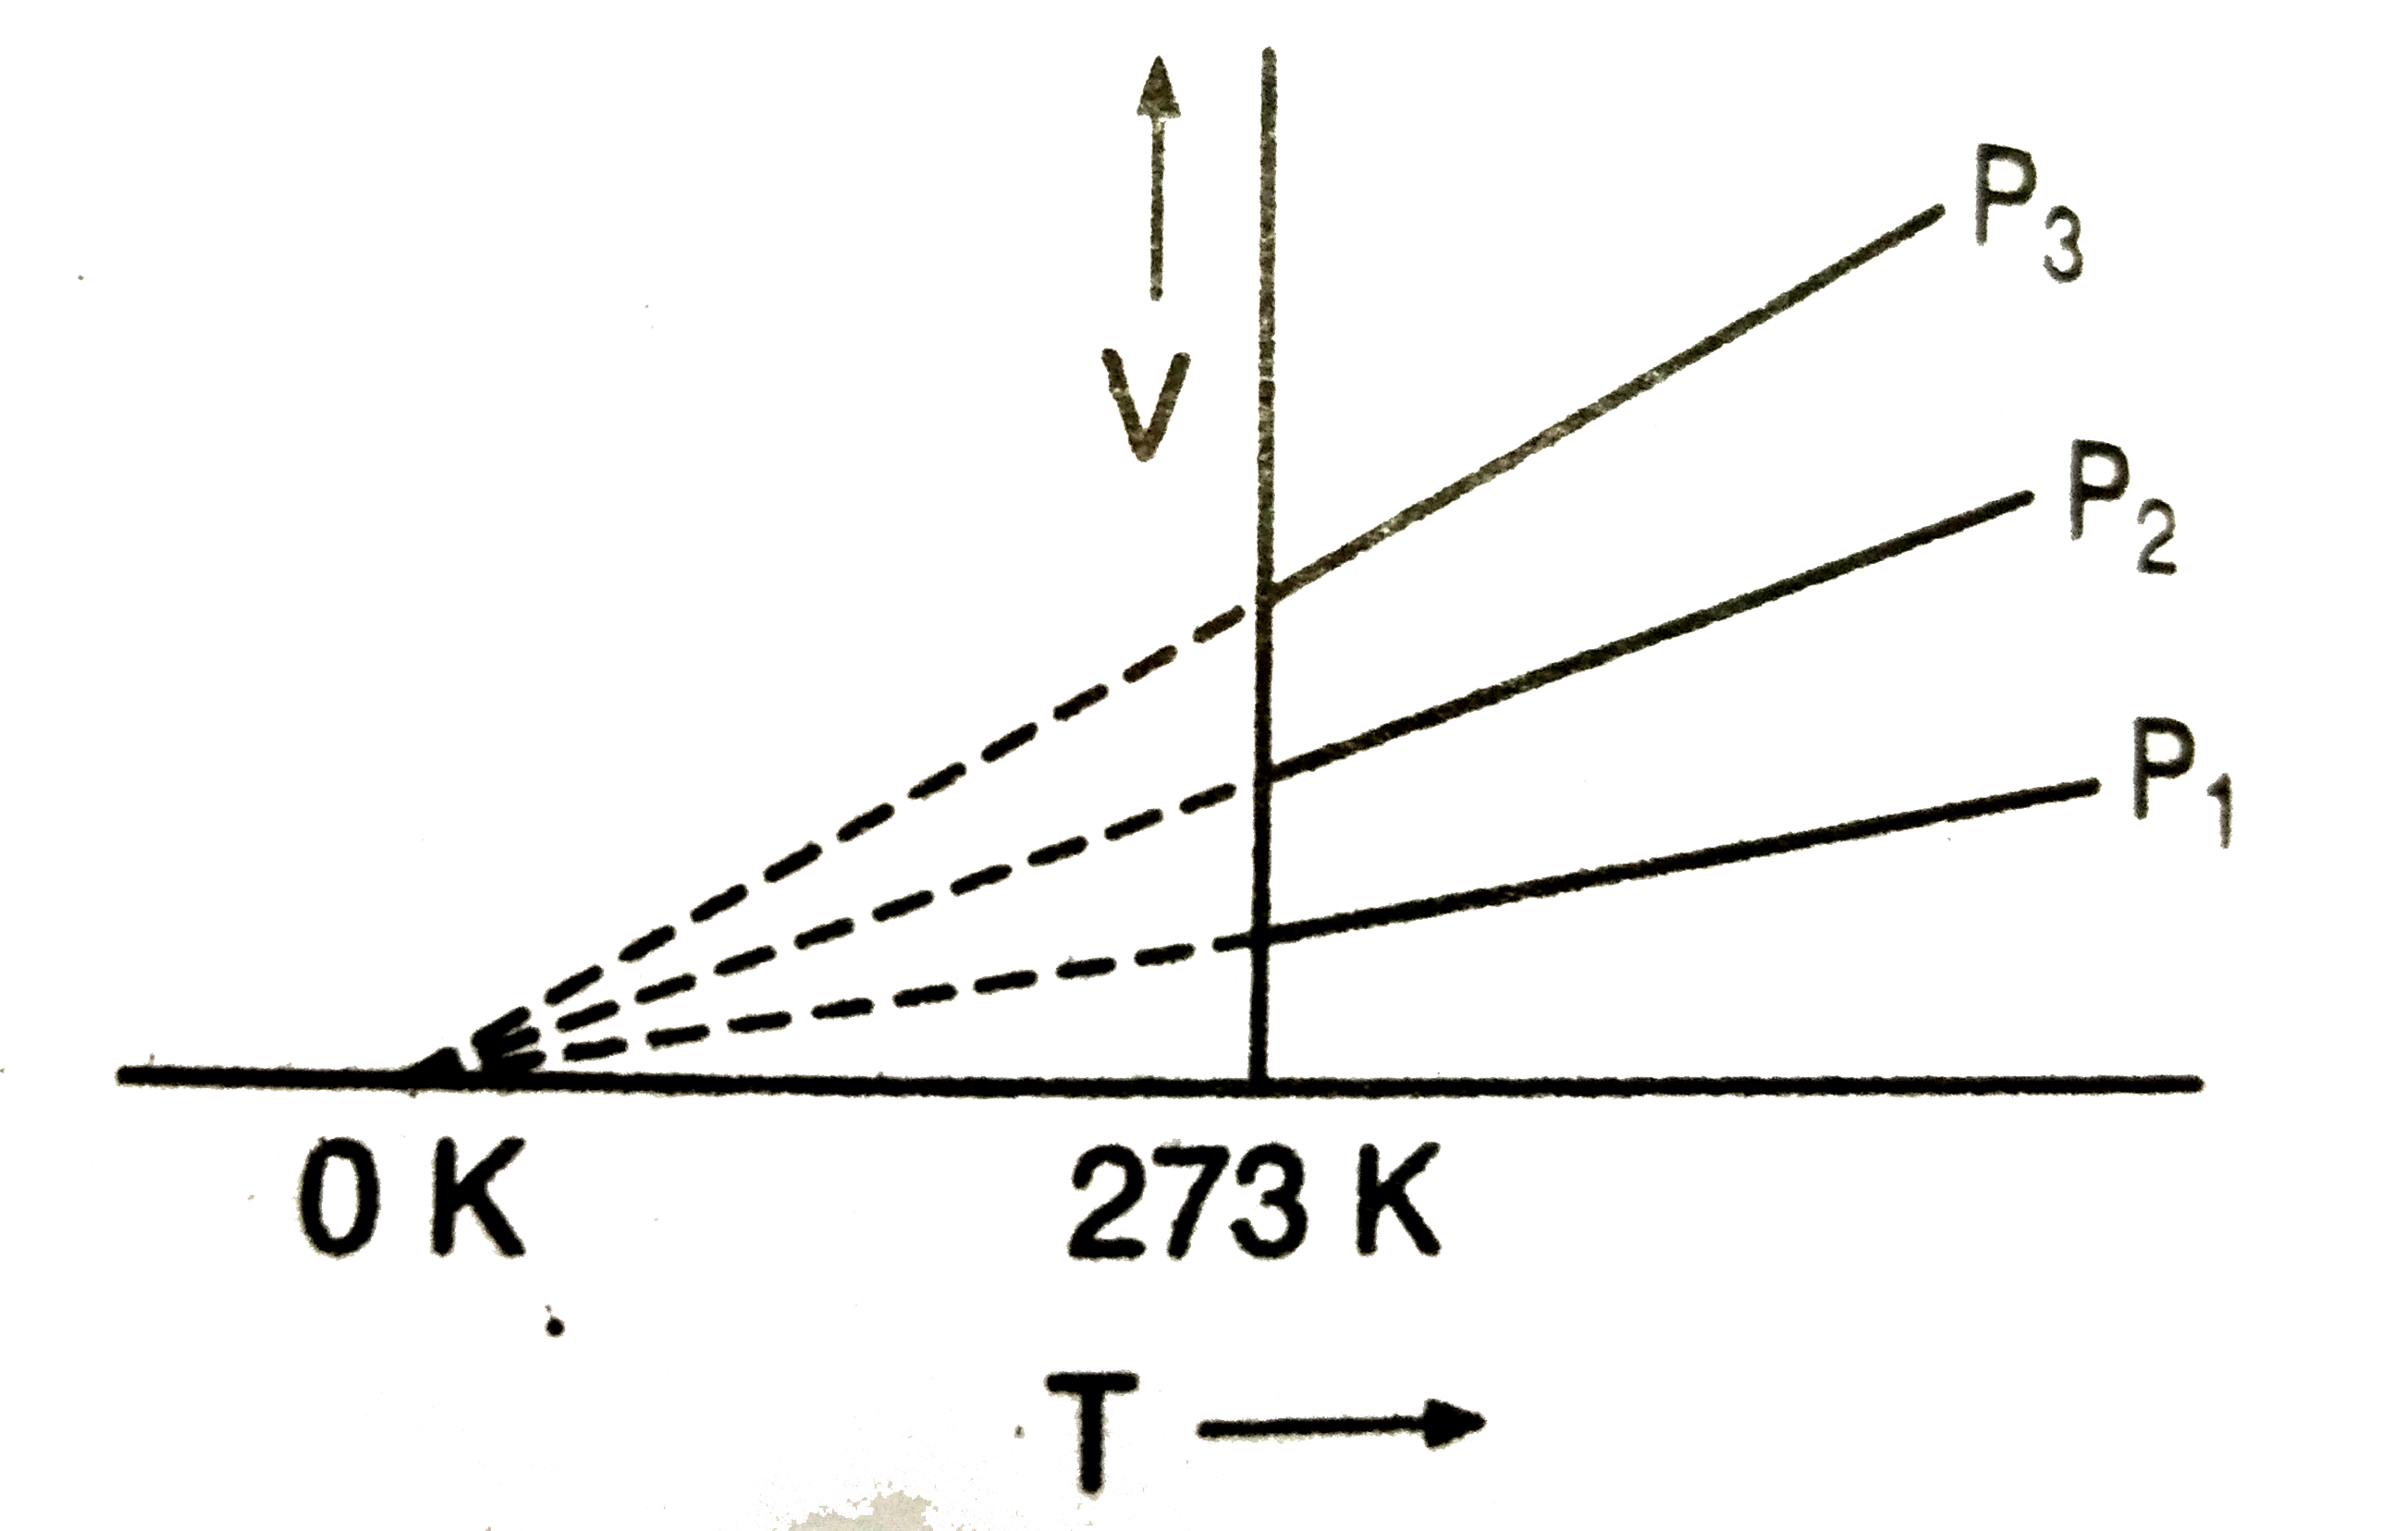
The volume-temperature graphs of a given mass of an ideal gas at constant pressure are shown below. What is the correct order of pressure ?
 View Solution

