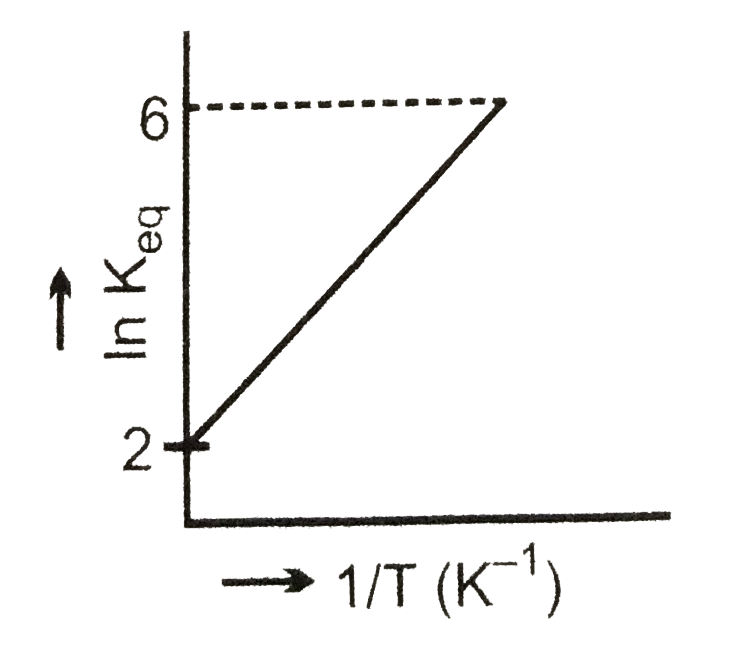
A schematic plot of In Keq versus inverse of temperature for a reaction is shown below

the reaction must be: Solution in Telugu
Exothermic
Endothermic
One with negligible enthalpy change
Highly spontanceous at ordinary temperature
The correct Answer is:a
Step by step video & image solution for A schematic plot of In K_(eq) versus inverse of temperature for a reaction is shown below the reaction must be: by Chemistry experts to help you in doubts & scoring excellent marks in Class 11 exams.
Updated on:21/07/2023Topper's Solved these Questions
- CHEMICAL EQUILIBRIUMBOOK - NARENDRA AWASTHICHAPTER - CHEMICAL EQUILIBRIUMEXERCISE - Level 1 (Q.93 To Q.122)
1 Videos
- CHEMICAL EQUILIBRIUMBOOK - NARENDRA AWASTHICHAPTER - CHEMICAL EQUILIBRIUMEXERCISE - Level 2
1 Videos
- ATOMIC STUCTUREBOOK - NARENDRA AWASTHICHAPTER - ATOMIC STUCTUREEXERCISE - level 2
1 Videos
- DILUTE SOLUTIONBOOK - NARENDRA AWASTHICHAPTER - DILUTE SOLUTIONEXERCISE - Level 3 - Match The Column
1 Videos
Similar Questions
An equilibrium mixture at 700 K of 0.05M N2(g)and0.2MNH3(g) is present in a container .Now if this equilibrium is disturbed by adding N∘ (g) so that its concentration becomes 0.15M just after addition then which of the following graph represents the above situation more appropriately:
View SolutionCalculate ΔrG for the reaction at 27∘C
H2(g)+2Ag+(aq)⇔2Ag(s)+2H+(aq)
Given : PH2=0.5 bar, [Ag+]=10−5M,
[H+]=10−3M,ΔrG∘[Ag+(aq)]=77.1kJ/mol
View SolutionA small particle of mass m moves in such a way that the potential energy U = ar2 where a is a constant and r is the distance of the particle from the origin. Assuming Bohr's model of quantization of angular momentum and circular orbits, find the radius of nth allowed orbit.
View SolutionColumn -I and Column -II contain four entries each. Entries of column-I are to be matched with some entries of column-II. One or more than one entries of column-I may have the matching with the same entries of column-II.

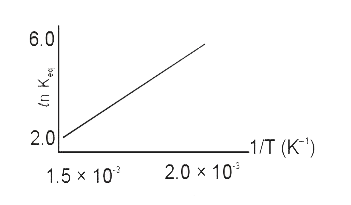
View SolutionA schematic plot of log K_(eq) vs inverse of temperature for a reaction is shown in the figure. The reaction must be:
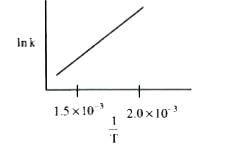
View SolutionThe graph relates. In K_(eq.) vs.(1)/(T) for a reaction. The reaction must be:
View SolutionA schematic plot of In Keq versus inverse o ftemperature for a reaction is shown below

the reaction must be:
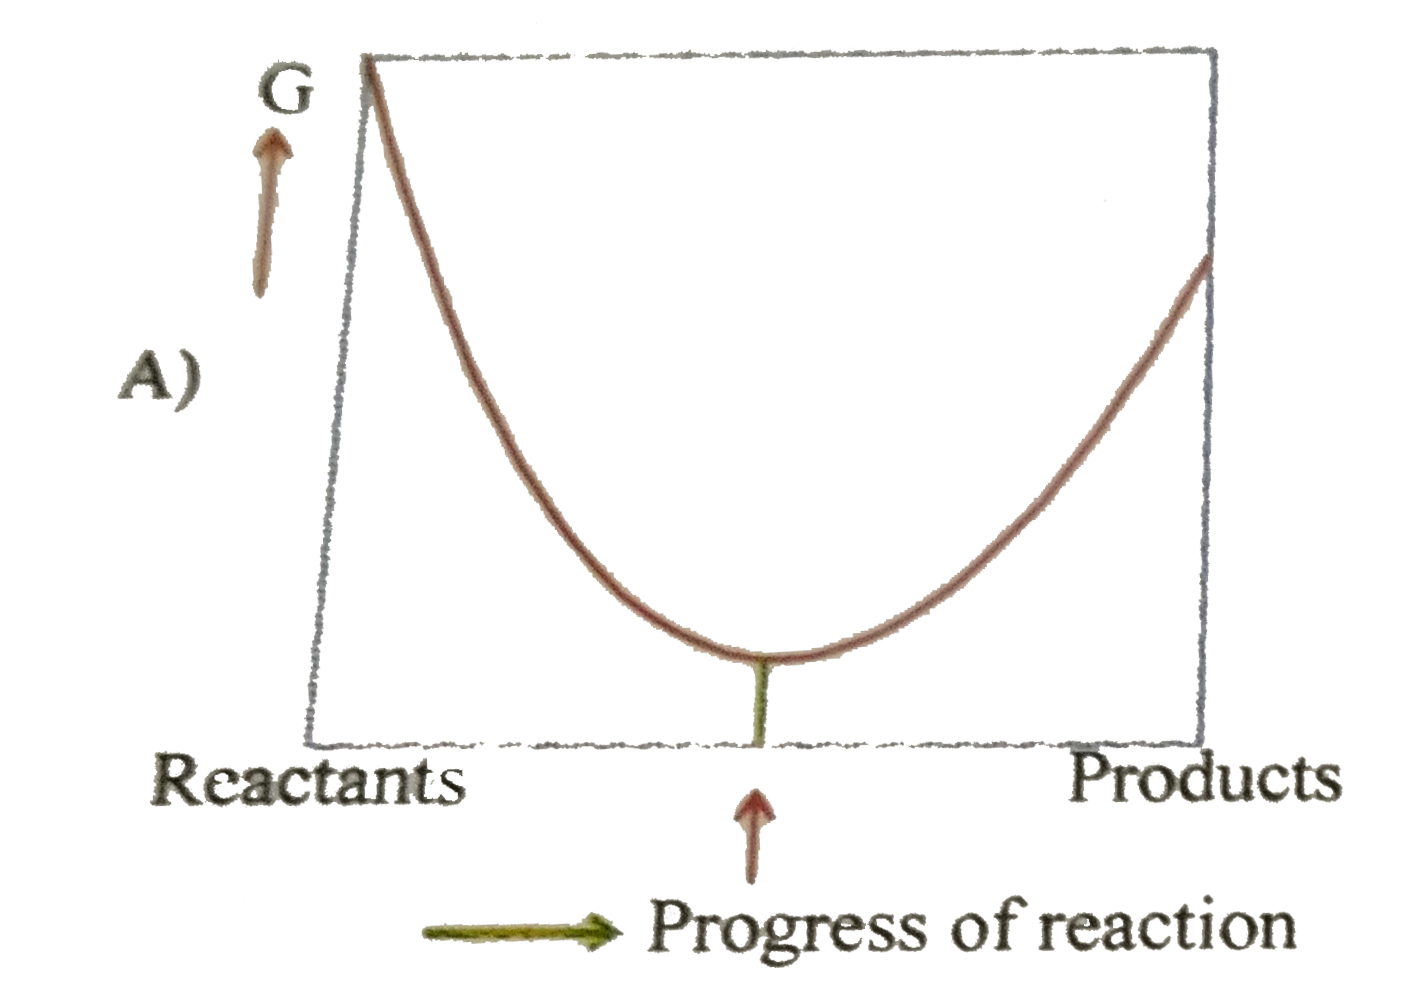
View SolutionFor a reversible reaction at constant temperature and at constant pressure the equilibrium composition of reaction mixture corresponds to the lowest point on Gibbls energy Vs progress of reaction diagrams as shown. At equilibrium Gibbs energy of reaction is equal to zero.

The value of log10Keq is equal to [keq is the equilibrium coustant]
View SolutionThe enthalpy (H) of an elementary exothermic reaction A iff B is schematically plotted against the reaction coordinate. The plots in the presence and absence of a catalyst are shown in dashed and solid lines, respectively. Identify the correct plot for the reaction.
View SolutionFor a reversible exothermic reaction , which is the effect of increasing temperature on the equilibrium constant (keq) and on the forward rate constant (kf)?
View SolutionA schematic plot of ln Keq versus inverse of temperature for a reaction is shown below

The reaction must be
View SolutionA schematic plot of ln K_(eq) versus inverse of temperature for a reaction is shown below: The reaction must be:
View SolutionA schematic plot of In k_(eq) versus inverse of temperature for a reaction is shown below : The reaction must be :
View SolutionThe graph relates in Keq.VslT for a reaction. The reaction must be :

View SolutionA schematic plot of In K_(eq) versus inverse o ftemperature for a reaction is shown below the reaction must be:
View SolutionGiven
i)A↔B+CKeq(1)<br>ii)B+C↔PKeq(2)
then Keq for reaction A↔pis
View Solution
