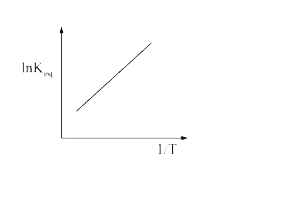
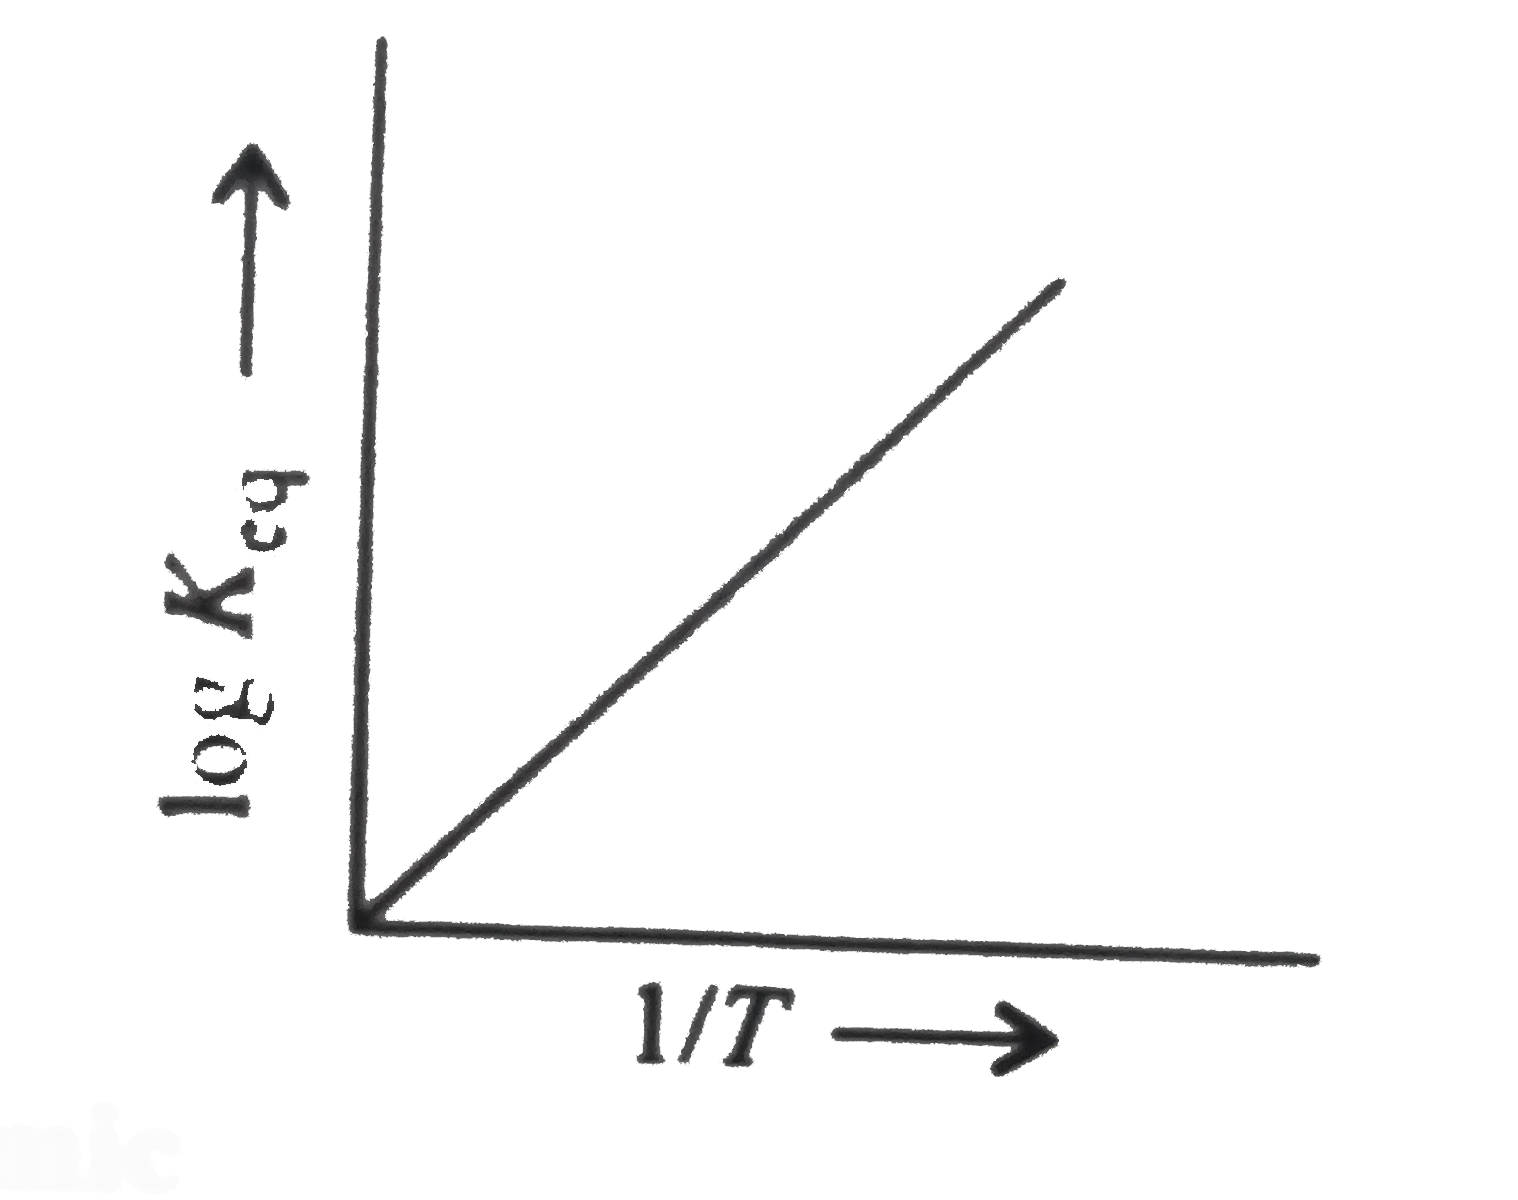
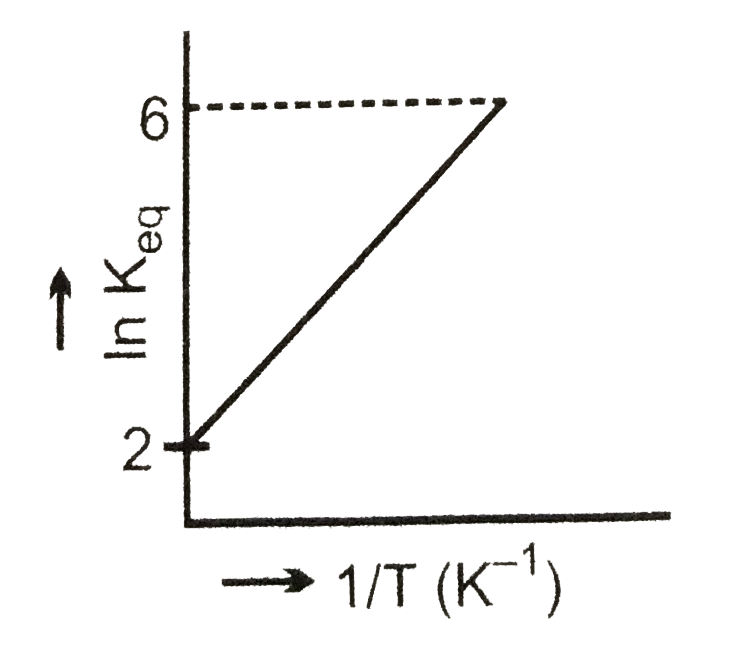
A schematic plot of log Keq vs inverse of temperature for a reaction is shown in the figure. The reaction must be:
A
Exothermic
B
Endothermic
C
One with negligible enthalpy change
D
Highly spontaneous at ordinary temperature
Video Solution
Text Solution
Kc=Ae−ΔHɵ/RT
log10Keq=log10A−ΔHɵ2.303RT
Y=C+MX
Slope of the line will be positive, when ΔHɵ=−ve, i.e. the reaction is xeothermic.
|
Updated on:21/07/2023
Topper's Solved these Questions
- BOOK - CENGAGE CHEMISTRYCHAPTER - CHEMICAL EQUILIBRIUMEXERCISE - Concept Applicationexercise 7.153videos
CHEMICAL EQUILIBRIUM
- BOOK - CENGAGE CHEMISTRYCHAPTER - CHEMICAL EQUILIBRIUMEXERCISE - Ex 7.240videos
CHEMICAL EQUILIBRIUM
- BOOK - CENGAGE CHEMISTRYCHAPTER - CHEMICAL BONDING AND MOLECULAR STRUCTUREEXERCISE - Archives Subjective15videos
CHEMICAL BONDING AND MOLECULAR STRUCTURE
- BOOK - CENGAGE CHEMISTRYCHAPTER - CLASSIFICATION AND NOMENCLATURE OF ORGANIC COMPOUNDSEXERCISE - Analytical and Descriptive Type3videos
CLASSIFICATION AND NOMENCLATURE OF ORGANIC COMPOUNDS
Similar Questions
Knowledge Check
- Question 1 - Select One
A schematic plot of ln Keq versus inverse of temperature for a reaction is shown below
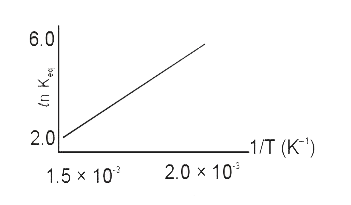
The reaction must beAendothermicBexothermicChighly spontaneous at ordinary temperatureDone with negligible enthalpy change - Question 2 - Select One
A schematic plot of In Keq versus inverse o ftemperature for a reaction is shown below
the reaction must be:AExothermicBEndothermicCOne with negligible enthalpy changeDHighly spontanceous at ordinary temperature - Question 3 - Select One
The graph relates. In Keq.vs.1T for a reaction. The reaction must be:
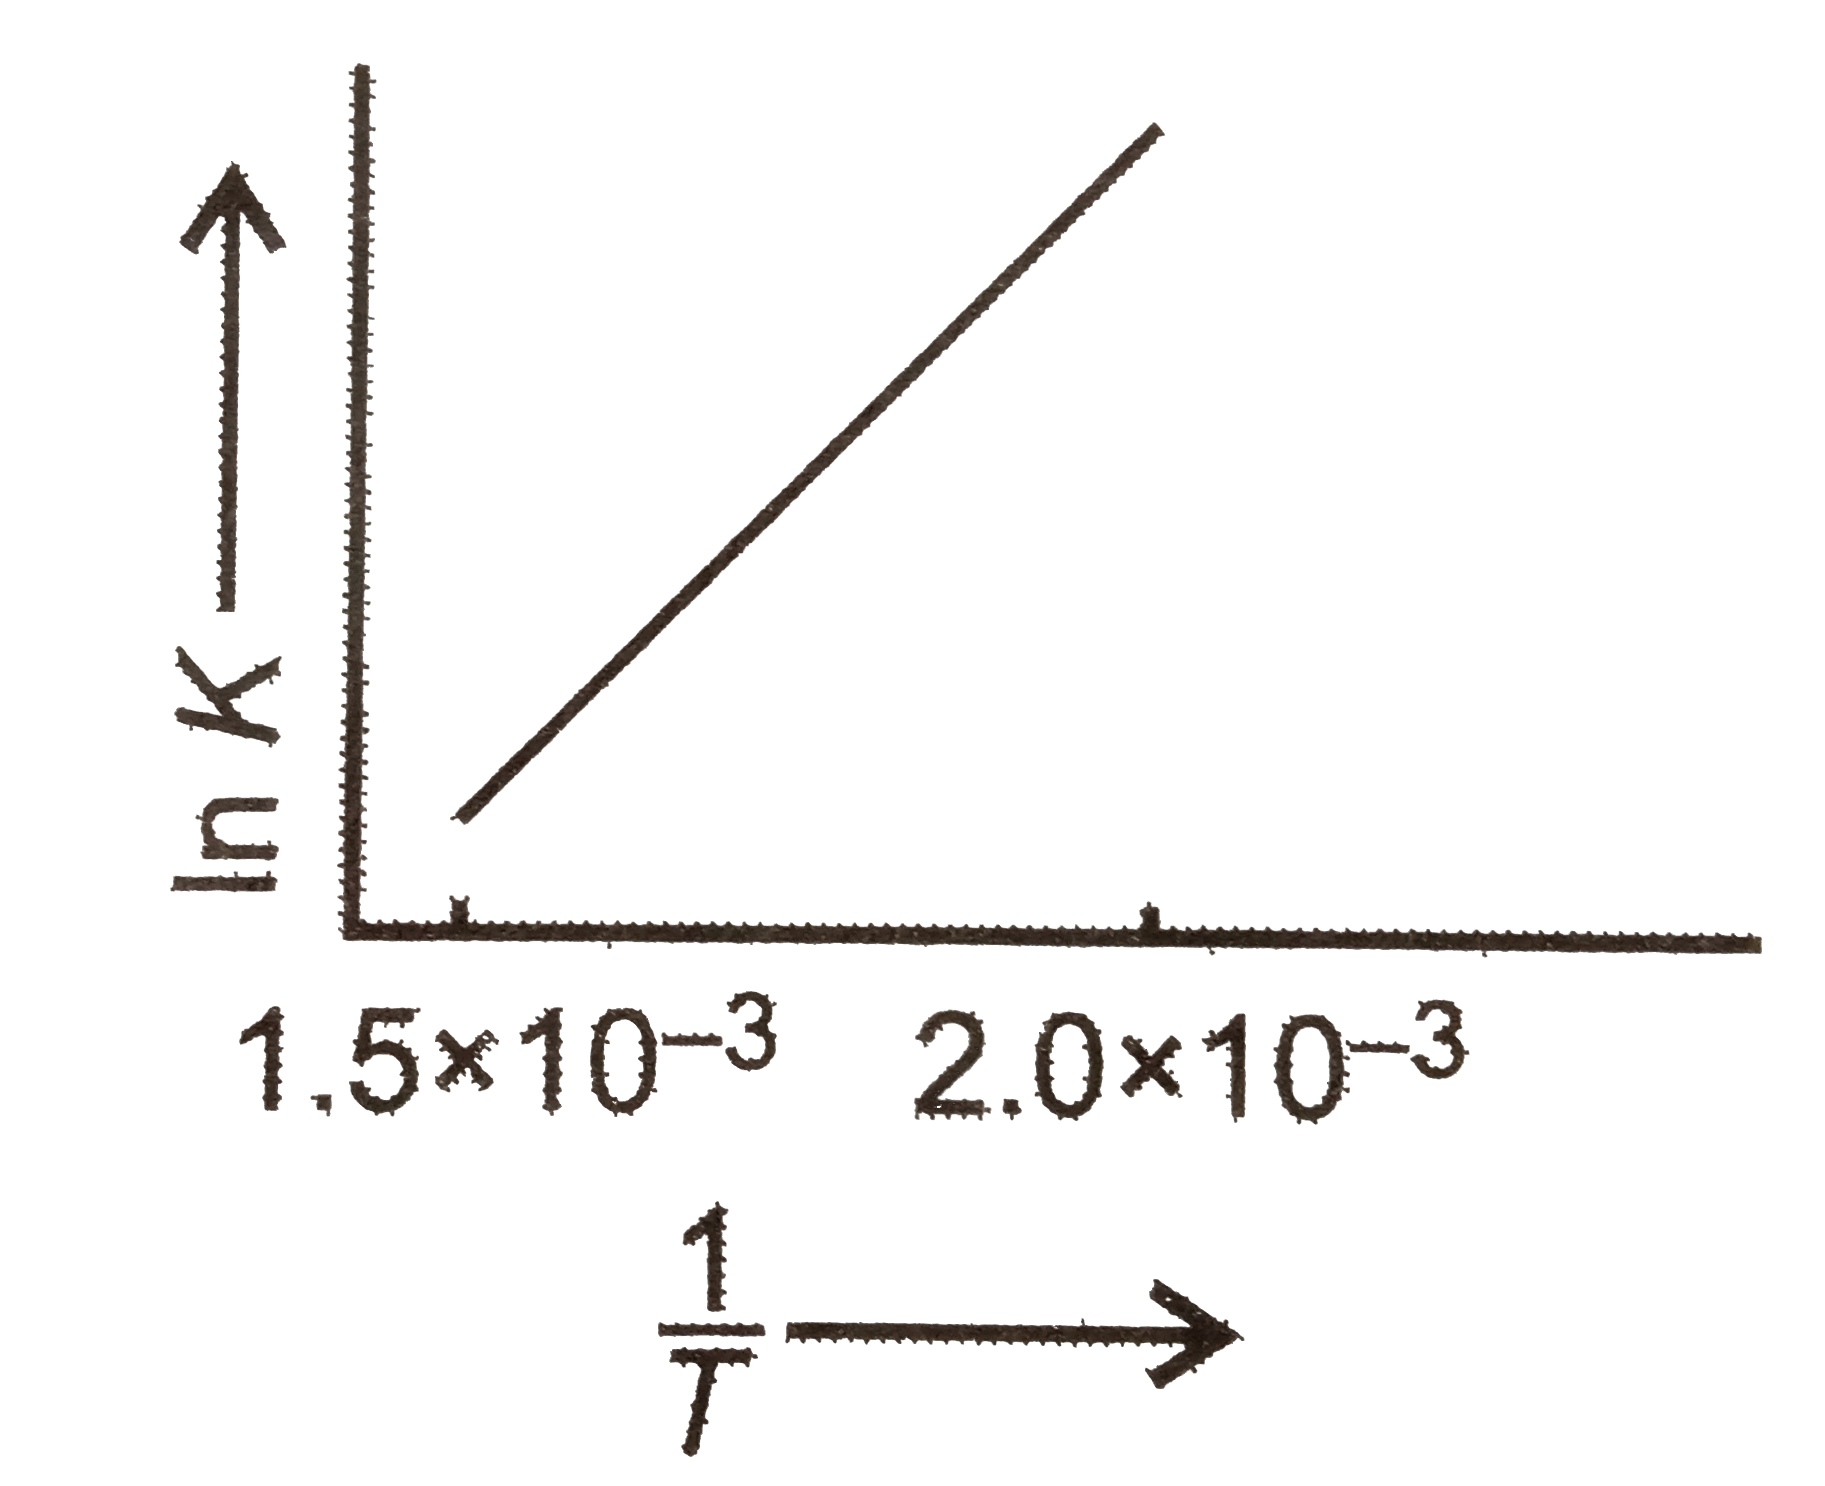 AexothermicBendothermicCΔH is negligibleDhigh spontaneous at ordinary temperature
Give the plot of log [R]0[R] vs time for a first order reaction.
View SolutionFor a chemical reaction, a plot of energy versus the progress of reaction can be represented as shown in the figure.
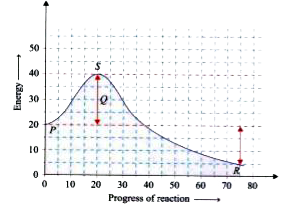
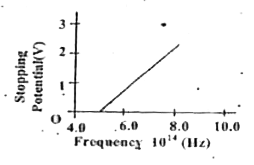
The following are true:View SolutionThe stopping potential vs frequency plot for a substance is shown in the figure. The work function of the substance is
 View Solution
The plot of concentration of the reactant vs time for a reaction is a straight line with a negative slope. This reaction follows
View SolutionThe plot of log k vs 1/T helps to calculate
View Solution


