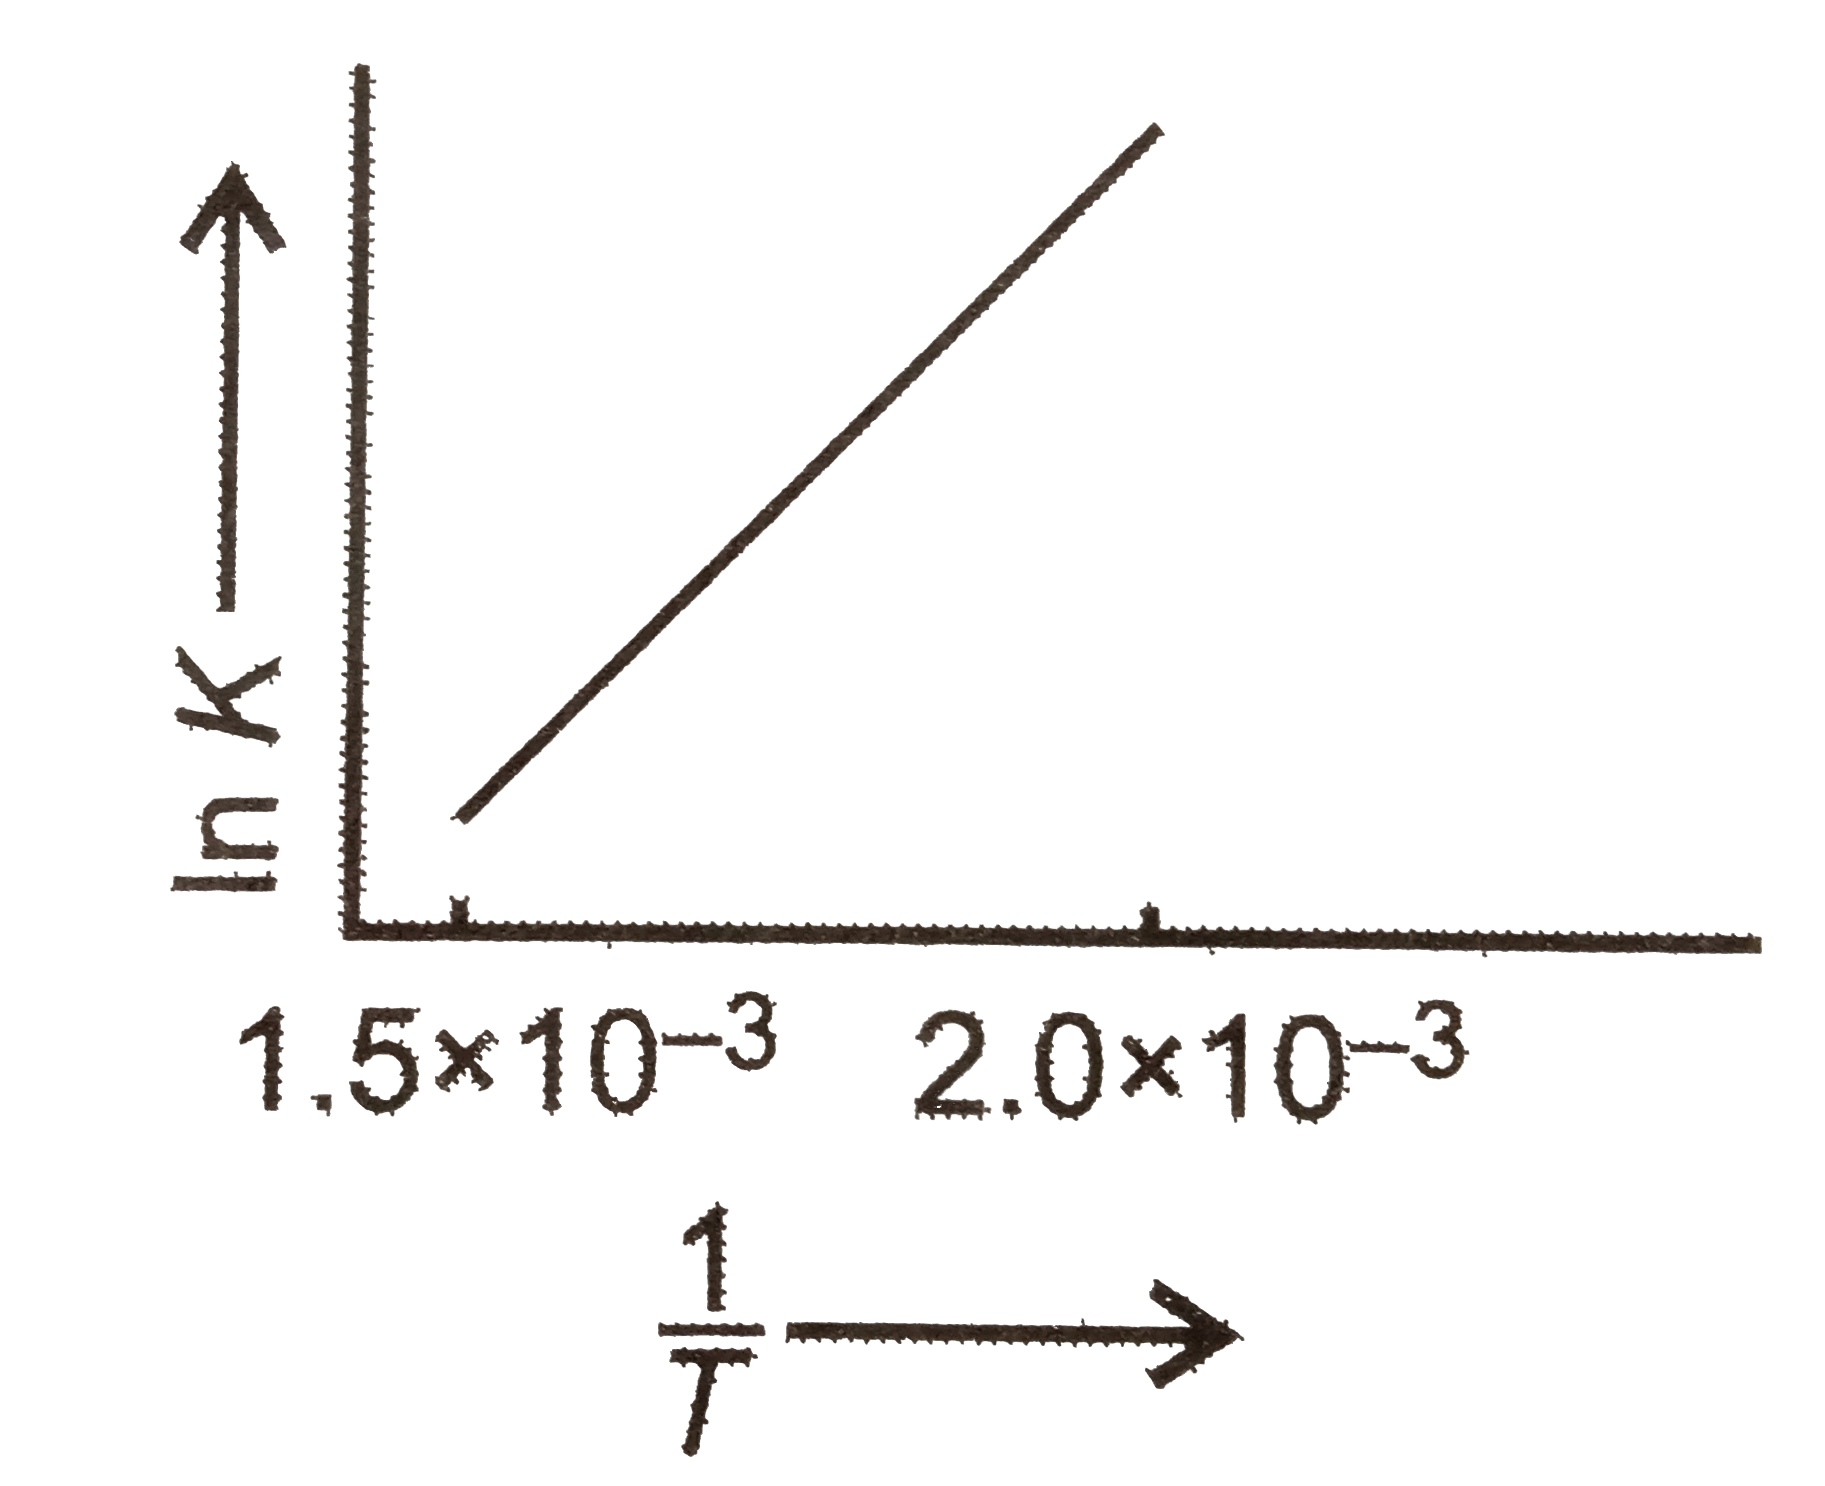
A schematic plot of ln Keq versus inverse of temperature for a reaction is shown below
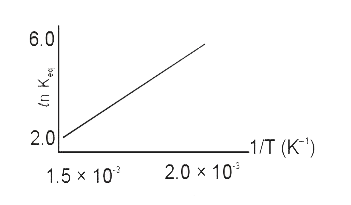
The reaction must be
Exothermic
Endothermic
One with negligible enthalpy change
Highly spontaneous at ordinary temperature
The correct Answer is:A
Step by step video & image solution for A schematic plot of ln K_(eq) versus inverse of temperature for a reaction is shown below The reaction must be by Chemistry experts to help you in doubts & scoring excellent marks in Class 12 exams.
Updated on:21/07/2023Topper's Solved these Questions
- THERMODYNAMICS AND THERMOCHEMISTRY BOOK - ERRORLESS CHAPTER - THERMODYNAMICS AND THERMOCHEMISTRY EXERCISE - ORDINARY THINKING (Objective Questions) Heat of reaction
174 Videos
- THERMODYNAMICS AND THERMOCHEMISTRY BOOK - ERRORLESS CHAPTER - THERMODYNAMICS AND THERMOCHEMISTRY EXERCISE - ORDINARY THINKING (Objective Questions) Bond energy
15 Videos
- THERMODYNAMICS AND THERMOCHEMISTRY BOOK - ERRORLESS CHAPTER - THERMODYNAMICS AND THERMOCHEMISTRY EXERCISE - JEE section (JEE (Advanced) 2018) Numeric answer type questions
2 Videos
- SOME BASIC CONCEPTS OF CHEMISTRYBOOK - ERRORLESS CHAPTER - SOME BASIC CONCEPTS OF CHEMISTRYEXERCISE - JEE Section (Matrix Match type questions)
3 Videos
Similar Questions
Assertion: The plot of volume (V) versus pressure (P) at constant temperature is a hyperbola in the first quadrant.
Reason: V∝1/P at constant temperature.
View SolutionFor the reaction aA+bB→cC+dD, the plot of log k vs 1T is given below,
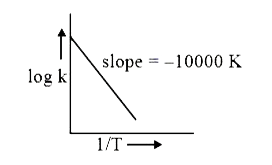
The temperature at which the rate constant of the reaction is 10−4s−1 is _____K.
(Rouded -off the nerest integer)
[Given : The rate constant of the reaction is 10−5s−1 at 500 K.]
View Solution
Knowledge Check
A schematic plot of In Keq versus inverse o ftemperature for a reaction is shown below
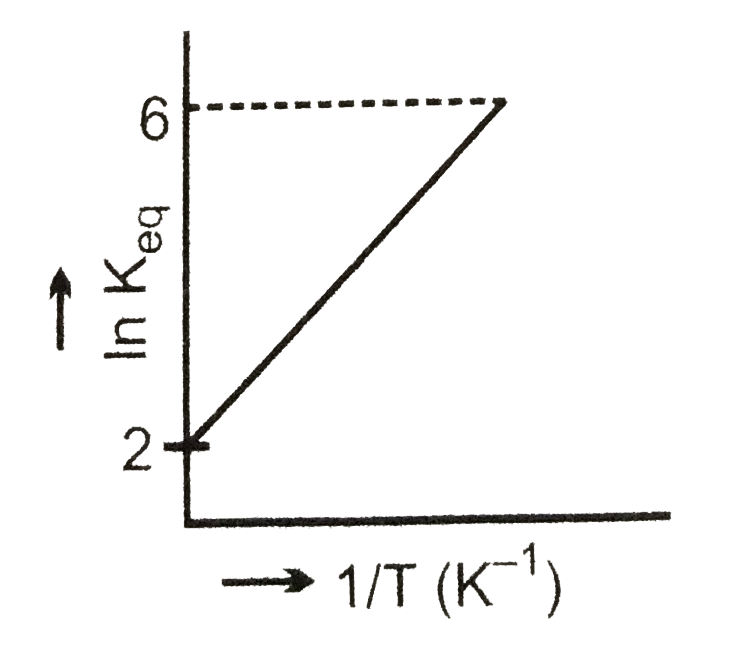
the reaction must be:AExothermicBEndothermicCOne with negligible enthalpy changeDHighly spontanceous at ordinary temperatureA schematic plot of log Keq vs inverse of temperature for a reaction is shown in the figure. The reaction must be:
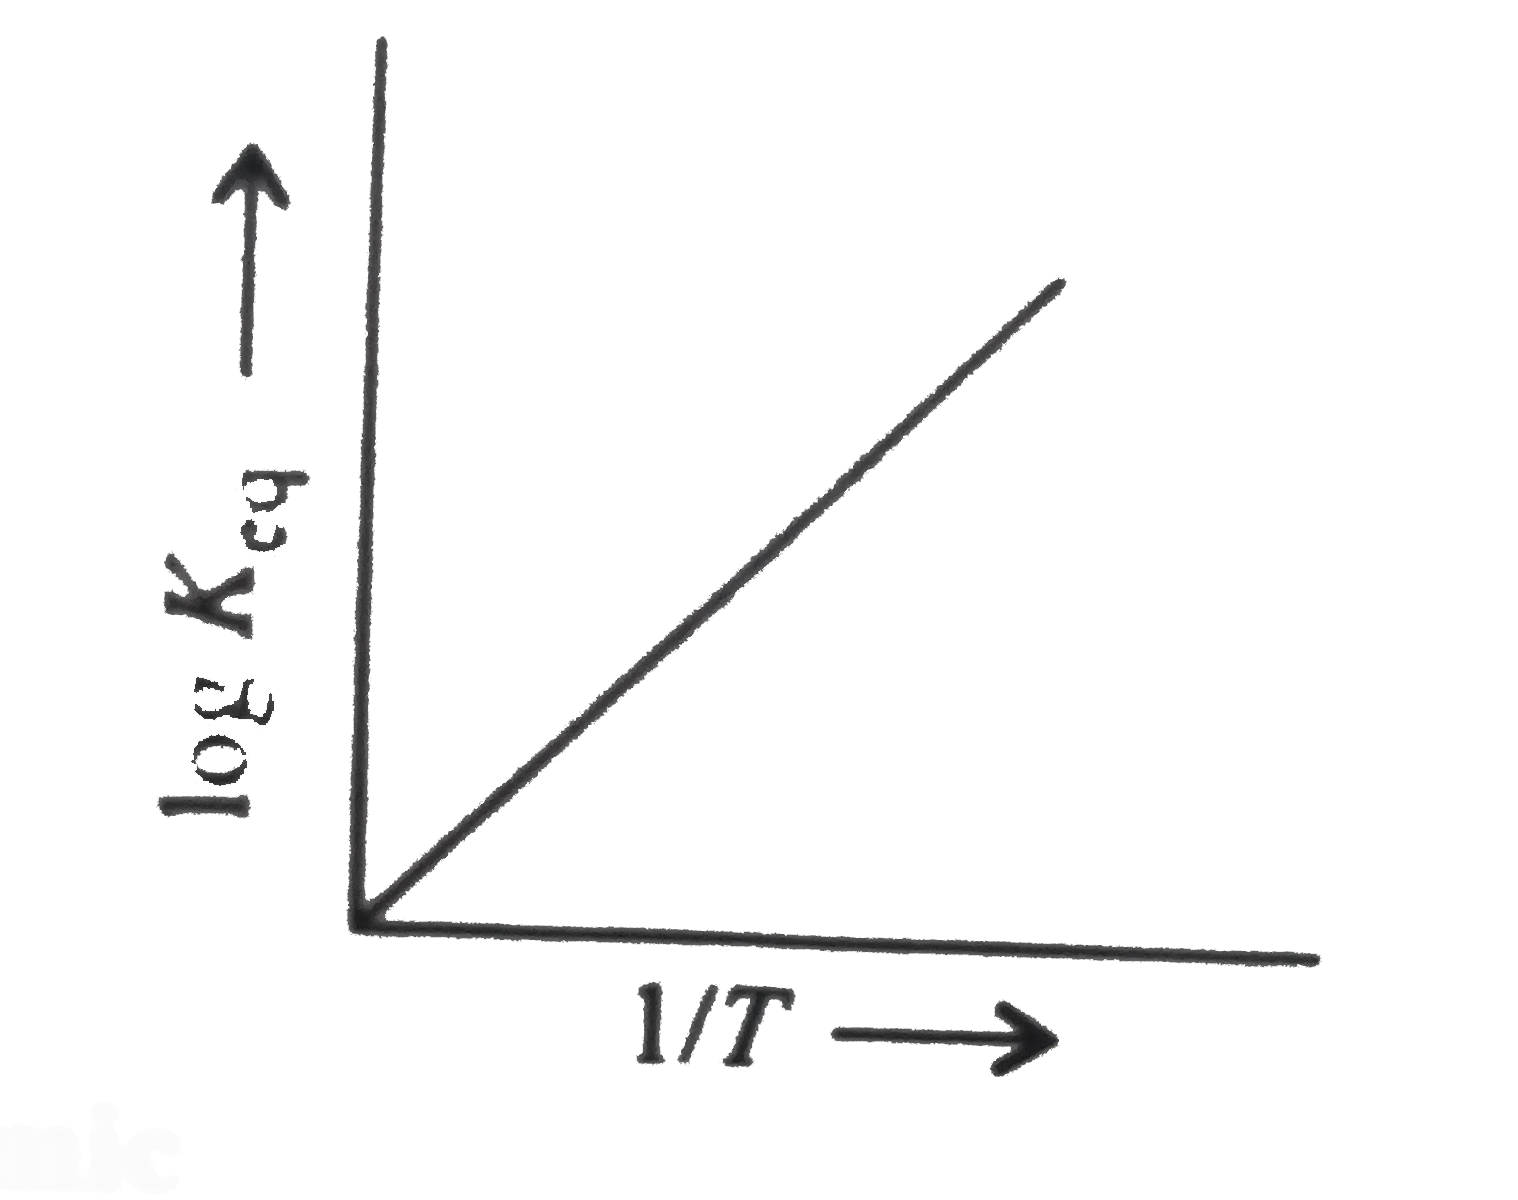 AExothermicBEndothermicCOne with negligible enthalpy changeDHighly spontaneous at ordinary temperature
The plot of In k versus 1T is liner with slope of
AEaRBEa2.303RCIn AD−EaR
Give a plot of Fahrenheit temperature versus Celsius temperature.
View SolutionThe plot of ΔG versus temperature for the formation of oxides of elements is called
View SolutionThe graph relates. In Keq.vs.1T for a reaction. The reaction must be:
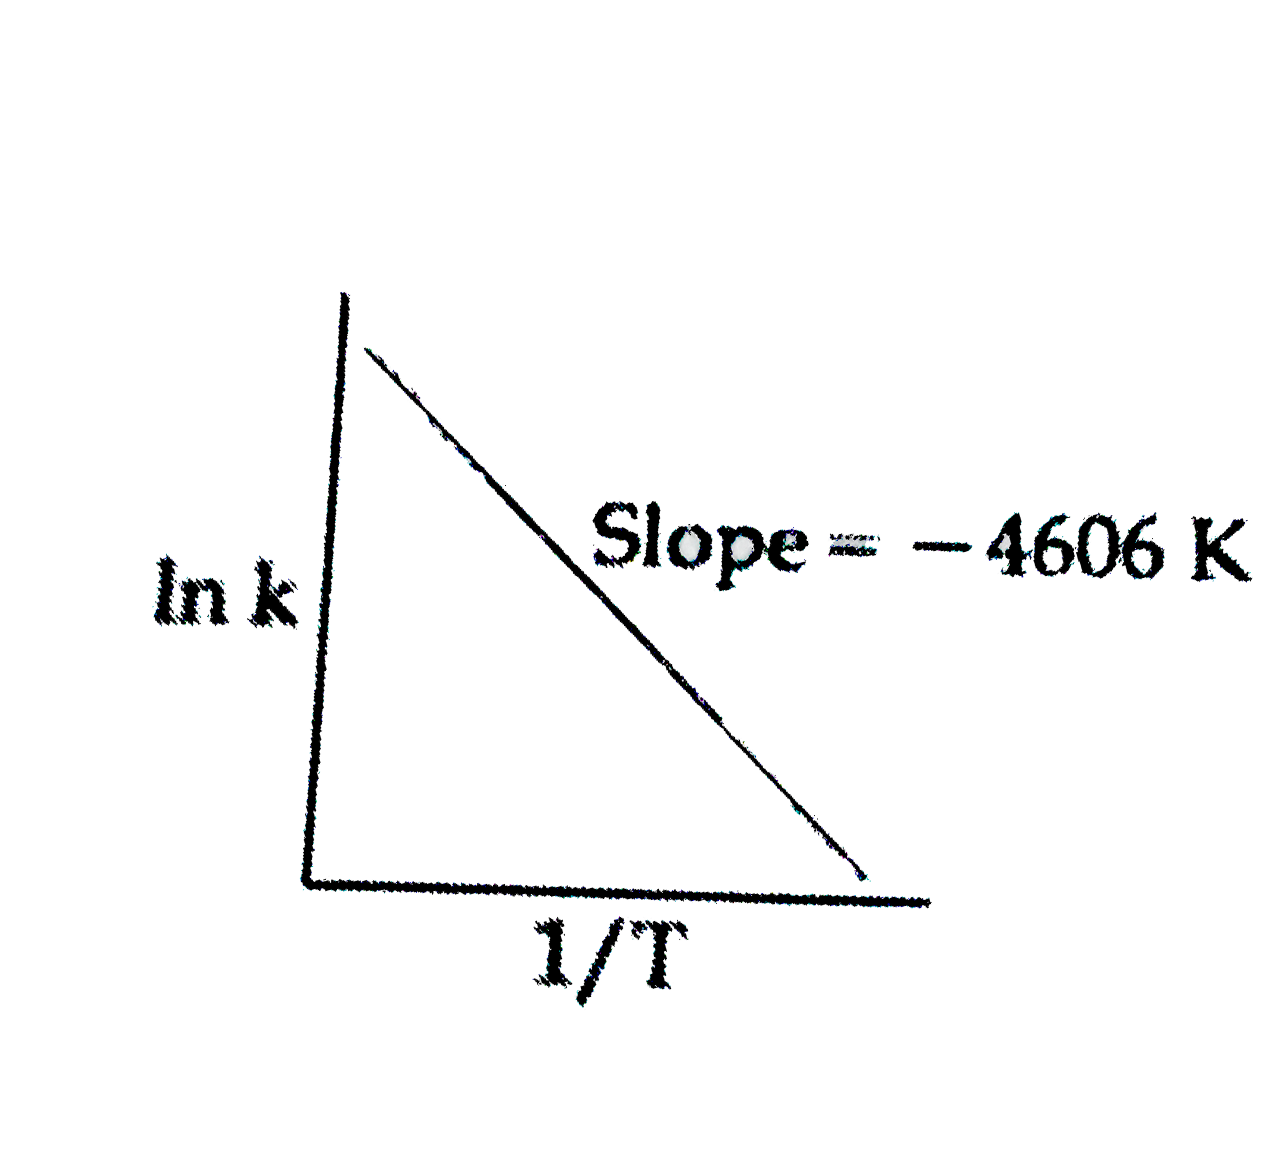
View SolutionFor a reaction, consider the plot of In K versus 1/T given in the figure. If the rate constant of this reaction at 400 K is 10−5s−1, then the rate constant at 500K is :
View SolutionFor a chemical reaction, a plot of energy versus the progress of reaction can be represented as shown in the figure.
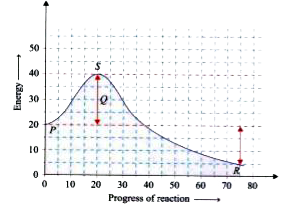
The following are true:
View Solution
