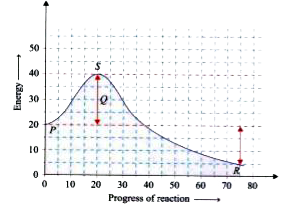
For a chemical reaction, a plot of energy versus the progress of reaction can be represented as shown in the figure.

The following are true:
A
P=ER, Q = threshold energy
B
P=ER, Q = activation energy
C
R=Ep, S = activation energy
D
R=Ep, S = threshold energy
Text Solution
The correct Answer is:A, B, D
|
Topper's Solved these Questions
- REACTION KINETICS AND CHEMICAL EQUILIBRIUMBOOK - CENGAGE CHEMISTRYCHAPTER - REACTION KINETICS AND CHEMICAL EQUILIBRIUMEXERCISE - CHALLENGING EXERCISE
5 Videos
- REACTION KINETICS AND CHEMICAL EQUILIBRIUMBOOK - CENGAGE CHEMISTRYCHAPTER - REACTION KINETICS AND CHEMICAL EQUILIBRIUMEXERCISE - OLYMPIAD AND NTSE LEVEL EXERCISES
10 Videos
- REACTION KINETICS AND CHEMICAL EQUILIBRIUMBOOK - CENGAGE CHEMISTRYCHAPTER - REACTION KINETICS AND CHEMICAL EQUILIBRIUMEXERCISE - CONSOLIDATED EXERCISE
4 Videos
- RADIOACTIVITYBOOK - CENGAGE CHEMISTRYCHAPTER - RADIOACTIVITYEXERCISE - OLYMPIAD AND NTSE LEVEL EXERCISES
10 Videos
- THERMODYNAMICS AND THERMOCHEMISTRYBOOK - CENGAGE CHEMISTRYCHAPTER - THERMODYNAMICS AND THERMOCHEMISTRYEXERCISE - OLYMPIAD AND NTSE LEVEL EXERCISES
10 Videos
Similar Questions
Knowledge Check
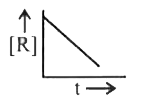
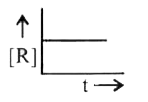
The plot that represents the zero order reaction is:
A B
B C
C D
D
For a zero order reaction, the plot of concentration versus time is linear with
APositive slope with zero interceptBpositive slope with non-zero interceptCnegative slope with non-zero interceptDparallel to time axisThe plote between concentration versus time for a zero order reaction is represented by :
A B
B C
C D
D
The plote between concentration versus time for a zero order reaction is represented by :
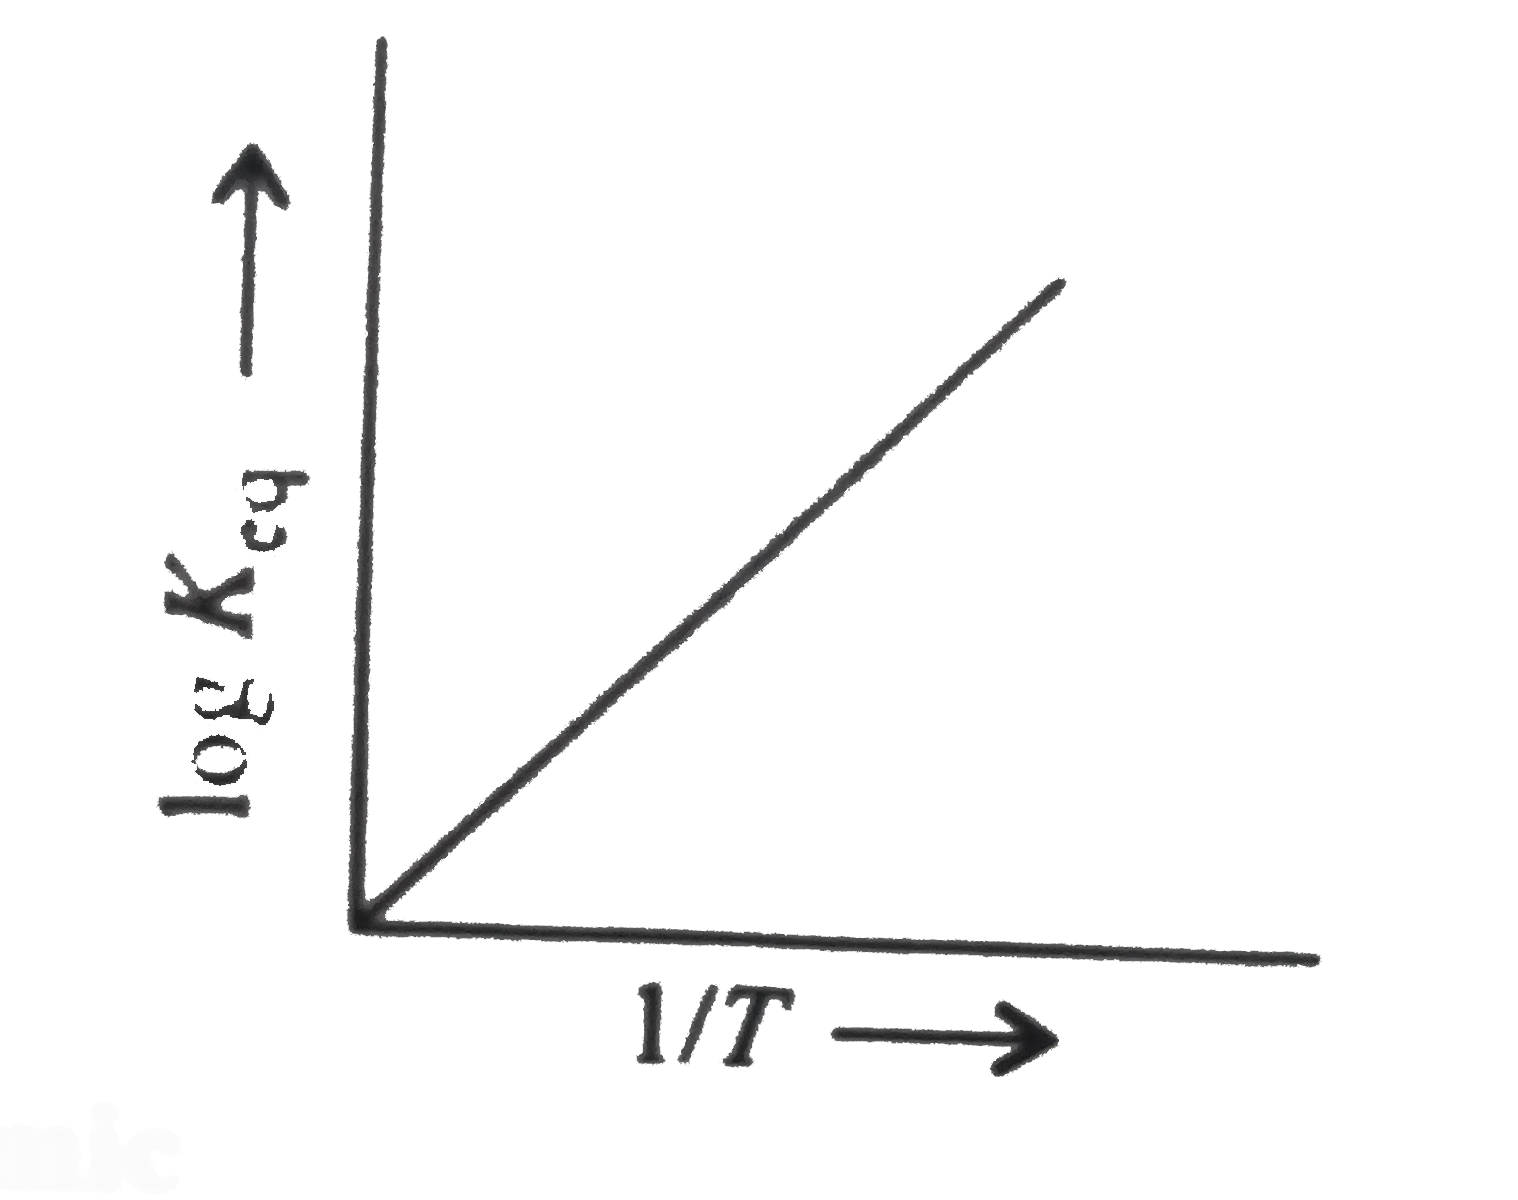
View SolutionA schematic plot of log Keq vs inverse of temperature for a reaction is shown in the figure. The reaction must be:

View SolutionActivation energy of a chemical reaction can be determined by
View SolutionActivation energy of a chemical reaction can be determined by:
View SolutionActivation energy of a chemical reaction can be determined by
View Solution
