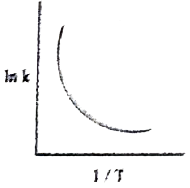
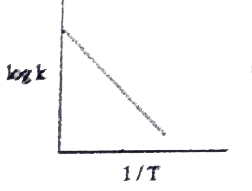
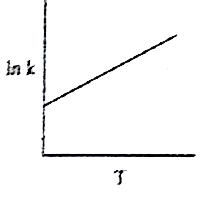
Among the following graphs showing variation of rate constant with temperature (T) for a reaction the one that exhibits Arrhenius behavior over the eniture temperature range is …..Solution in Tamil


both (b) and (c)
k=Ae−EaRT)
this equation is in the form of a straight line equation y= c+ mx
a plot of ink vs (1T) is a straight line with negative slope
Topper's Solved these Questions
- SAMPLE PAPER 2 (SOLVED)BOOK - FULL MARKSCHAPTER - SAMPLE PAPER 2 (SOLVED)EXERCISE - PART II
9 Videos
- SAMPLE PAPER 2 (SOLVED)BOOK - FULL MARKSCHAPTER - SAMPLE PAPER 2 (SOLVED)EXERCISE - PART III
9 Videos
- SAMPLE PAPER 10 (SOLVED)BOOK - FULL MARKSCHAPTER - SAMPLE PAPER 10 (SOLVED)EXERCISE - Part-IV
10 Videos
- SAMPLE PAPER-4 (SOLVED)BOOK - FULL MARKSCHAPTER - SAMPLE PAPER-4 (SOLVED)EXERCISE - PART - IV
11 Videos
Similar Questions
What are the various steps involved in extraction of pure metals from their ores ?
View SolutionA hydride of 2nd period alkali metal (A ) on reaction with compound of Boron (B ) to give a reducing agent (c ) I dentify A, B and C.
View Solution(a) (i) What is Cementation?
(ii) Write a notes on ionisation enthalpy in p-block elements?
View Solution(i)Explain the concentration of copper pyrites and galena ores.
(ii) Out of Lu(OH)3andLa(OH)3 which is more basic and why?
View SolutionPlots showing the variation of the rate constant (k) with temperature (T) are given below. The plot that follows the Arrhenius equation is
View SolutionWhich of the following graph is incorrect for variation of rate constant (K) with temperature for a reaction obeying Arrhenius equation ?
View SolutionPlots showing the variation of the rate constant (k) with temperature (T) are given below. The plot that follows the Arrhenius equation is
View Solutionवेग स्थिरांक (rate constant) (K) तथा ताप (T) में खींचे गए ग्राफ नीचे दिए गए है इनमे से कौन-सा ग्राफ आरहीनियस समीकरण का पालन करता है
View SolutionPlots showing the variation of the rate constant (k) with temperature (T) are given below. The plot that follows Arrhenius equations is
View SolutionPlots showing the variation of the rate constant (k) with temperature (T) are given below. The plot that follows the Arrhenius equation is
View SolutionAmong the following graphs showing variation of rate constant with temperature (T) for a reaction the one that exhibits Arrhenius behavior over the eniture temperature range is …..
View SolutionAmong the following graphs showing variation of rate constant with temperature (T) for a reaction, the one that exhibits Arrhenius behavior over the entire temperature range is .........
View SolutionArrhenius equation is :
k=Ae−E/RT
Which of the following graphs represents the variation of rate constant k against temperatureT ?
View SolutionWhich of the following graph shows the variation of surface tension with temperature over small temperature ranges for water?
View SolutionVarious Solved Numerical Questions on Arrhenius Equation || Variation OF Rate Constant with Temperature || Variation OF Equilibrium Constant with Temperature
View Solution
