Among the following graphs showing variation of rate constant with temperature (T) for a reaction, the one that exhibits Arrhenius behavior over the entire temperature range is .........


both (b) and (c)
The correct Answer is:B
k=Ae(EaRT)
lnk=lnA−(EaR)(1T)
this equation is in the form of a straight line with negative slope .
Topper's Solved these Questions
- CHEMICAL KINETICSBOOK - FULL MARKSCHAPTER - CHEMICAL KINETICSEXERCISE - TEXTBOOK EVALUATION (II. ANSWER THE FOLLOWING QUESTIONS)
30 Videos
- CHEMICAL KINETICSBOOK - FULL MARKSCHAPTER - CHEMICAL KINETICSEXERCISE - ADDITIONAL QUESTIONS (I. CHOOSE THE CORRECT ANSWER)
50 Videos
- CHEMICAL KINETICSBOOK - FULL MARKSCHAPTER - CHEMICAL KINETICSEXERCISE - EVALUATE YOURSELF
8 Videos
- CARBONYL COMPOUNDSBOOK - FULL MARKSCHAPTER - CARBONYL COMPOUNDSEXERCISE - ADDITIONAL QUESTIONS (5 MARKS QUESTIONS)
34 Videos
- CHEMISTRY IN EVERYDAY LIFE BOOK - FULL MARKSCHAPTER - CHEMISTRY IN EVERYDAY LIFE EXERCISE - ADDITIONAL QUESTION ( 5 Mark Questions )
2 Videos
Similar Questions
Which one of the following given graphs represents the variation of rate constant (k) with temperature (t) for an endothermic reaction ?
View SolutionWhich one of the following given graphs represents the variation of rate constant (k) with temperature (f) for an endothermic reaction ?
View Solution
Knowledge Check
Which of the following graph is incorrect for variation of rate constant (K) with temperature for a reaction obeying Arrhenius equation ?
A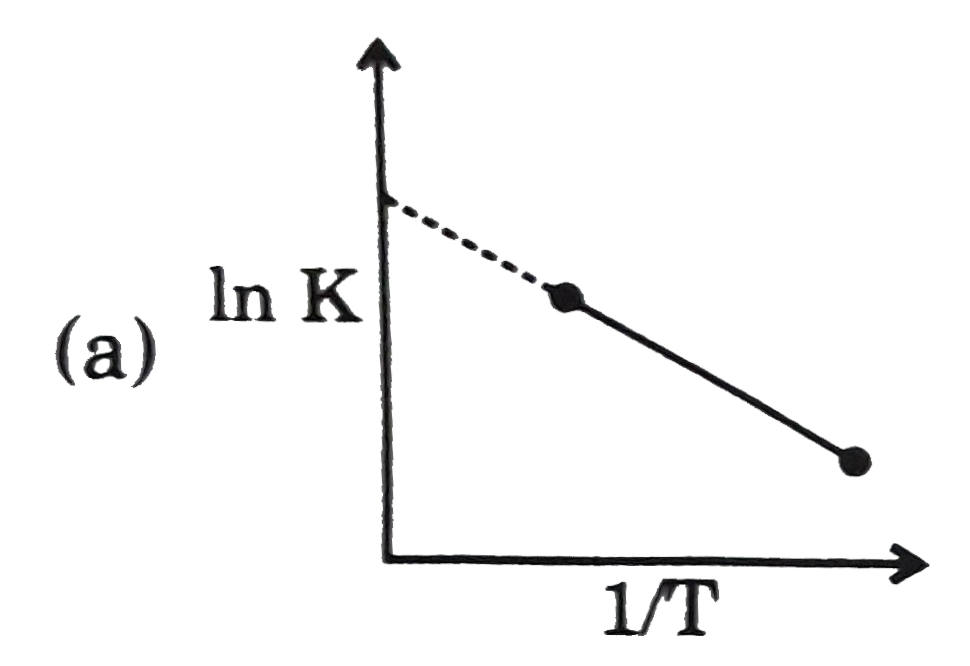 B
B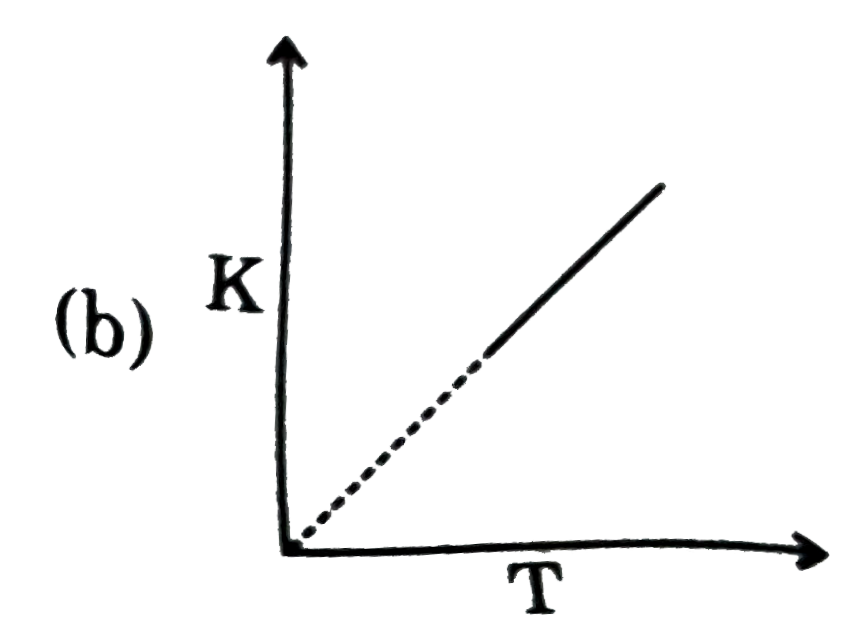 C
C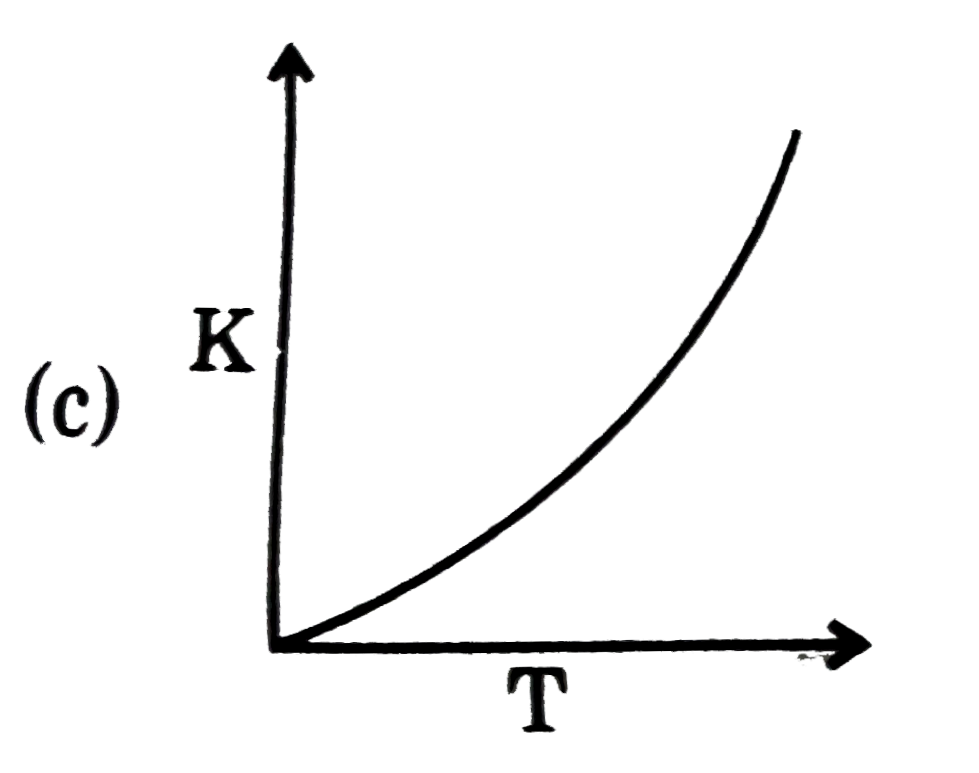 D
D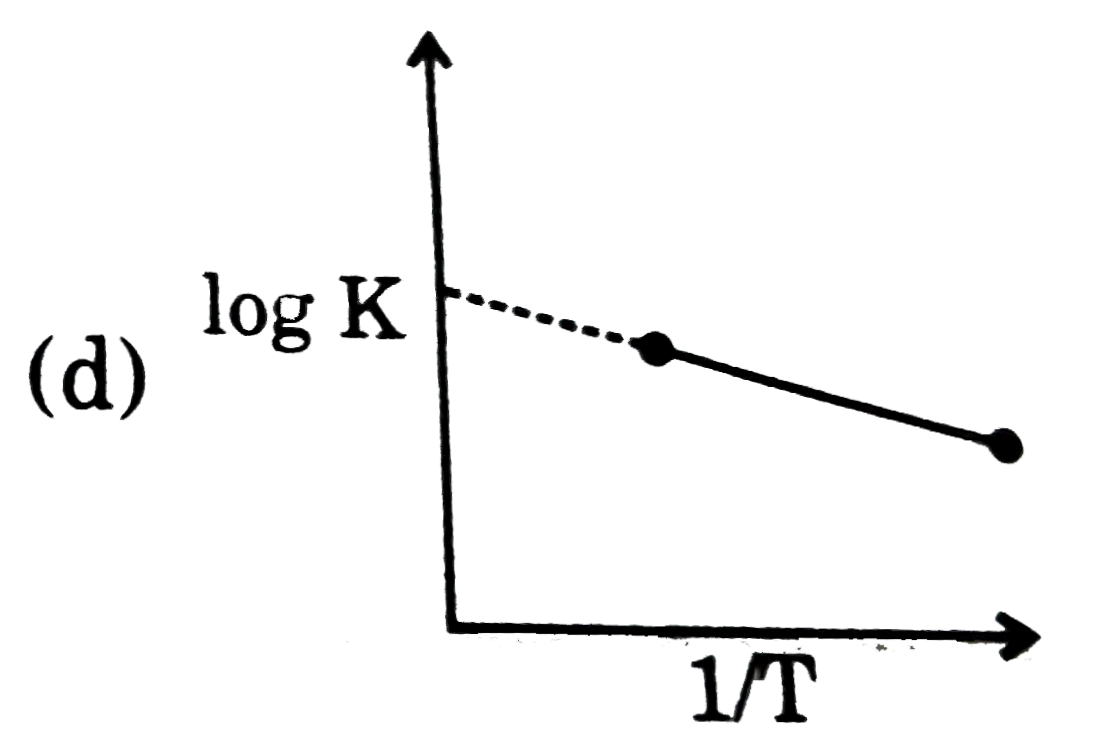
Plots showing the variation of the rate constant (k) with temperature (T) are given below. The plot that follows the Arrhenius equation is
A B
B C
C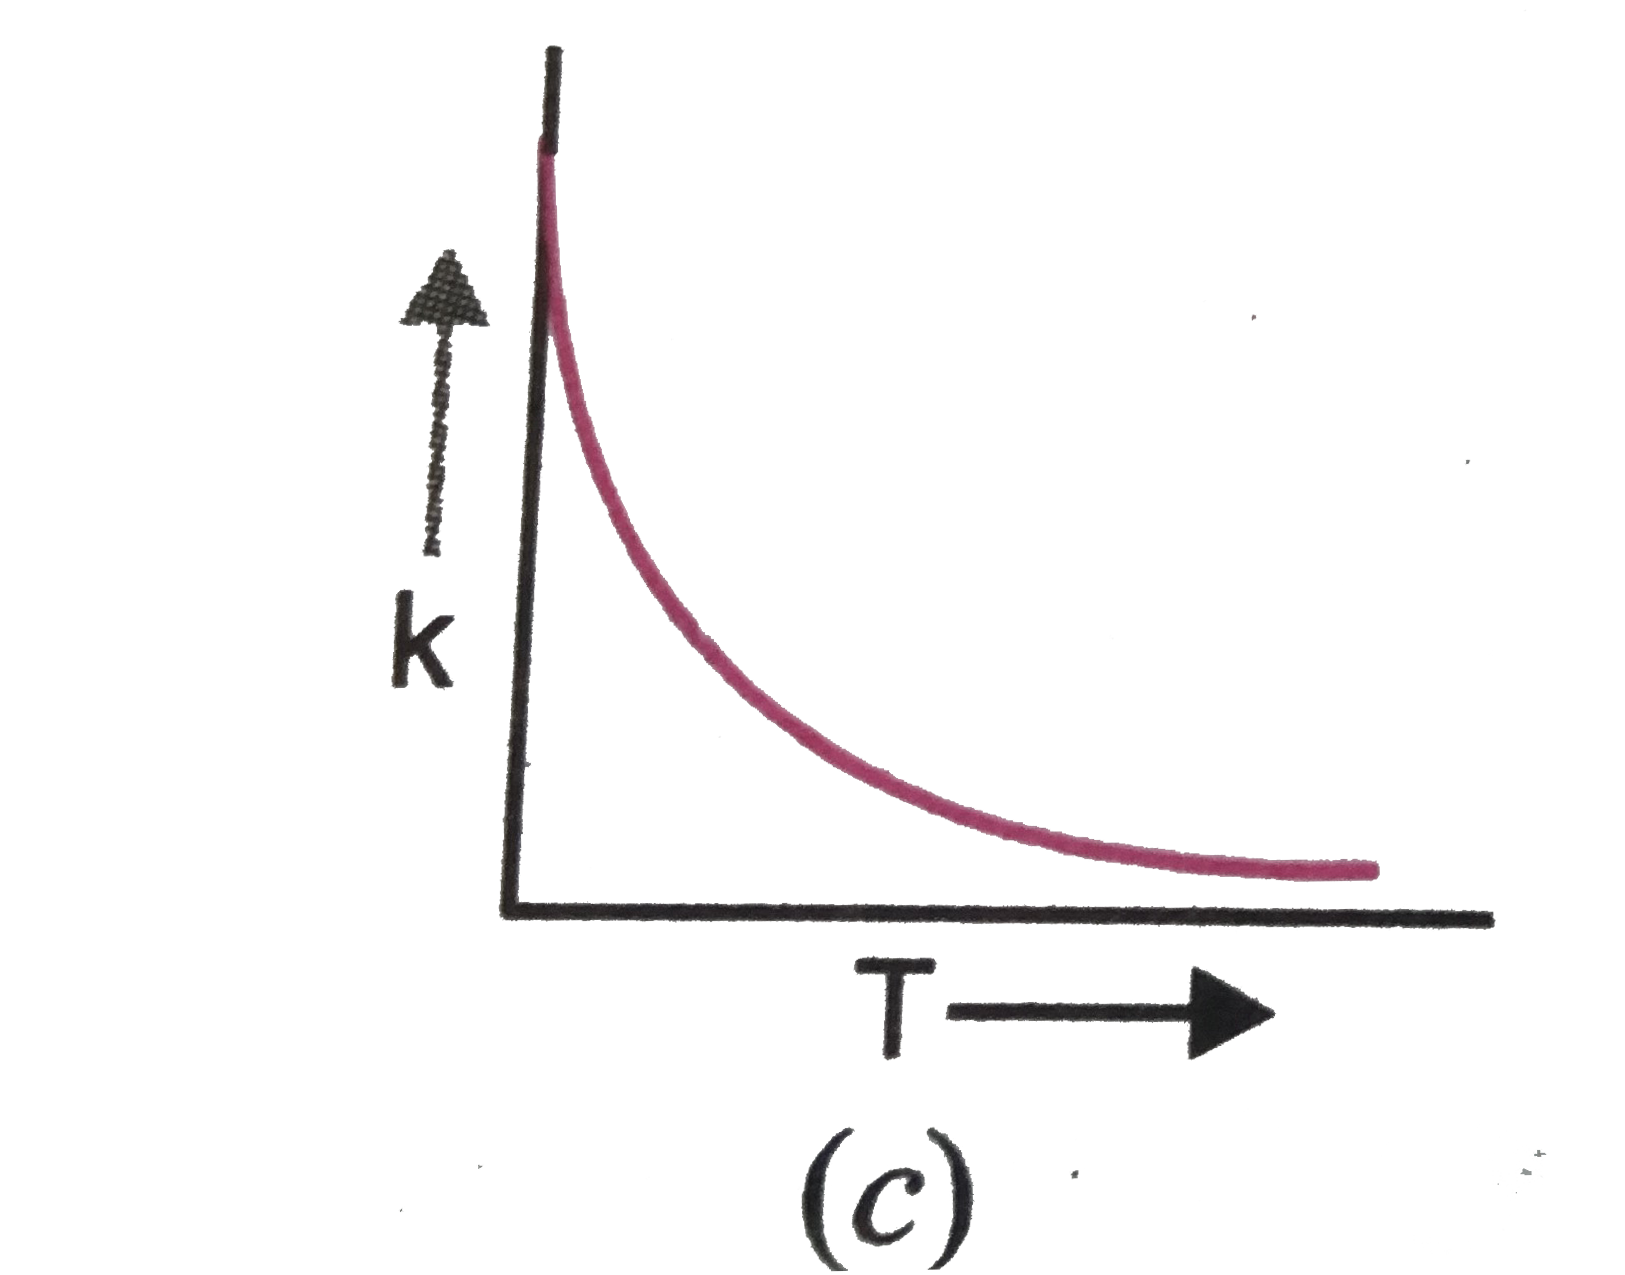 D
D
Plots showing the variation of the rate constant (k) with temperature (T) are given below. The plot that follows Arrhenius equations is
A B
B C
C D
D
Plots showing the variation of the rate constant (k) with temperature (T) are given below. The plot that follows the Arrhenius equation is
View SolutionPlots showing the variation of the rate constant (k) with temperature (T) are given below. The plot that follows the Arrhenius equation is
View Solutionwhich of the following graph represents the variation of resistivity (ρ) with temperature (T) for copper?
View SolutionWhich of the following graphs shows variation between density of water and temperature?
View SolutionPlots showing the variation of the rate constant (k) with temperature (T) are given below. The plot that follows the Arrhenius equation is
View Solution
