For three different metals A,B,C photoemission is observed one by one. The graph of maximum kinetic energy versus frequency f incident radiation are sketched as:
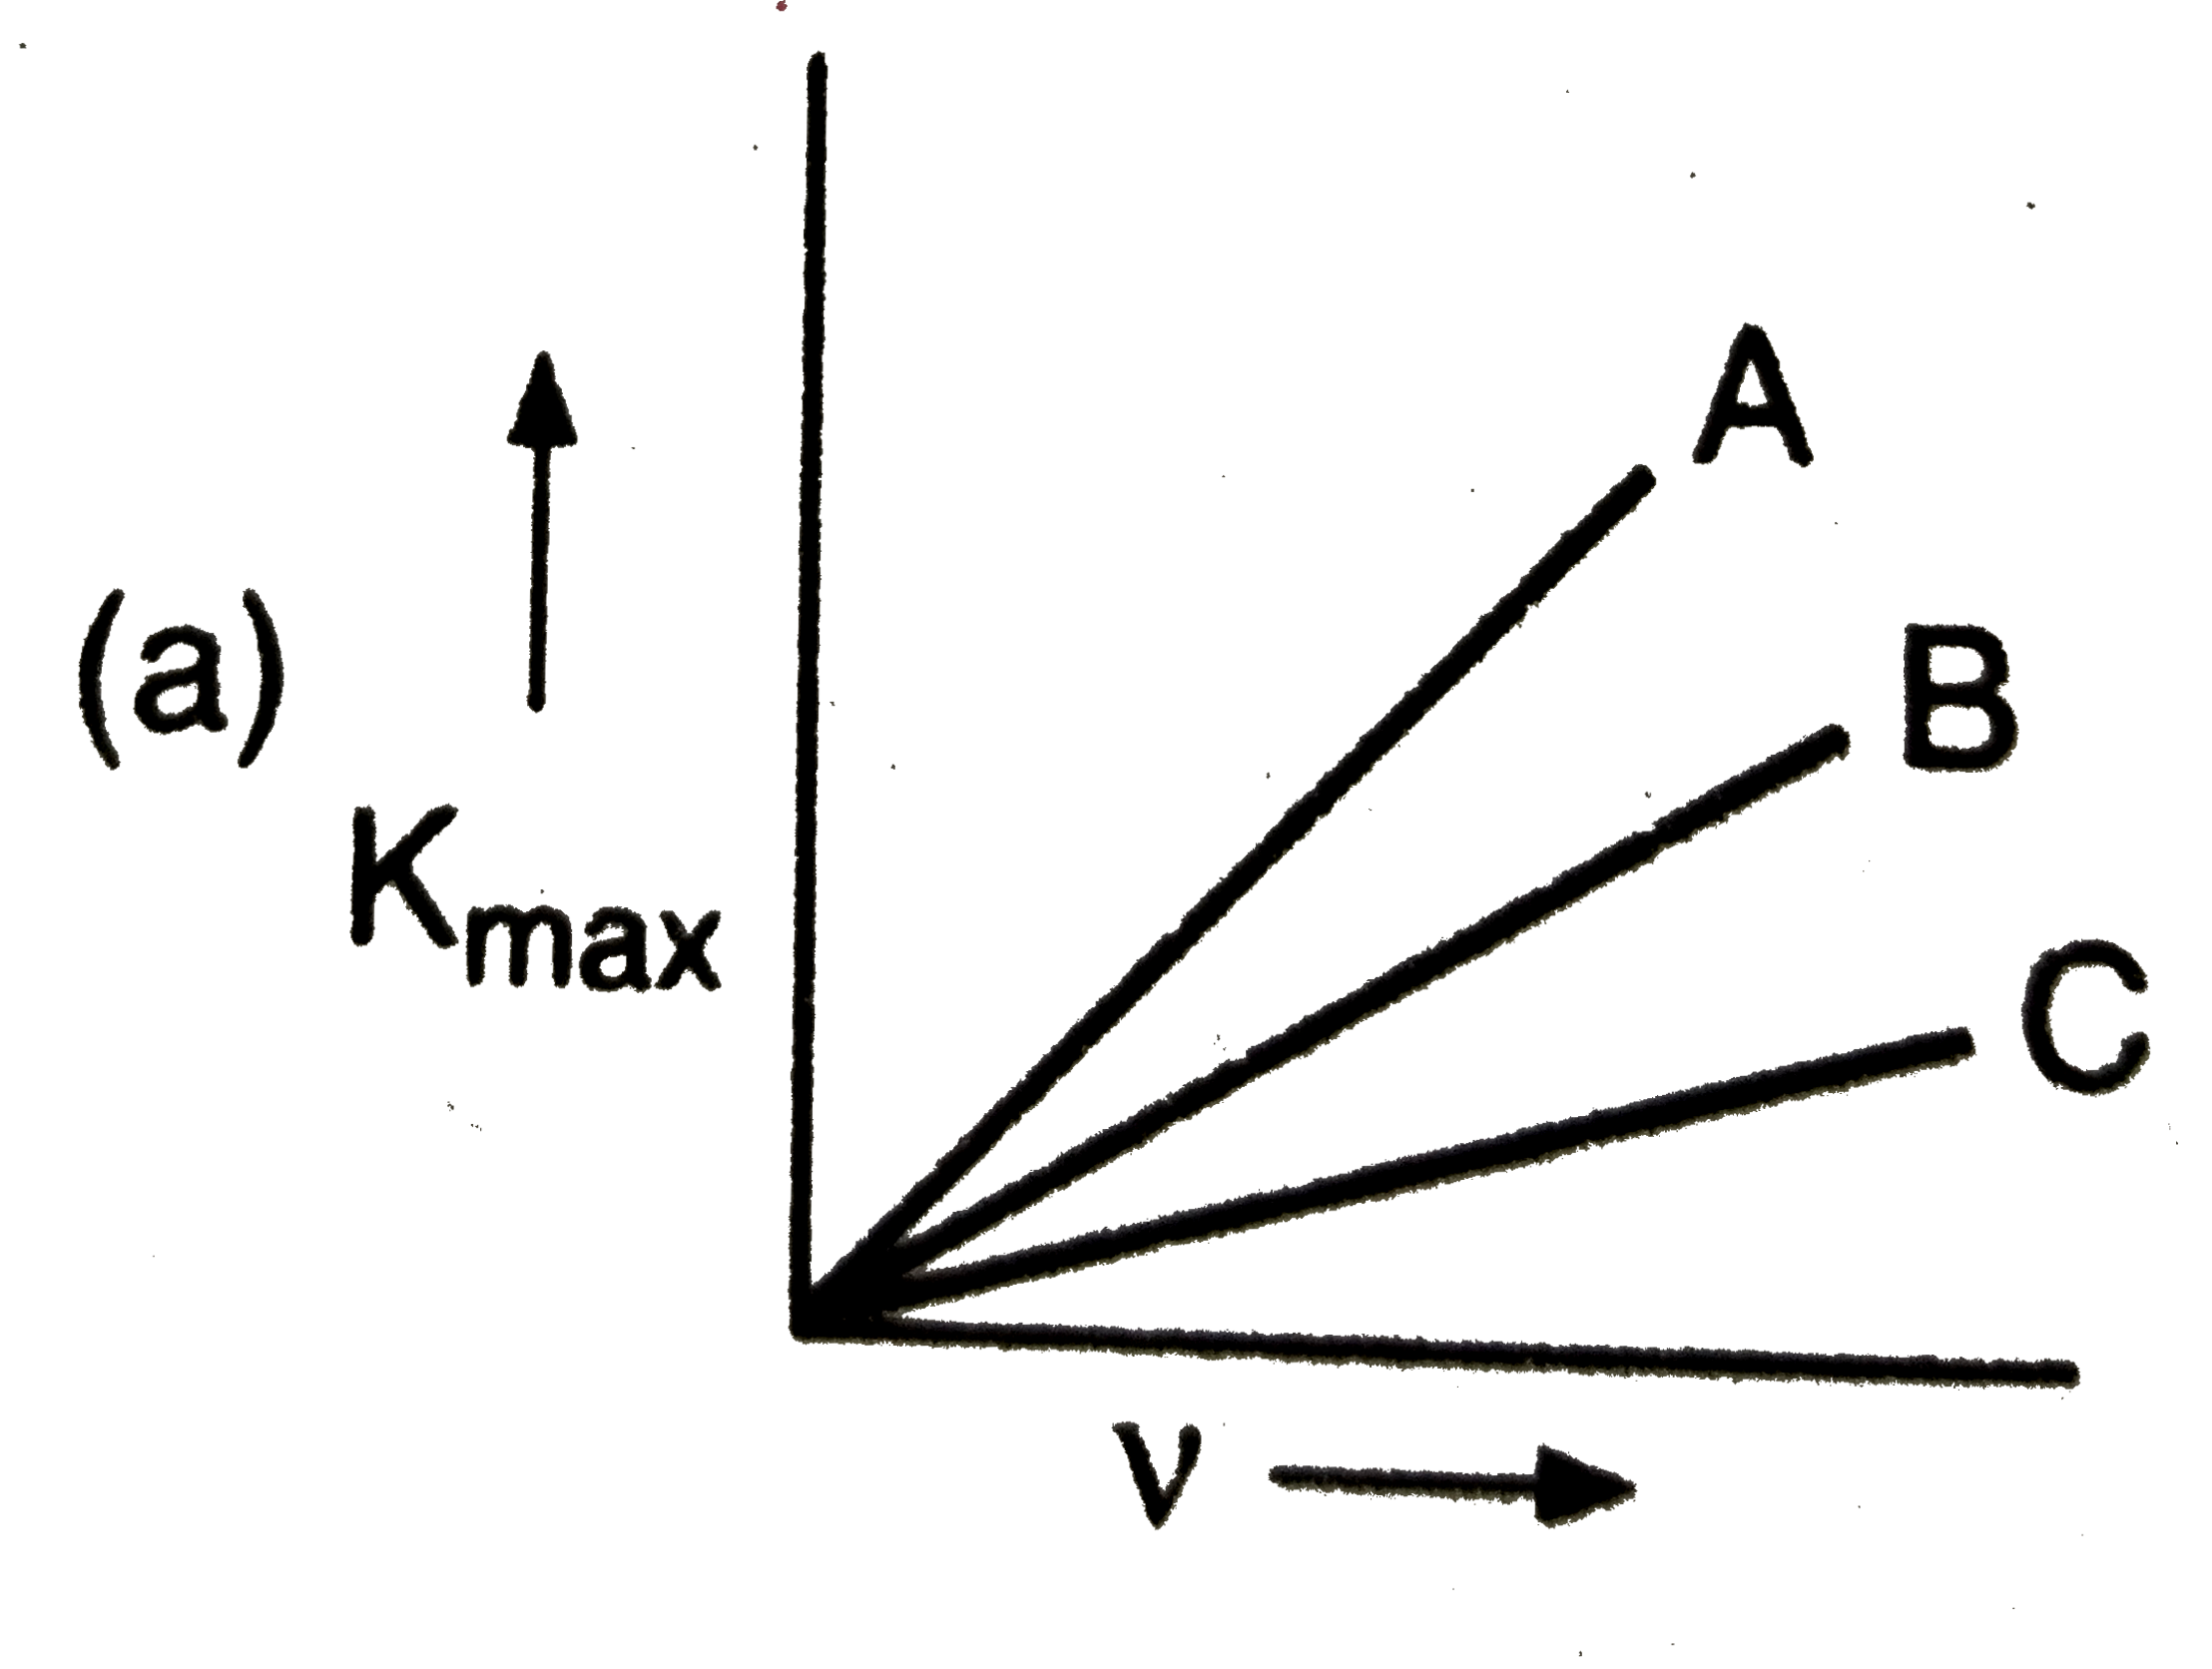
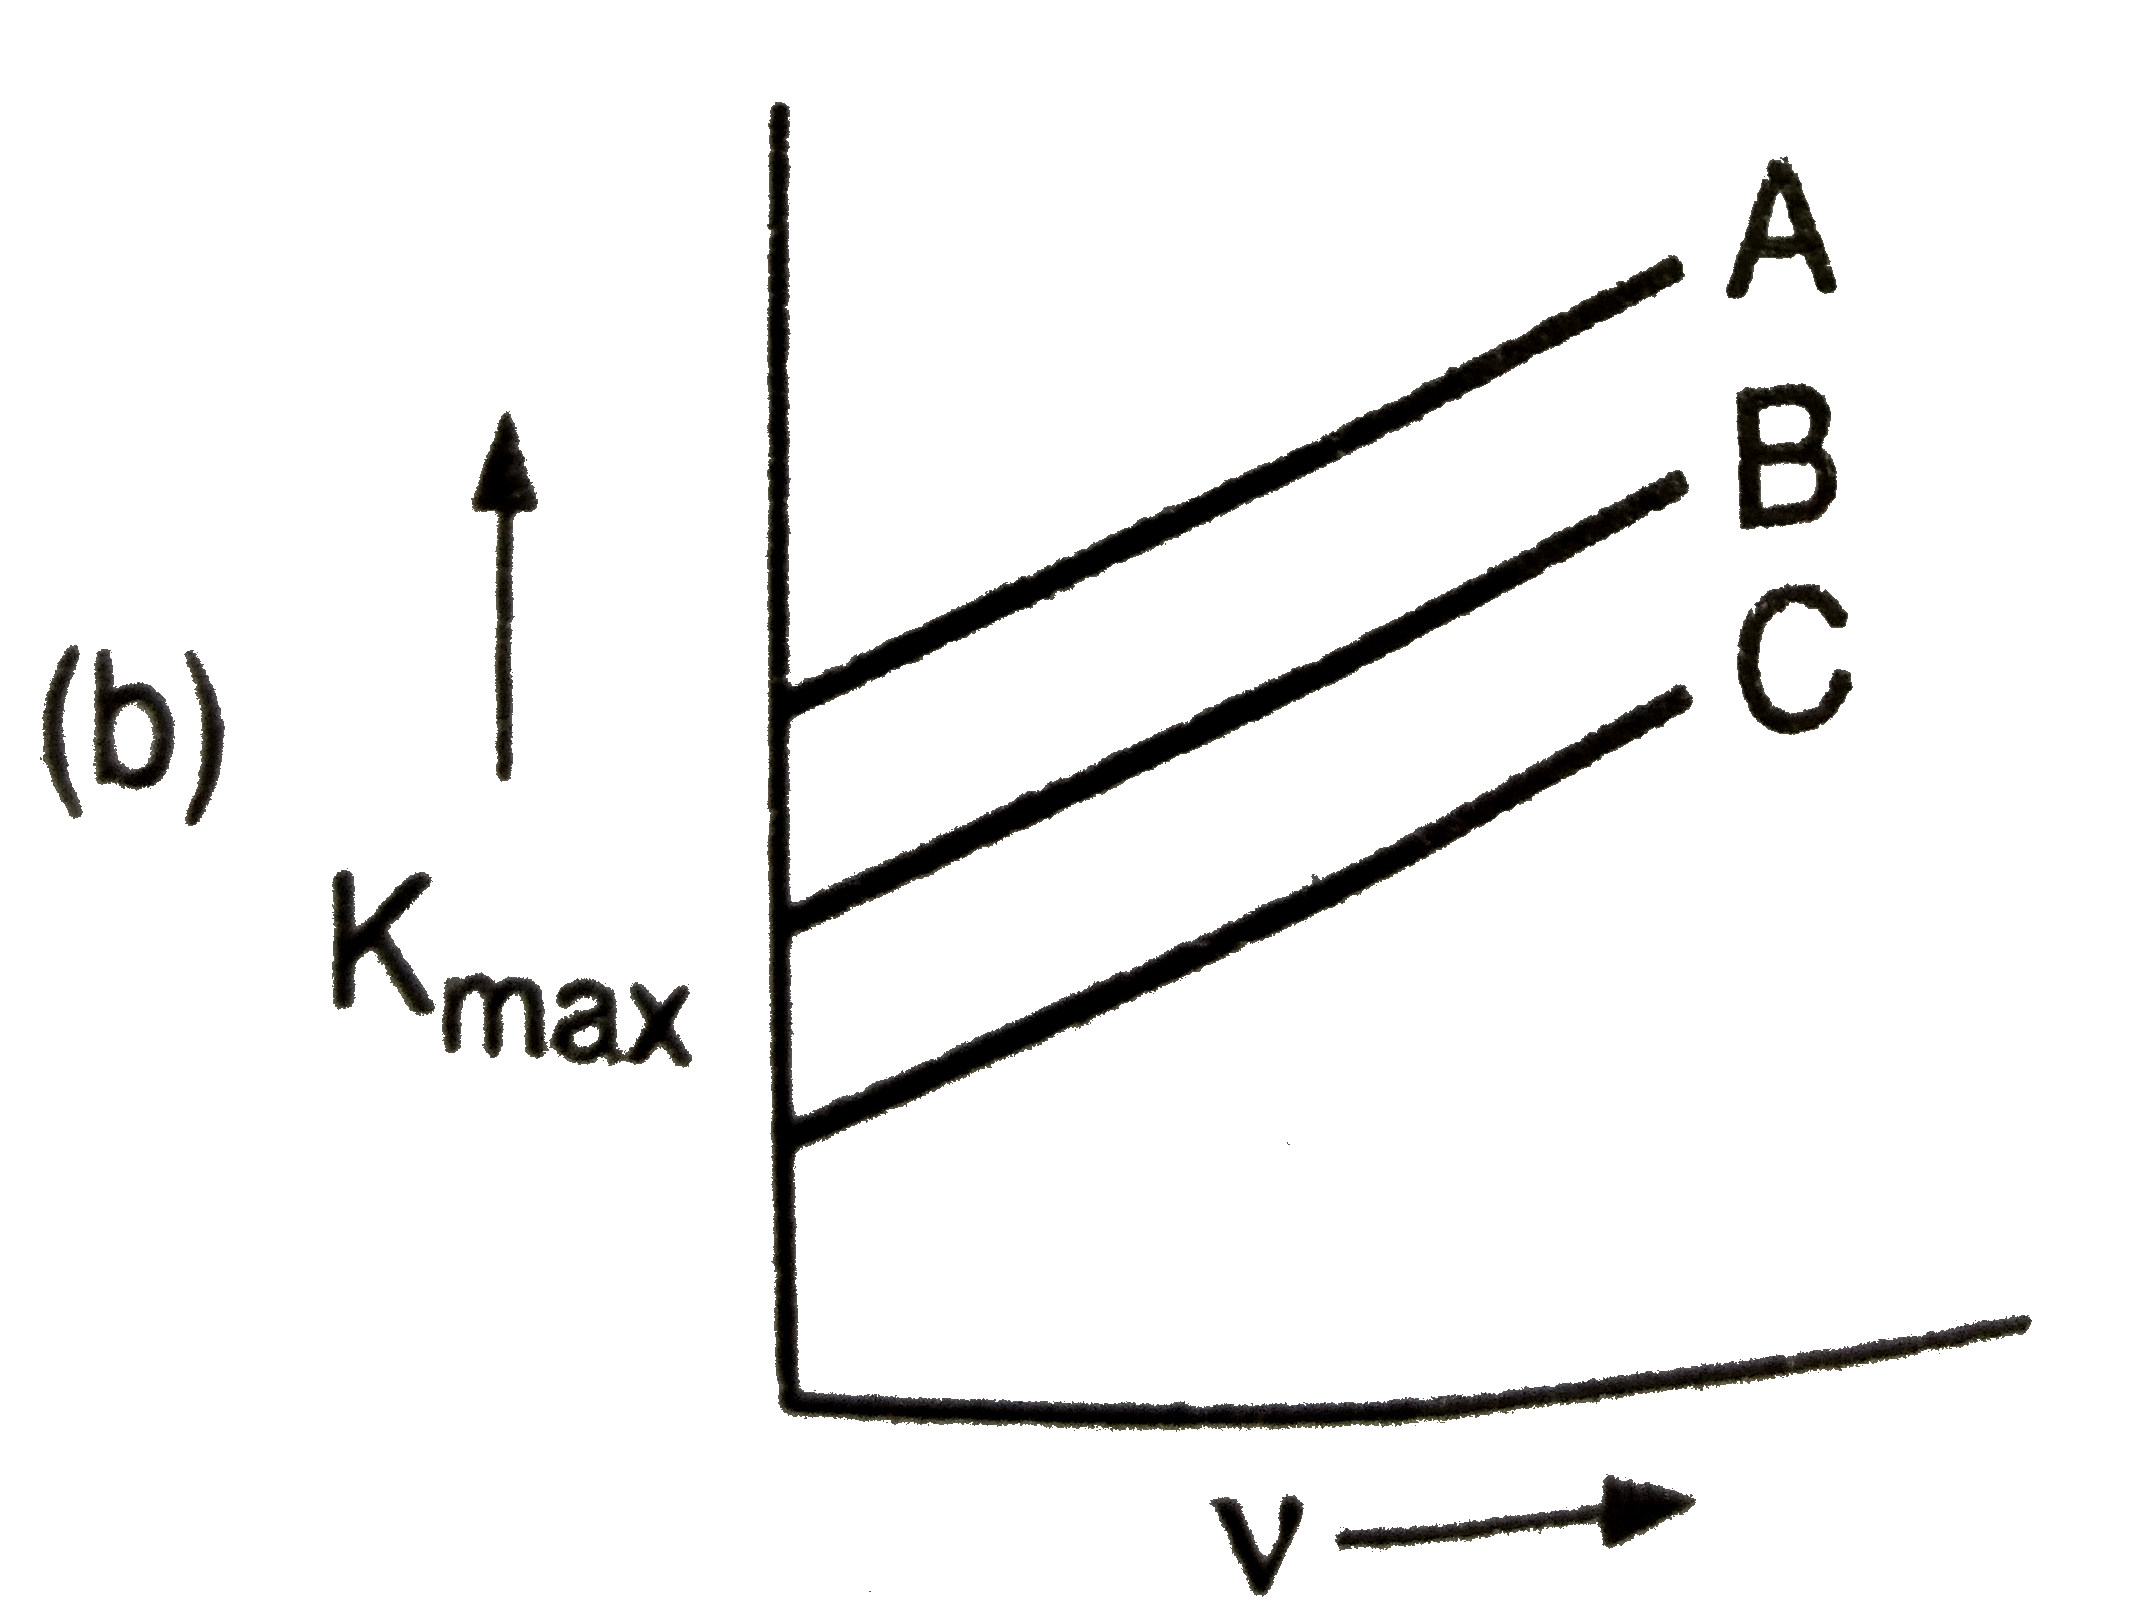
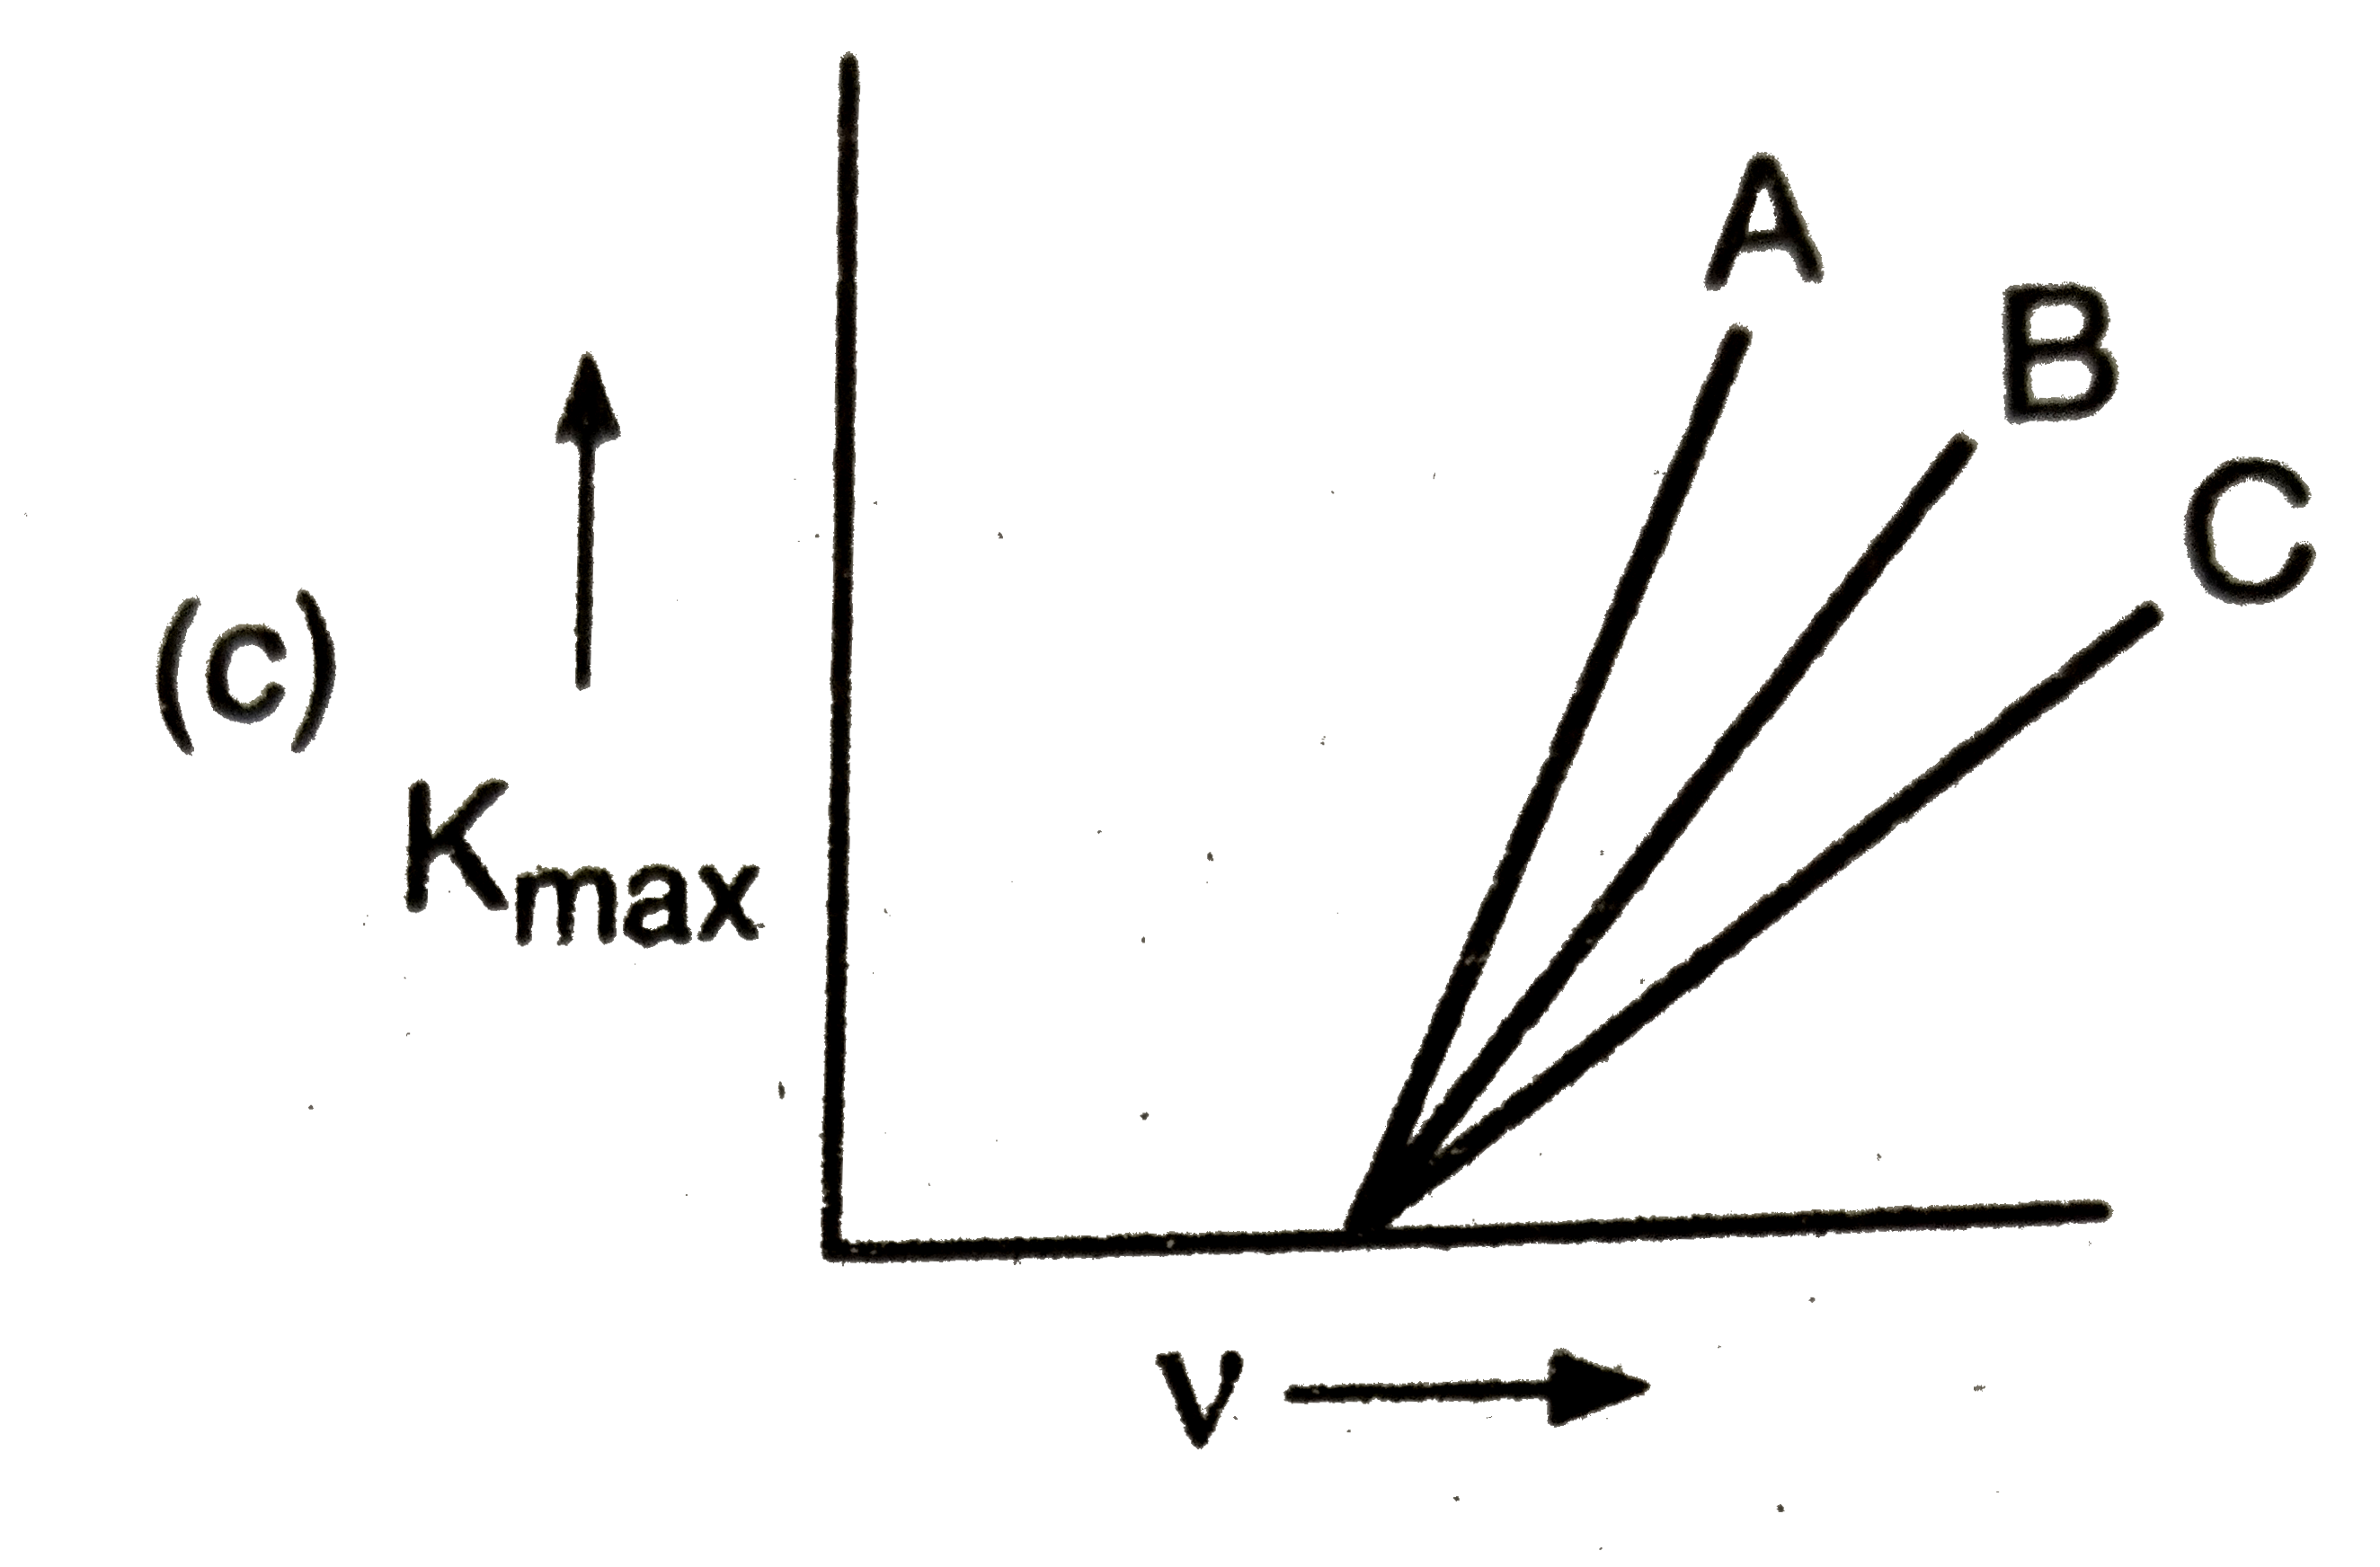
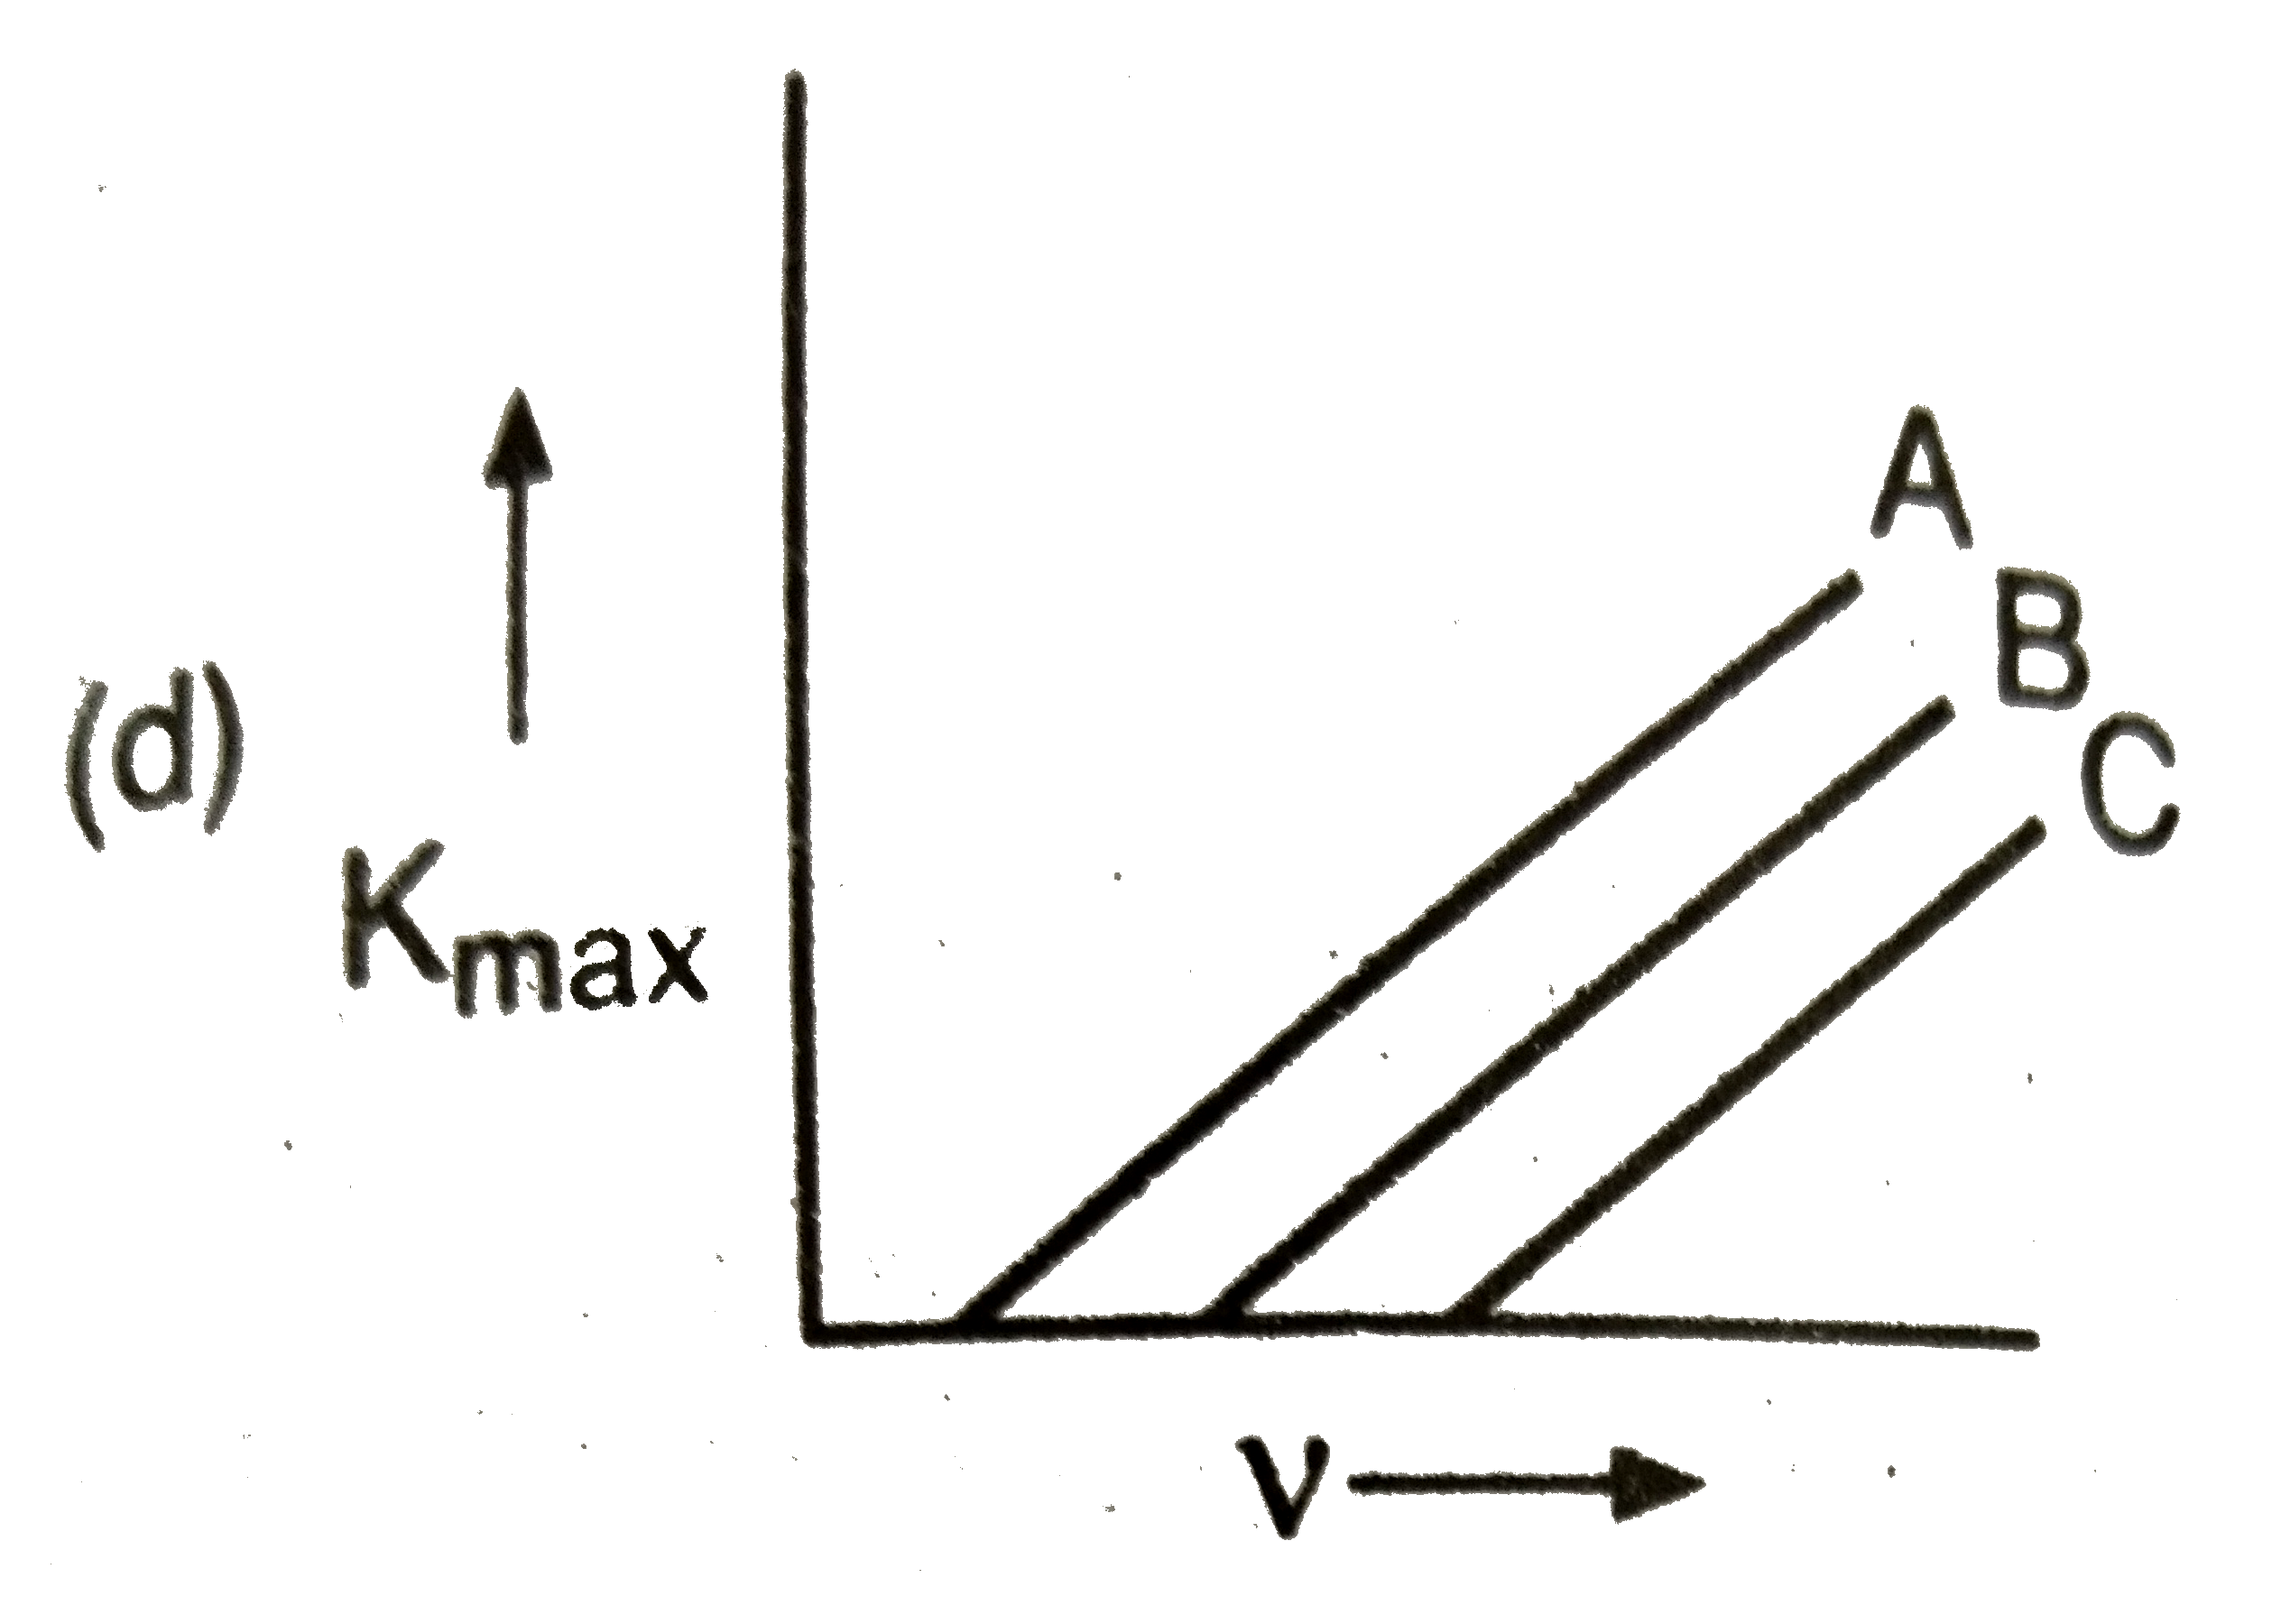
The correct Answer is:D
Topper's Solved these Questions
- ATOMIC STRUCTURE BOOK - OP TANDONCHAPTER - ATOMIC STRUCTURE EXERCISE - Objective Question Level-B
51 Videos
- ATOMIC STRUCTURE BOOK - OP TANDONCHAPTER - ATOMIC STRUCTURE EXERCISE - Assertion Reason
22 Videos
- ATOMIC STRUCTURE BOOK - OP TANDONCHAPTER - ATOMIC STRUCTURE EXERCISE - Questions with single correct Answer
203 Videos
- AROMATIC HYDROCARBONS (ARENES)BOOK - OP TANDONCHAPTER - AROMATIC HYDROCARBONS (ARENES)EXERCISE - EXAMPLES
24 Videos
- CHARACTERISATION OF ORGANIC COMPOUNDS BOOK - OP TANDONCHAPTER - CHARACTERISATION OF ORGANIC COMPOUNDS EXERCISE - Passage-2
5 Videos
Similar Questions
In an experiment of photo-electric effect, the graph of maximum kinetic energy Ek of the emitted photoelectrons versus the frequency v of the incident light is a straight line AB as shown in figure below :
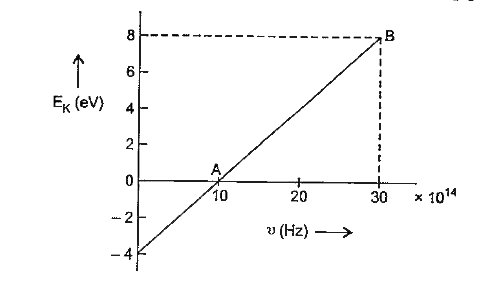
Threshold frequency of the metal.
View Solution(i) Plot a labelled graph of |Vs| where Vs is stopping potential versus frequency f of the incident radiation.
(ii) State how will you use this graph to determine the value of Planck.s constant.
View Solution
Knowledge Check
For three different metals A , B and C , photoemission is observed one by one and Ek V/s v is plotted . Which one of the following represent this curve correctly ?
A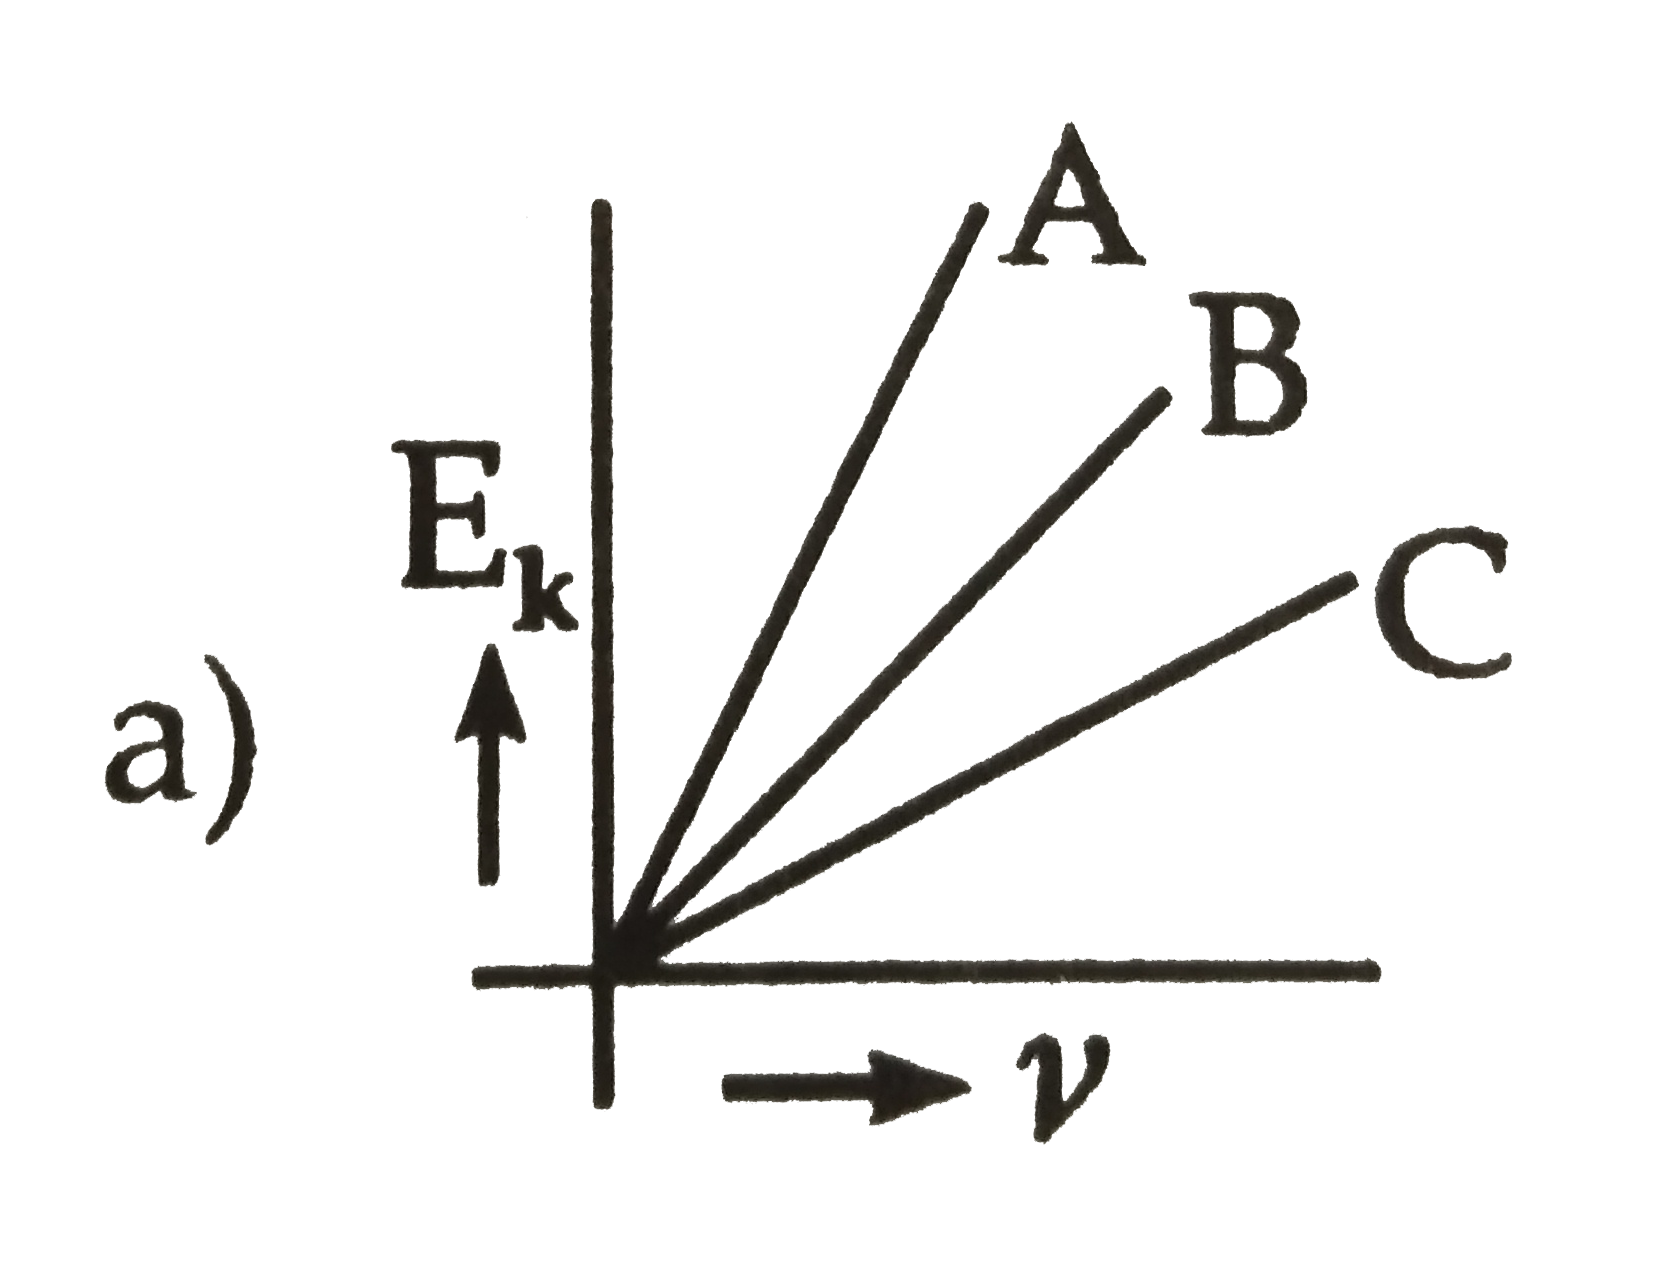 B
B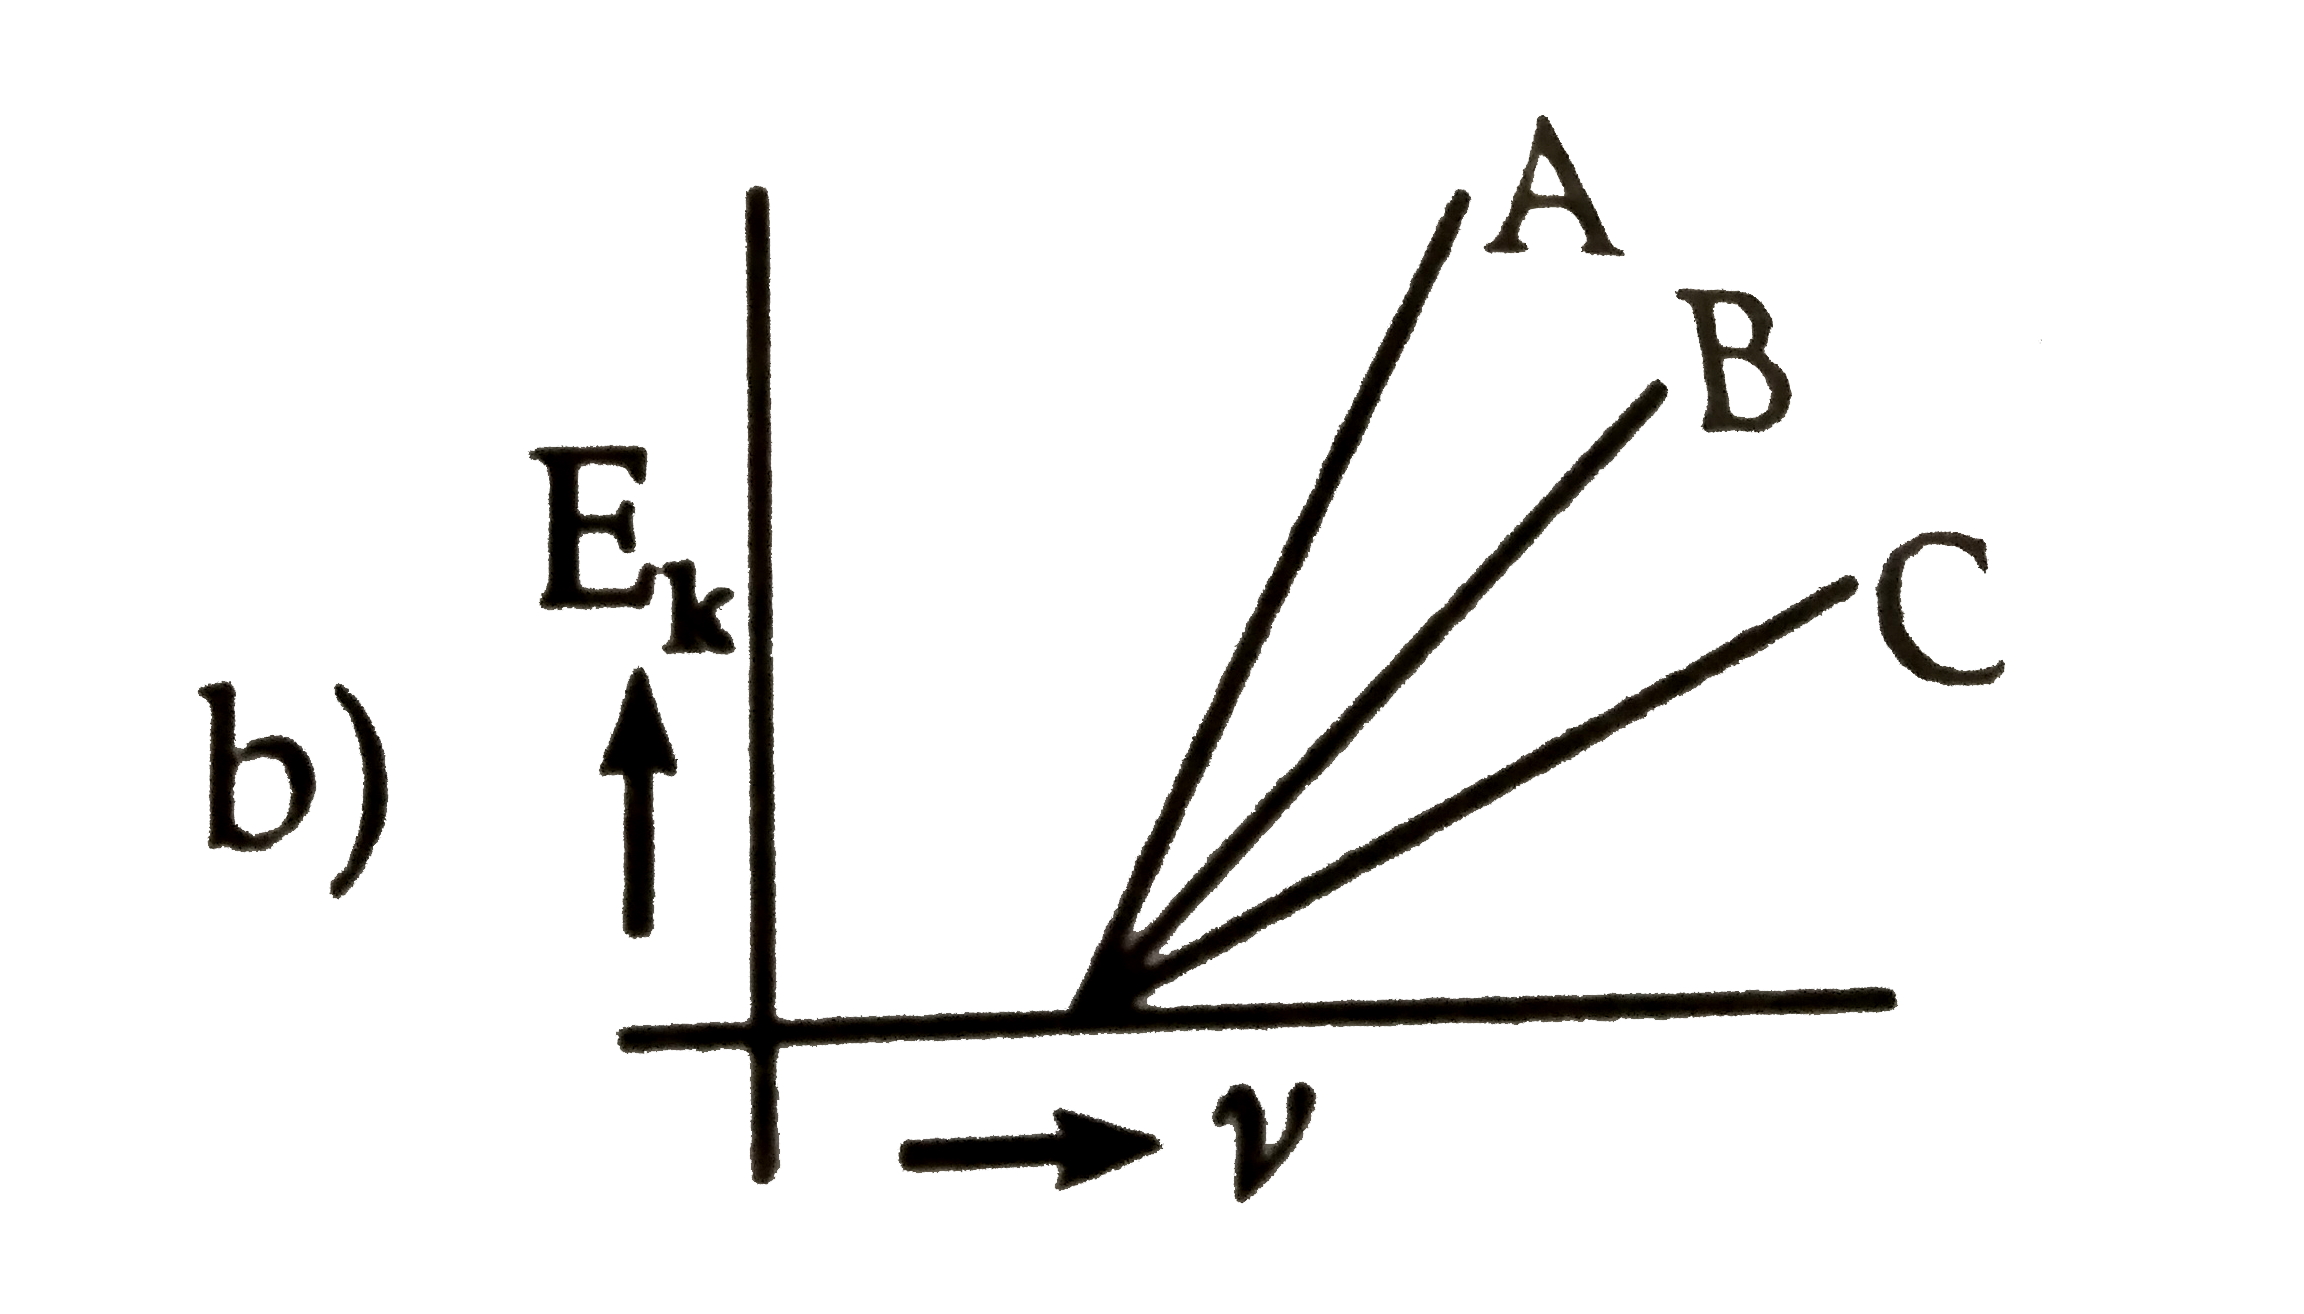 C
C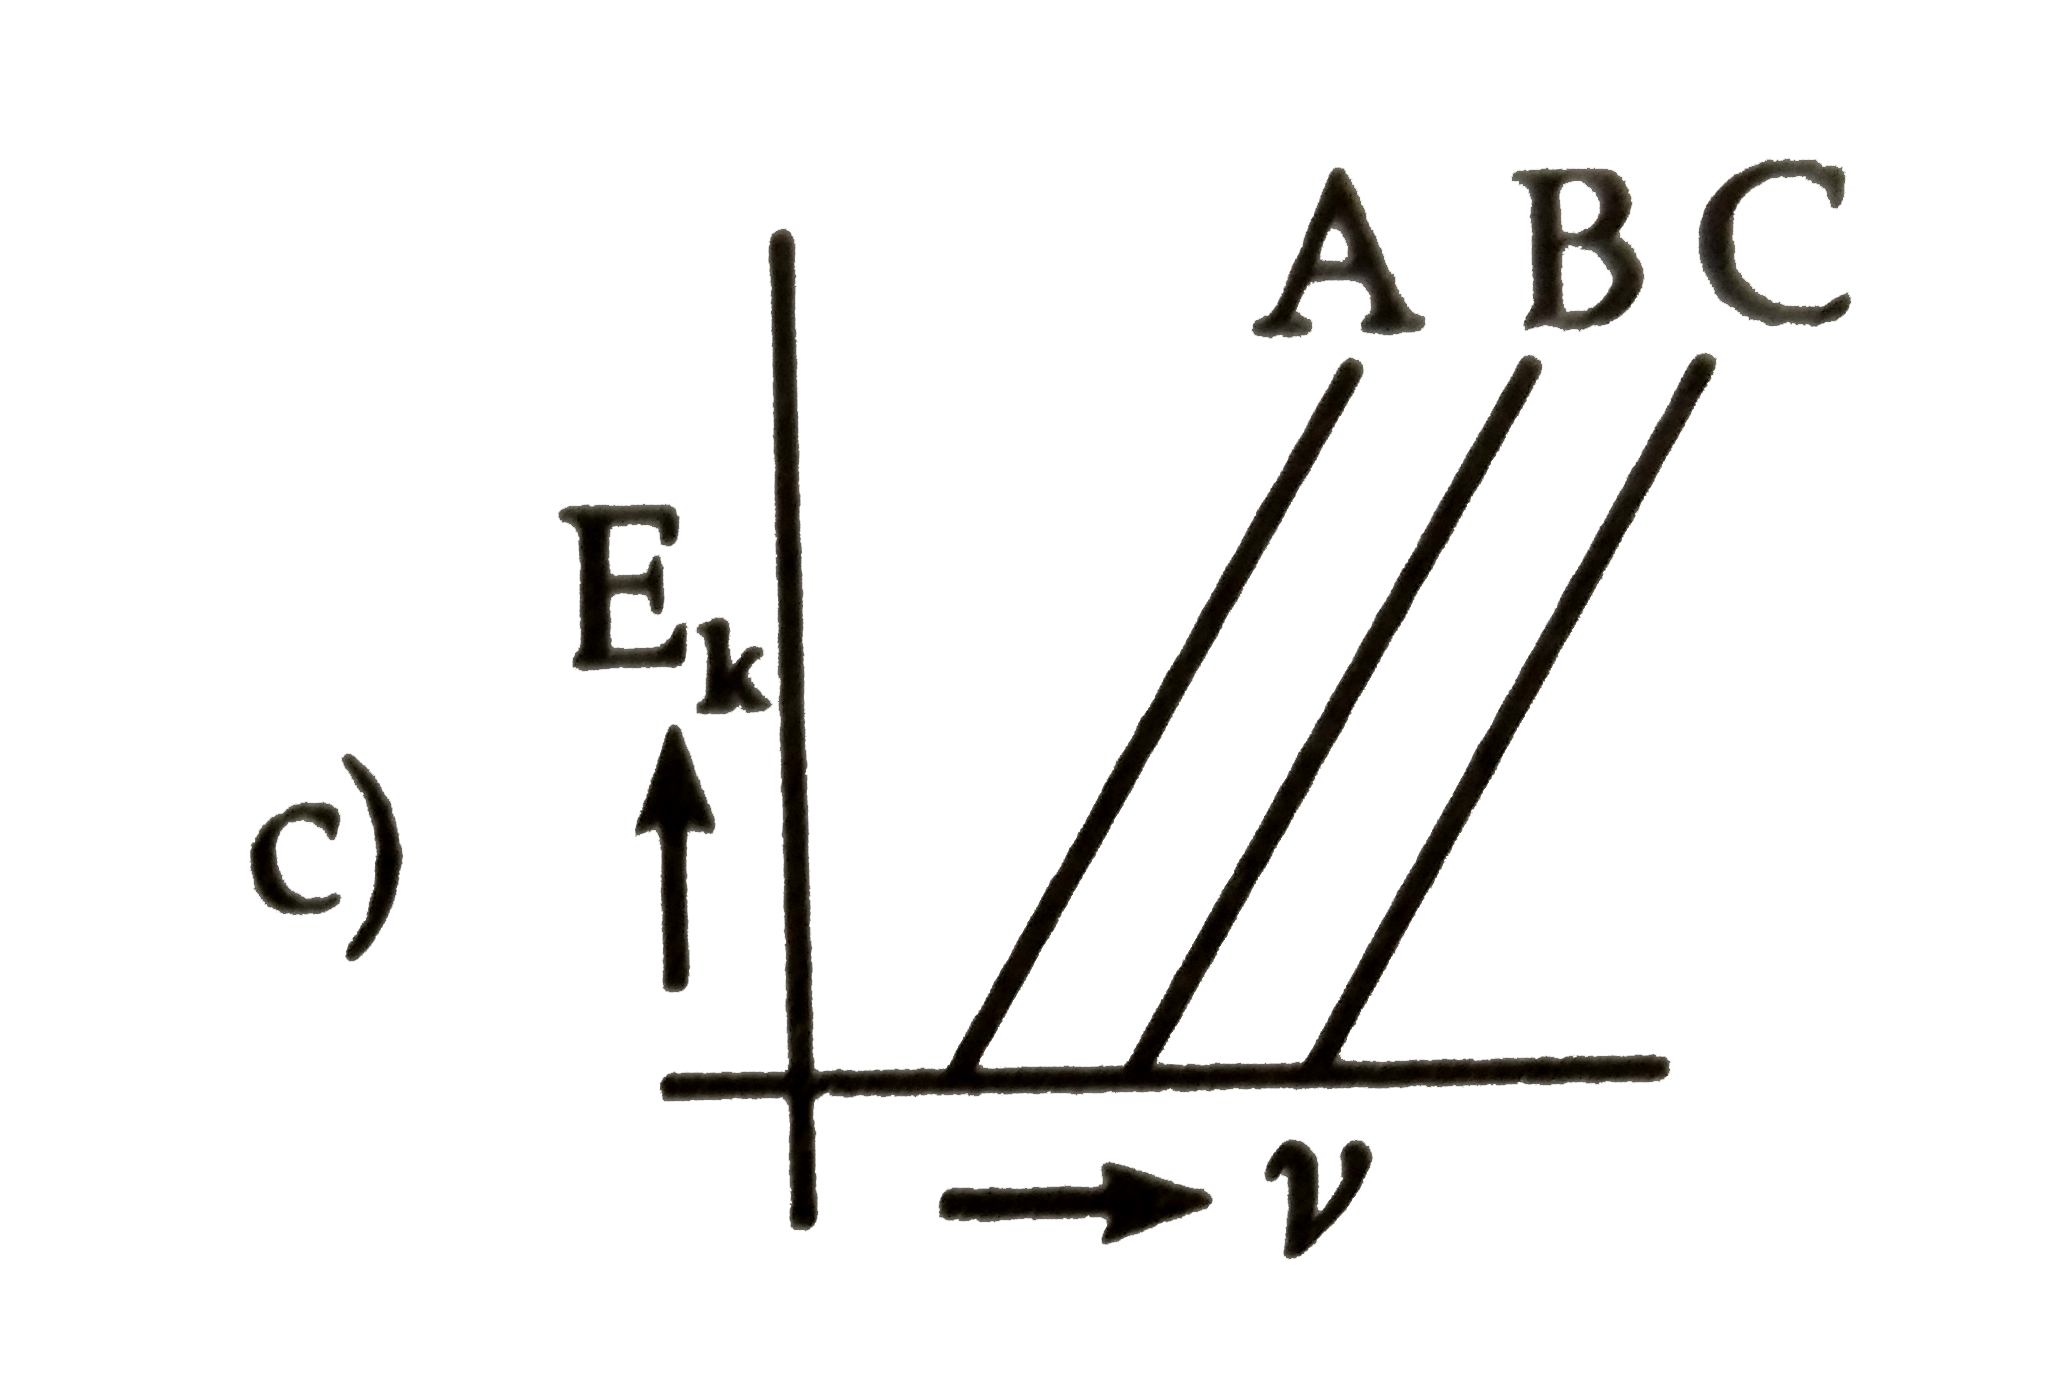 D
D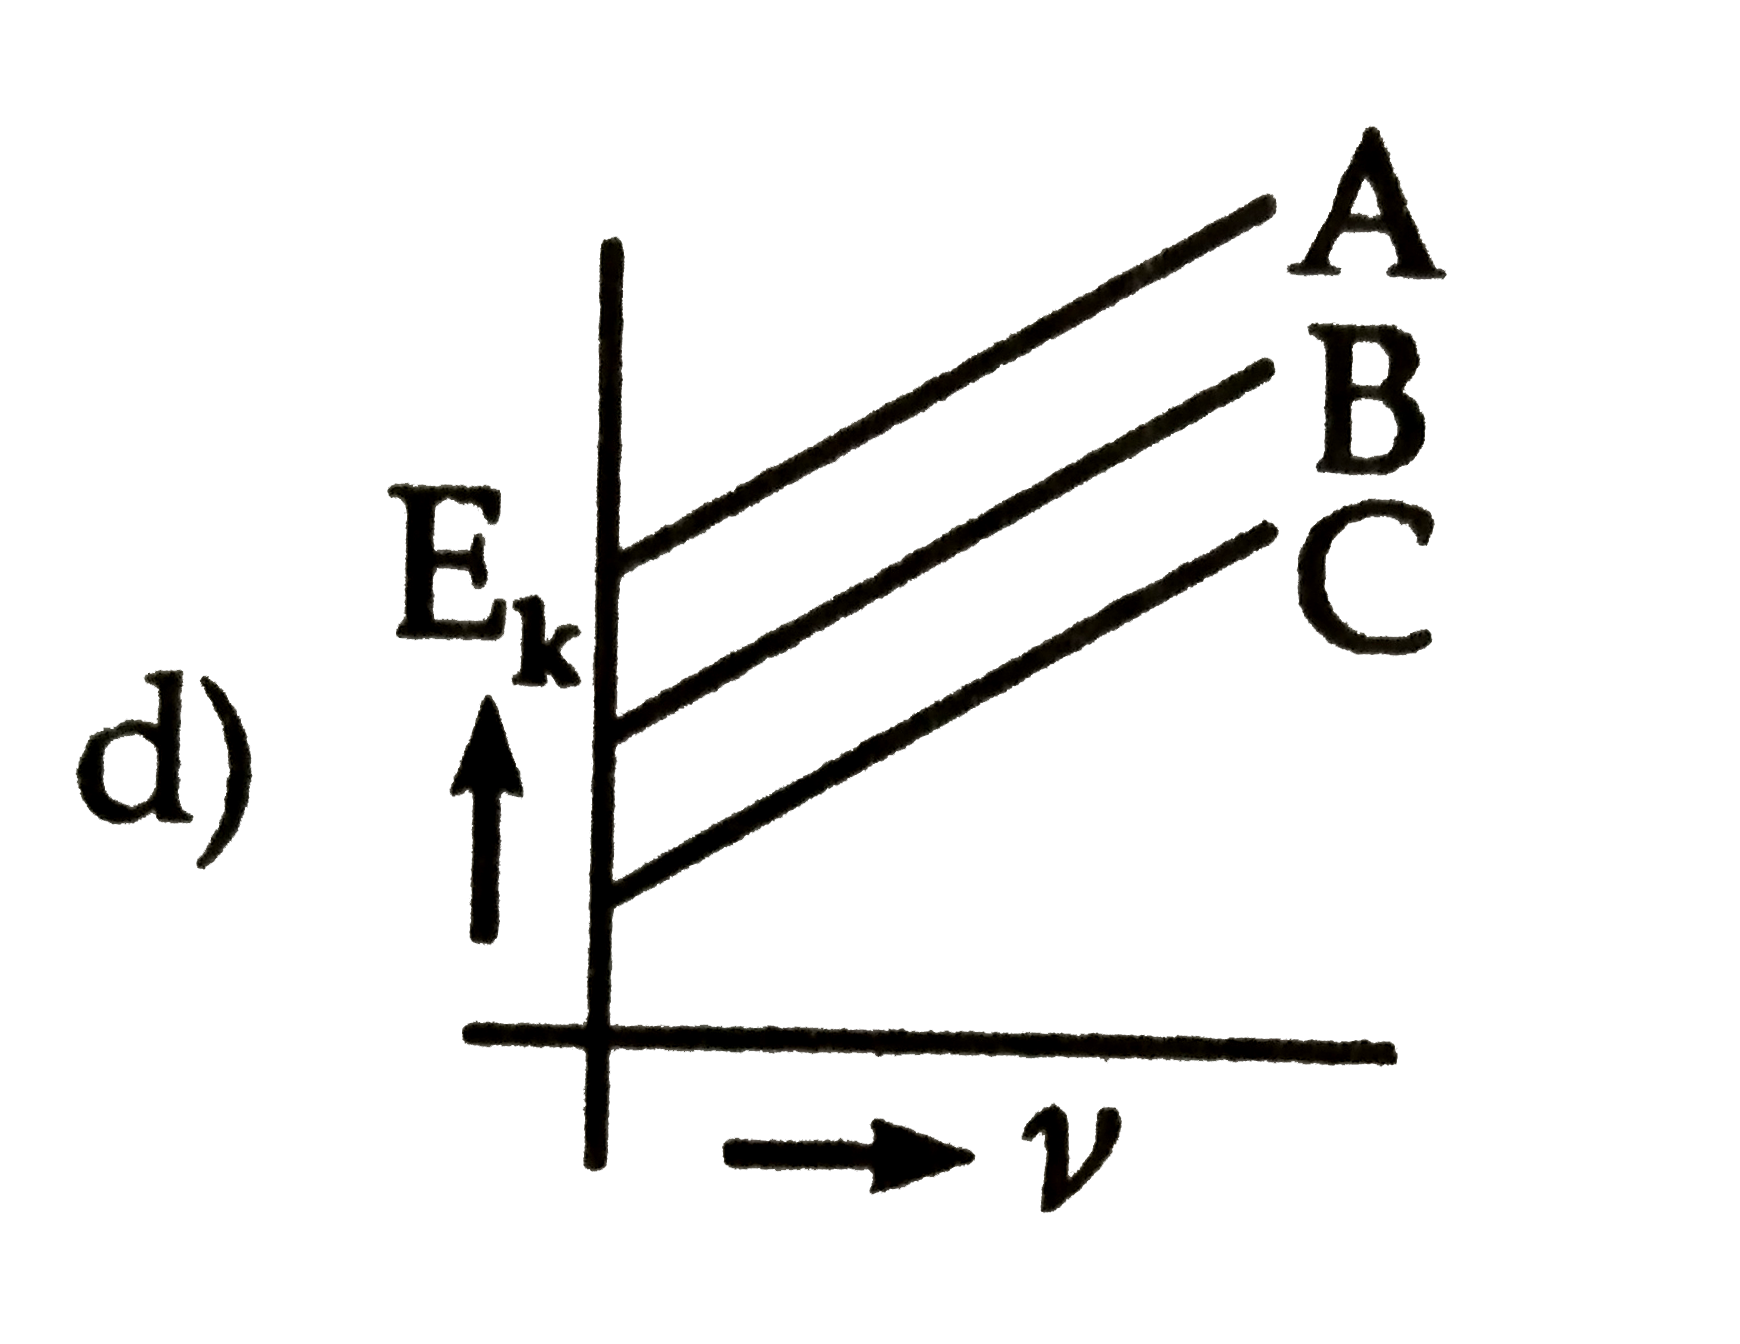
According to Einstein's photoelectric equation, the plot of the maximum kinetic energy of the emitted photoelectrons from a metal versus frequency of the incident radiation gives a straight line whose slope
Adepends on the nature of metal usedBdepends on the intensity or radiationCdepends on both intensity of radiation and the nature of metal usedDis the same for all metals and independent of the instensity or radiationAccording to Einstein's photoelectric equation, the plot of the maximum kinetic energy of the emitted photoelectrons from a metal versus frequency of the incident radiation gives a straight line whose slope
Adepends on the intensity of incident radiation.Bdepends on the nature of the metal and also on the intensity of incident radiation.Cis same for all metals and independent of the intensity of the incident radiation.Ddepends on the nature of the metal.
In an experiment of photo-electric effect, the graph of maximum kinetic energy Ek of the emitted photoelectrons versus the frequency v of the incident light is a straight line AB as shown in figure below :
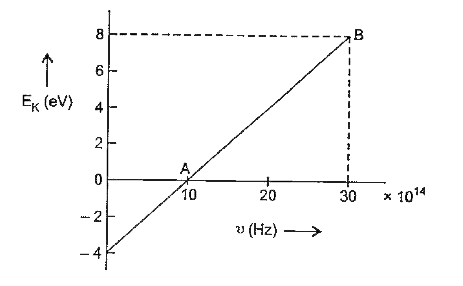
Work function of the metal.
View SolutionWhy photoelectrons ejected from a metal surface have different kinetic energies although the frequency of incident photons are same ?
View SolutionAccording to Einstein's photoelectric equation, the graph between kinetic energy of photoelectrons ejected and the frequency of the incident radiation is :
View SolutionAccording to Einstein's photoelectric equation, the graph between kinetic energy of photoelectrons ejected and the frequency of the incident radiation is :
View SolutionAccording to Einstein's photoelectric equation, the graph between the kinetic energy of photoelectrons ejected and the frequency of incident radiation is
View Solution
