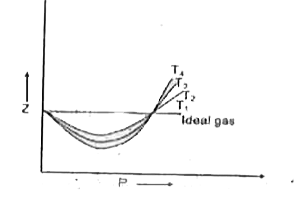
If the graph is plotted for 1 mole gas in such a way that PV is plotted against 'P', then intercept of the graph for real gas will be:
RT+Pb+a
RT
RT−Pb+a
RT+Pb+ab+a
The correct Answer is:B
Topper's Solved these Questions
- STATES OF MATTER (GASES AND LIQUIDS)BOOK - OP TANDONCHAPTER - STATES OF MATTER (GASES AND LIQUIDS)EXERCISE - p 6
2 Videos
- SOLUTIONS (GENERAL AND COLLIGATIVE PROPERTIES)BOOK - OP TANDONCHAPTER - SOLUTIONS (GENERAL AND COLLIGATIVE PROPERTIES)EXERCISE - Self Assessment
31 Videos
- STATES OF MATTER (SOLID STATE)BOOK - OP TANDONCHAPTER - STATES OF MATTER (SOLID STATE)EXERCISE - SELF ASSESSMENT Section VI
3 Videos
Similar Questions
Knowledge Check
The graph of PV vs P for a gas is
AparabolicBhyperbolicCa straight line parallel to X-axisDa straight line passing through originCompressibility factor (Z) is plotted against pressure at different temperature for same gas
 AT4>T3>T2>T1BT1>T2>T3>T4CT1>T2>T3>T4DT1>T2>T3>T4
For the adsorption of a gas on a solid, the plot of log (x/m) against log P will have a intercept of
AhBlog KCnD1/n
A graph is plotted for a vanderwaal's gas between PVm vs P leading to an intercept of 22.16 litre-atm. The temperature of gas at which these observations of P and Vm were made is ___________ ∘C
(R=0.08 litre atmK−1mol−1)
View SolutionA graph is plotted for a vanderwaal's gas between PVm vs P leading to an intercept of 22.16 litre-atm. The temperature of gas at which these observations of P and Vm were made is ___________ ∘C
(R=0.08 litre atmK−1mol−1)
View SolutionA graph is plotted with PV/T on y-axis and mass of the gas along x-axis for different gases. The graph is
View SolutionA graph is plotted with PV/T on y-axis and mass of the gas along x-axis for different gases. The graph is
View SolutionIf a graph is plotted between log V and log T for 2 moles of a gas of constant pressure of 0.0821 atm, then which of the following statements are correct?
View Solution
