If a graph is plotted between log V and log T for 2 moles of a gas of constant pressure of 0.0821 atm, then which of the following statements are correct?
The curve is straight line with slope -1.
The curve is straight line with slope +1
The intercept on y-axis is equal to 2.
The intercept on y-axis is equal to 0.3010.
PV=nRT
logV=logT+lognRP
slope =1
intercept =lognRP=log[2×0.08210.0821]=0.3010
Topper's Solved these Questions
- STATES OF MATTER (SOLIDS, LIQUIDS AND GASES)BOOK - MTG-WBJEECHAPTER - STATES OF MATTER (SOLIDS, LIQUIDS AND GASES)EXERCISE - WB JEE Previous Years Questions (Category 1: Single Option Correct Type)
14 Videos
- STATES OF MATTER (SOLIDS, LIQUIDS AND GASES)BOOK - MTG-WBJEECHAPTER - STATES OF MATTER (SOLIDS, LIQUIDS AND GASES)EXERCISE - WB JEE Previous Years Questions (Category 2: Single Option Correct Type)
3 Videos
- STATES OF MATTER (SOLIDS, LIQUIDS AND GASES)BOOK - MTG-WBJEECHAPTER - STATES OF MATTER (SOLIDS, LIQUIDS AND GASES)EXERCISE - WBJEE/WORKOUT (Category 2: Single Option Correct Type)
15 Videos
- REDOX EQUILIBRIABOOK - MTG-WBJEECHAPTER - REDOX EQUILIBRIAEXERCISE - WB JEE PREVIOUS YEARS QUESTIONS
5 Videos
- SURFACE CHEMISTRYBOOK - MTG-WBJEECHAPTER - SURFACE CHEMISTRYEXERCISE - WB JEE PREVIOUS YEARS QUESTIONS
3 Videos
Similar Questions
A graph is plotted between logV and logT for 2mol of gas at constant pressure of 0.0821atm. V and T are in litre and K. Which of the following statements are not correct?
(I) The curve is straight line with slope −1.
(II) The curve is straight line with slope +1.
(III) The intercepet on Y−axis is equal to 2.
(IV) The intercepet on Y−axis is equal to 0.3010.
View SolutionA graph is plotted between log (x/m) and log p according to the equation xmkp1/n
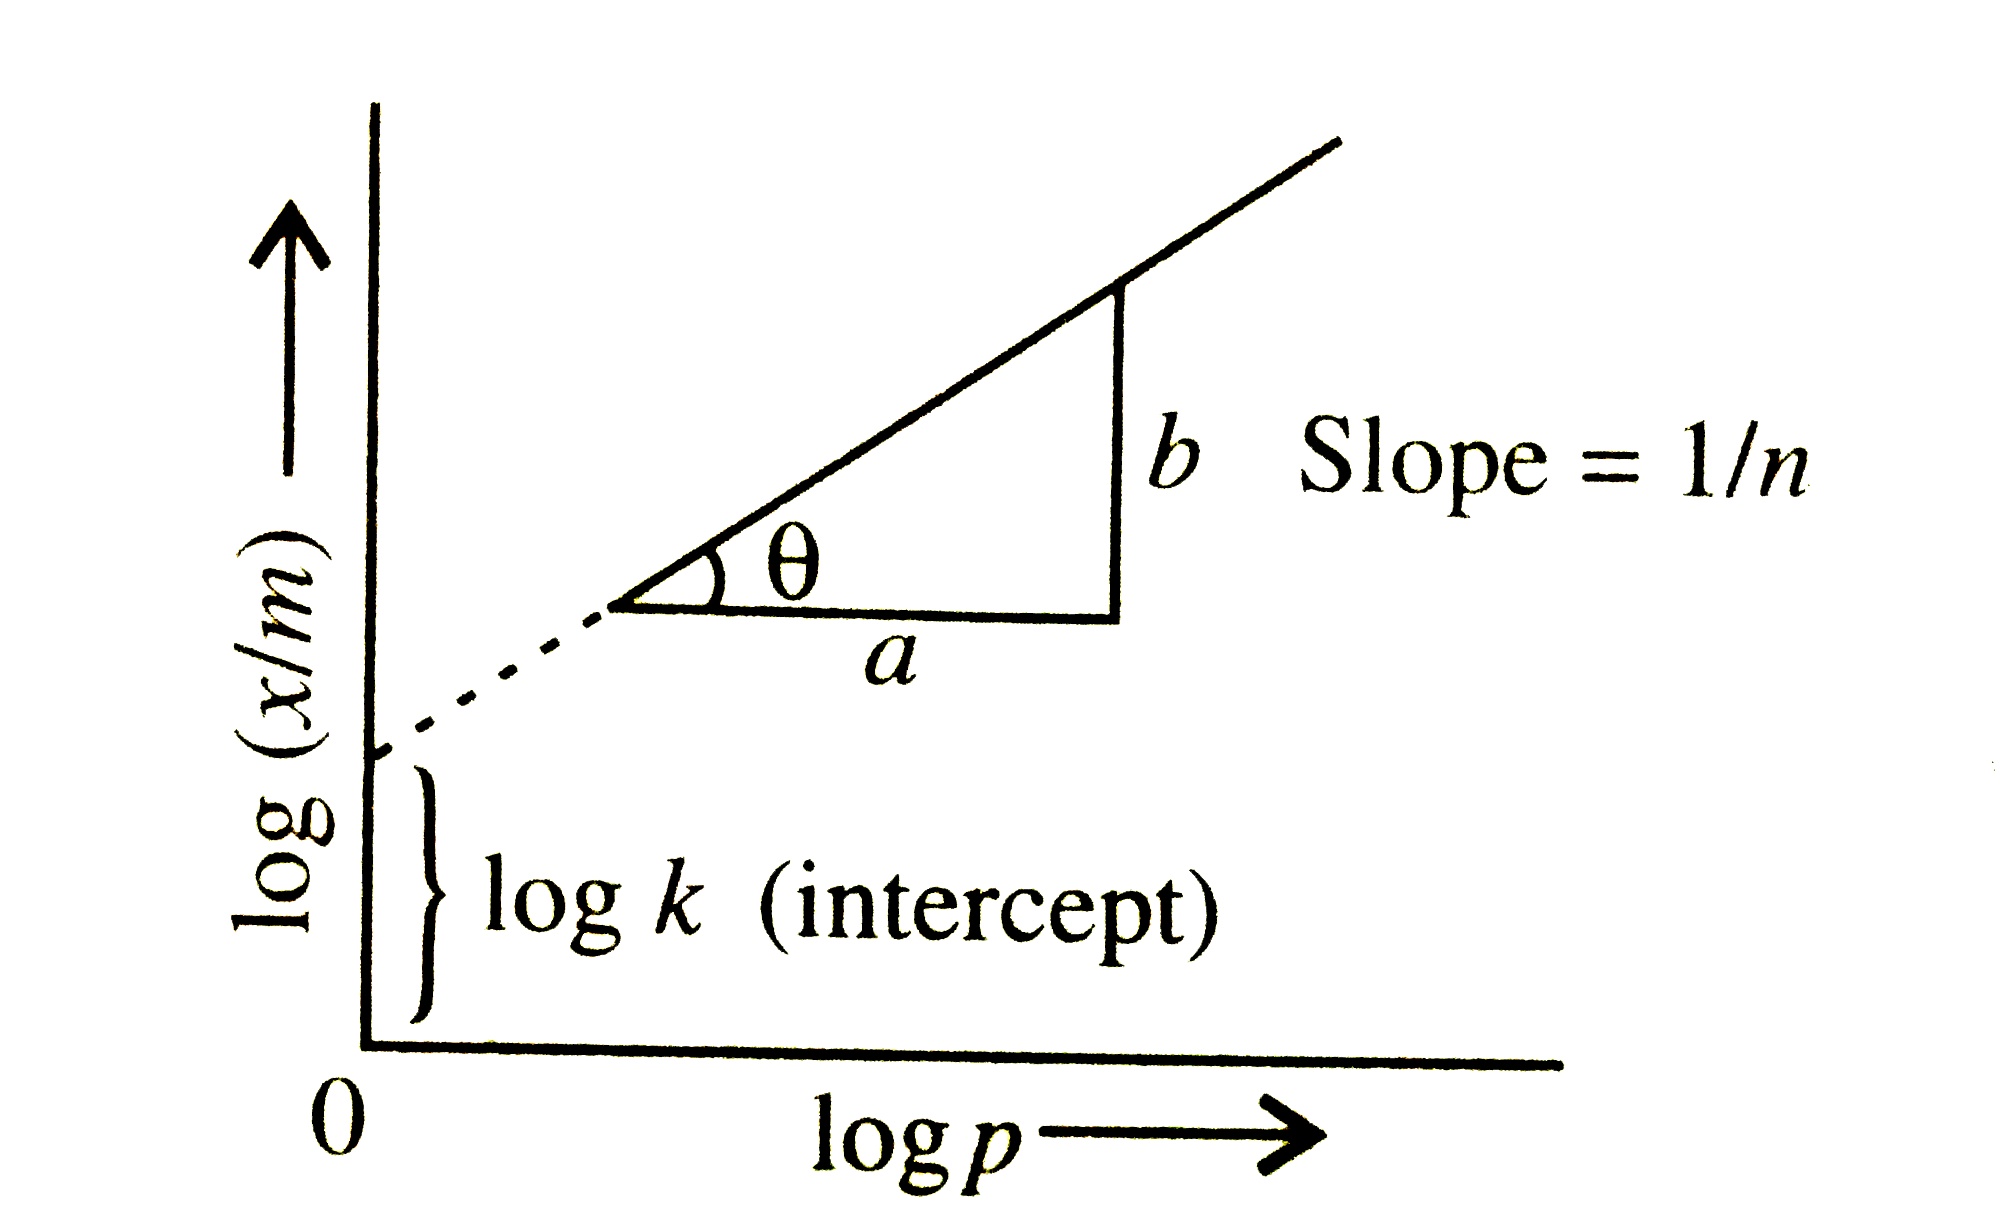
Which is the following statements about his graph is not correct ?
View Solution
Knowledge Check
A graph is plotted between logV and logT for 2mol of gas at constant pressure of 0.0821atm. V and T are in litre and K. Which of the following statements are not correct?
(I) The curve is straight line with slope −1.
(II) The curve is straight line with slope +1.
(III) The intercepet on Y−axis is equal to 2.
(IV) The intercepet on Y−axis is equal to 0.3010.AI, IIBIII, IVCII,IVDI, IIIA graph plotted between log k vs 1T is represented by
A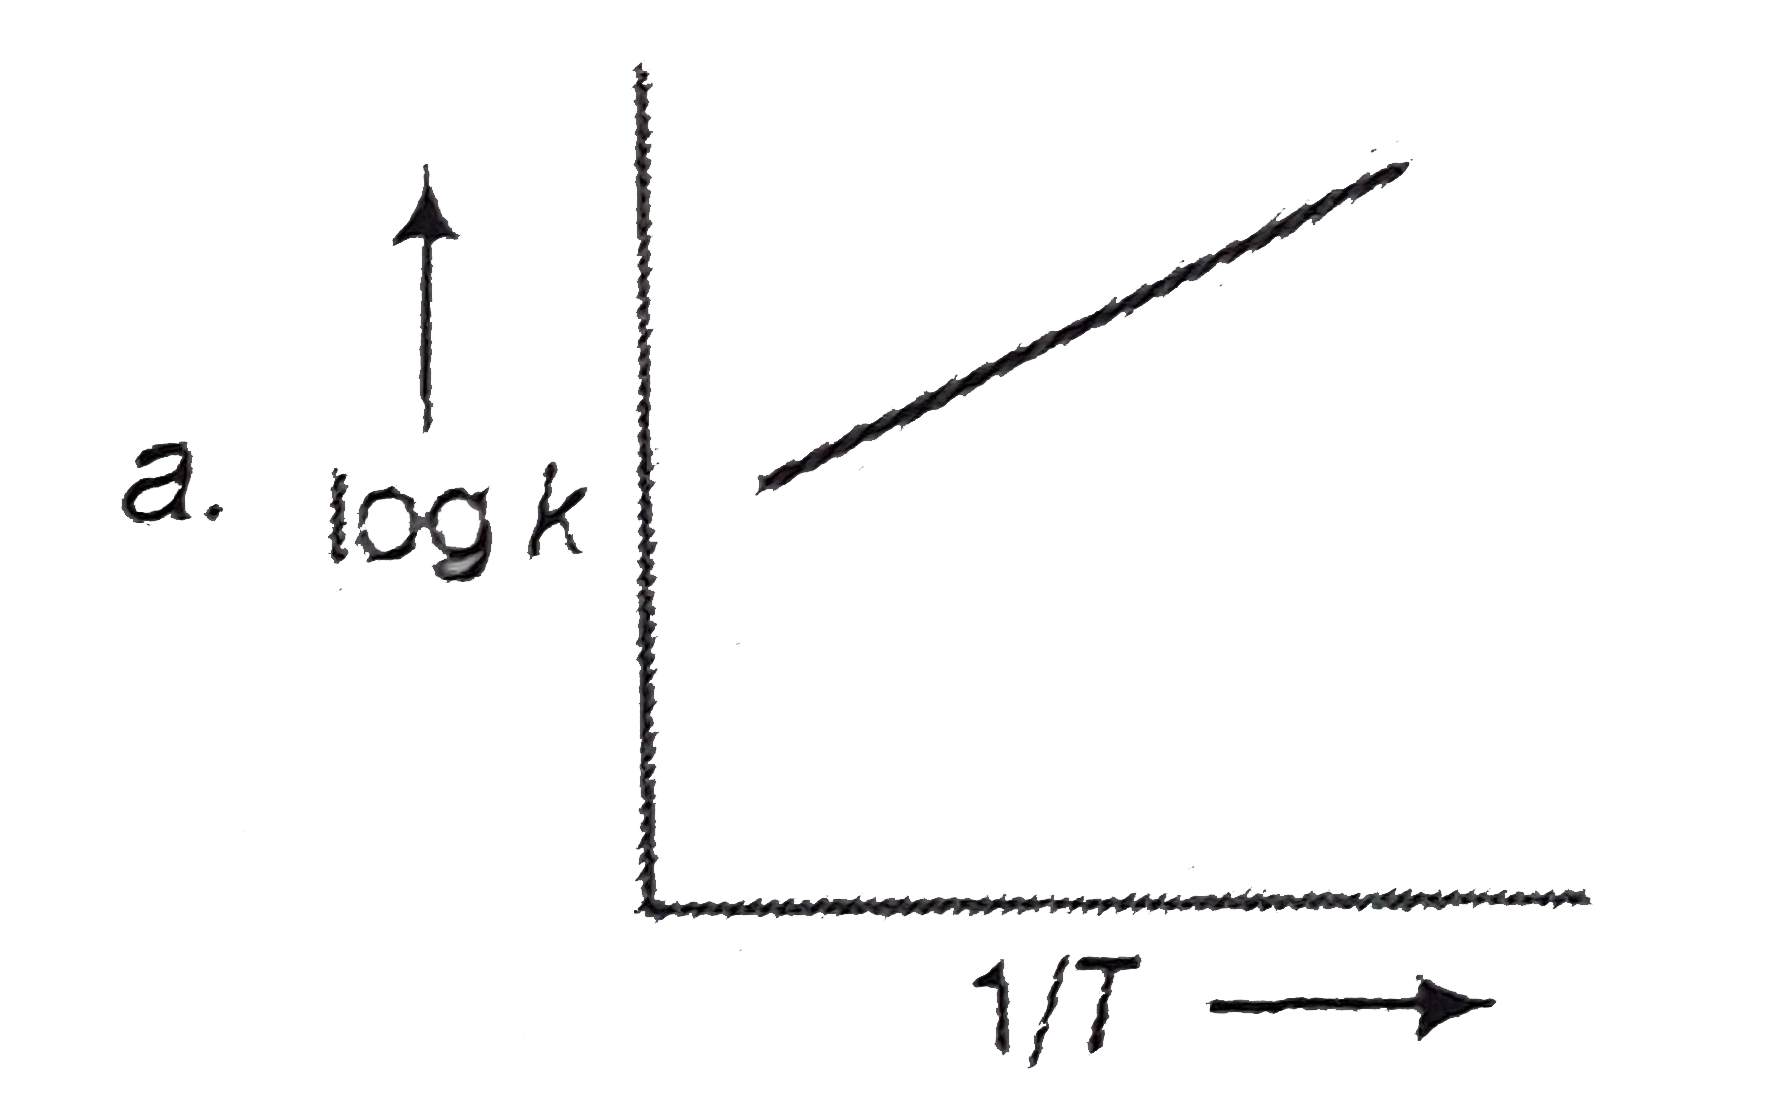 B
B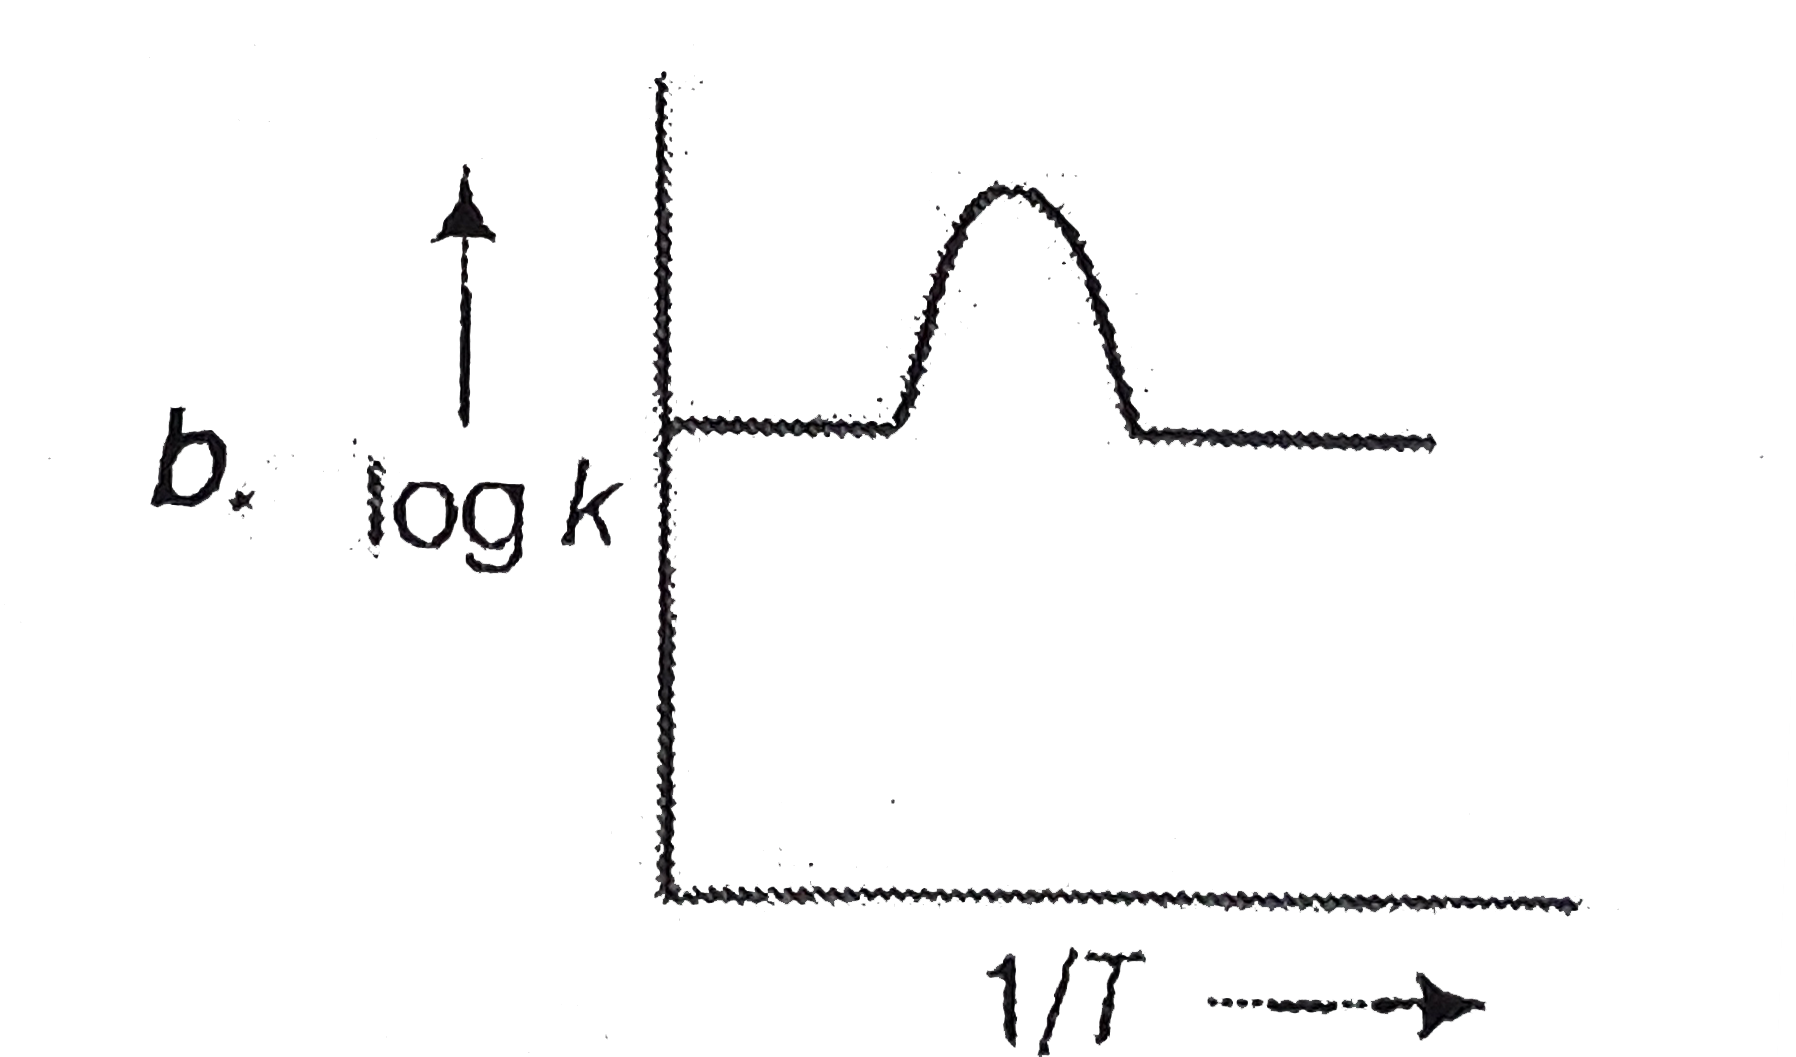 C
C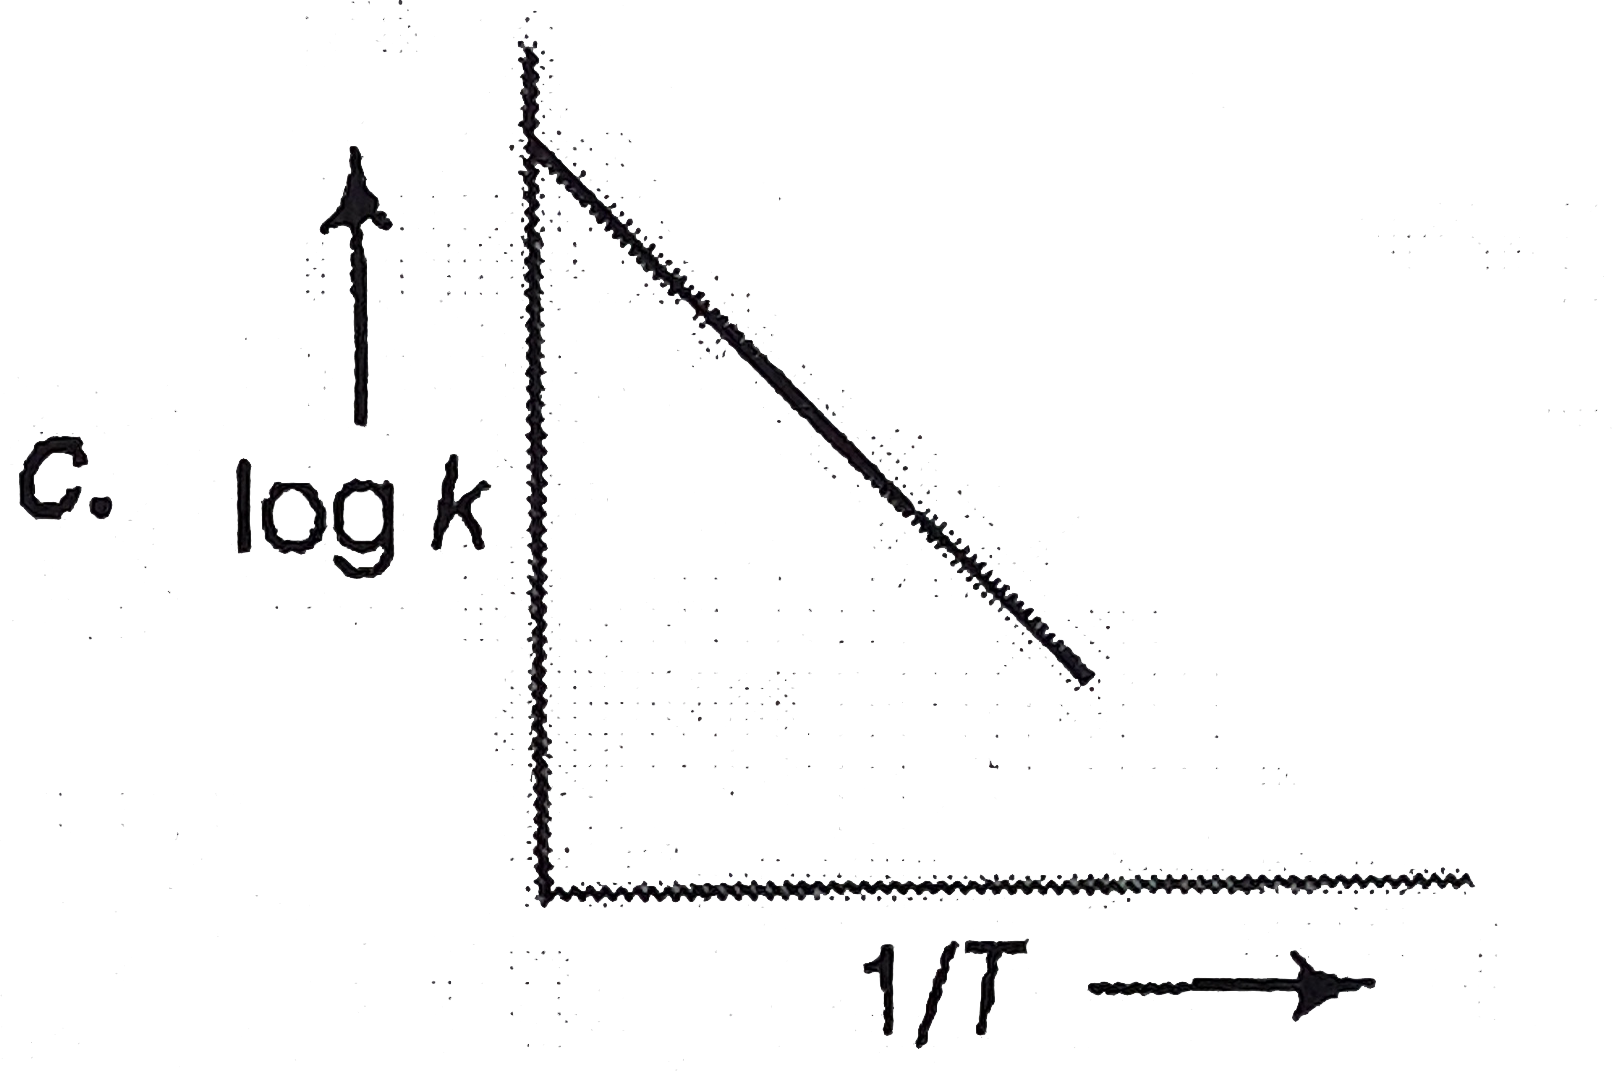 D
D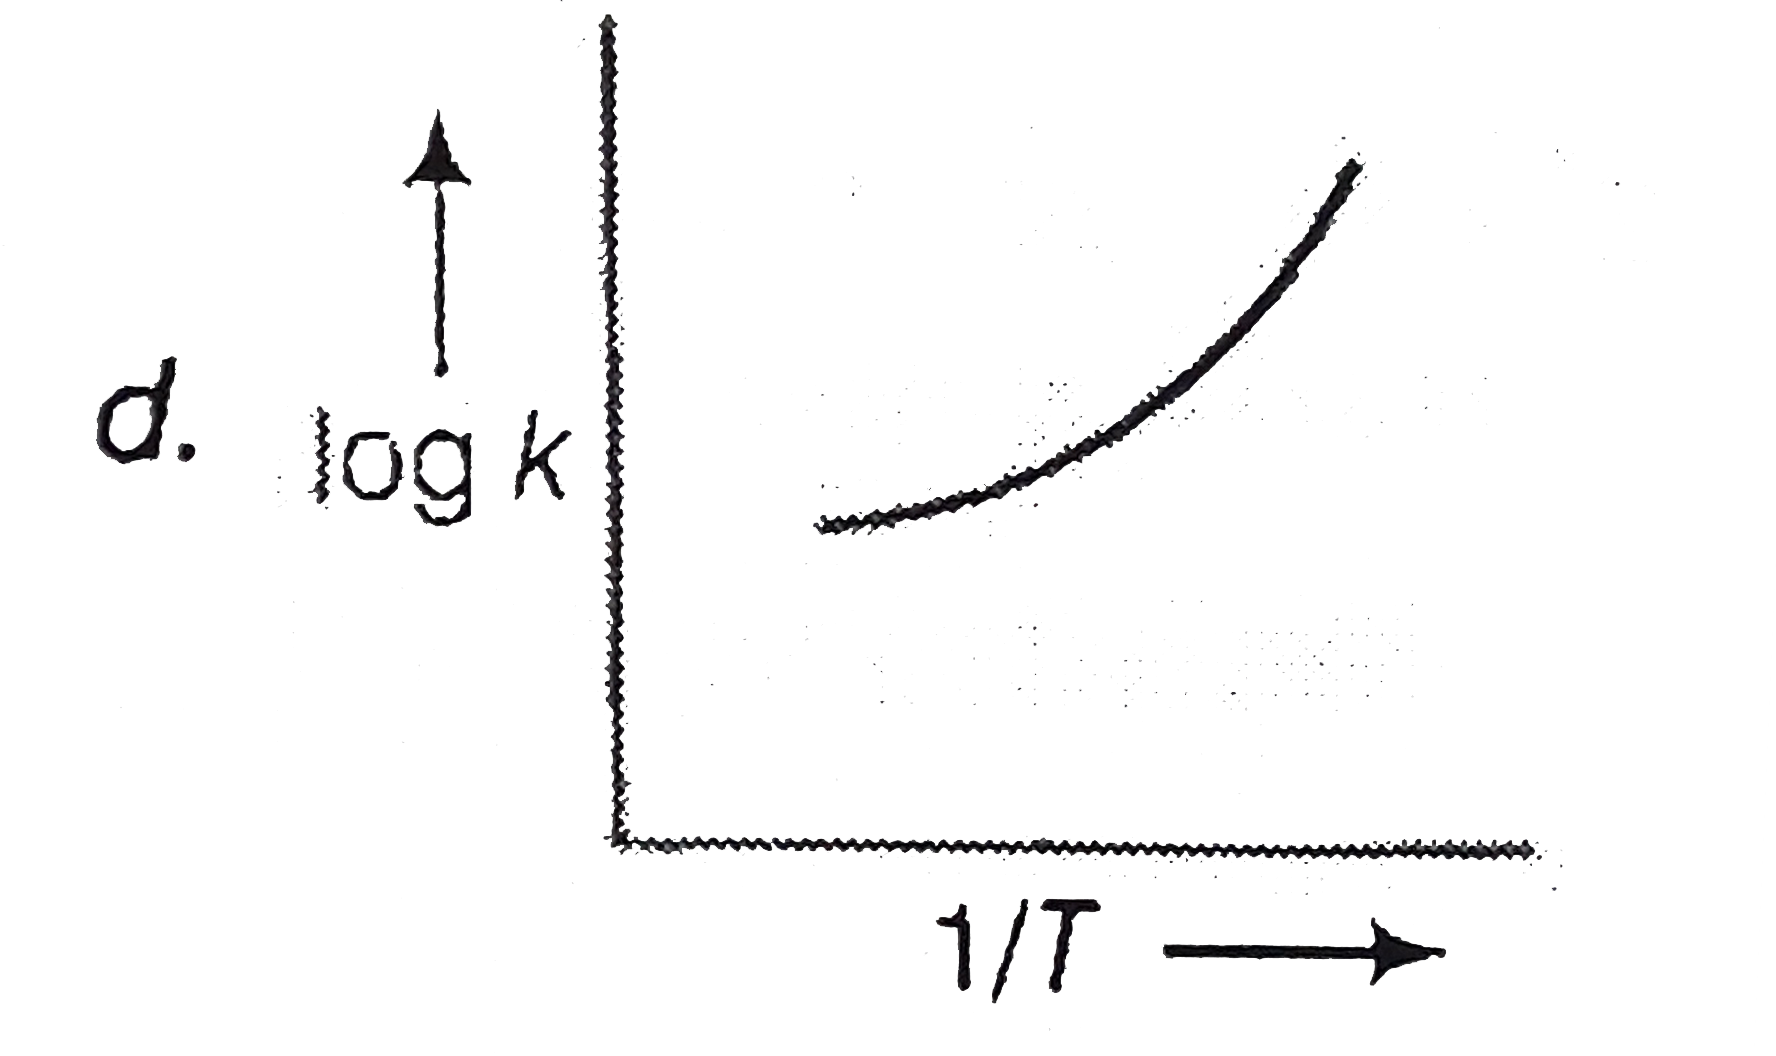
Draw a graph of logP and log(1/V) for a fixed amount of gas at constant temperature.
View SolutionDraw a graph of logP and log(1/V) for a fixed amount of gas at constant temperature.
View SolutionDraw a graph of log P vs log (1/V) for a fixed amount of a gas at constant temperature.
View SolutionDraw a graph of log P vs log (1/V) for a fixed amount of a gas at constant temperature.
View SolutionA graph is plotted between log(x/m) and log P according to the equation xm=kP1n
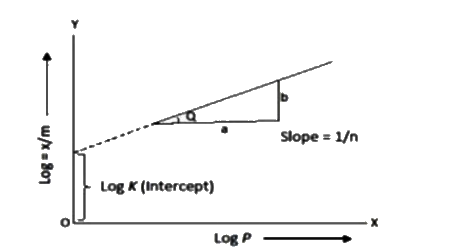
Which of the following statements about this graph is not correct?
View SolutionWhat is the type of graph that would result between log(V) and log(T) at constant pressure?
View Solution
