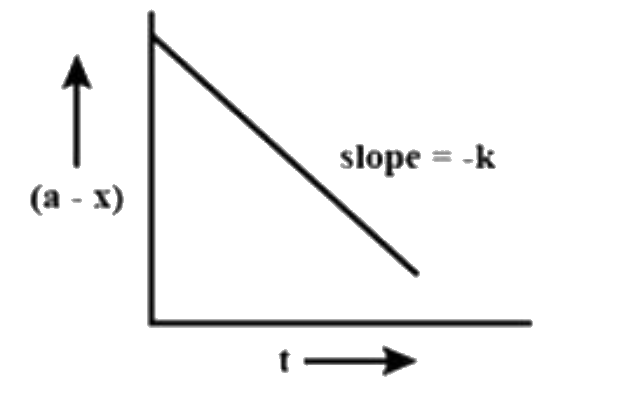
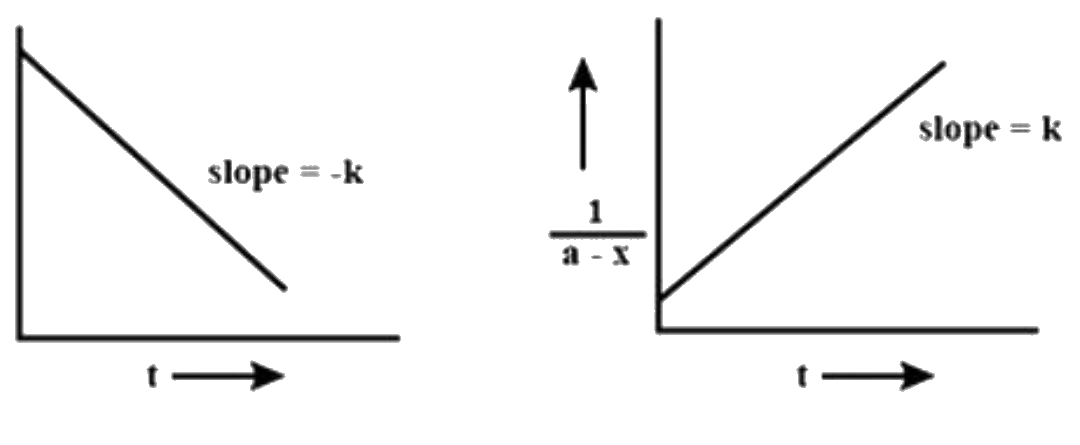
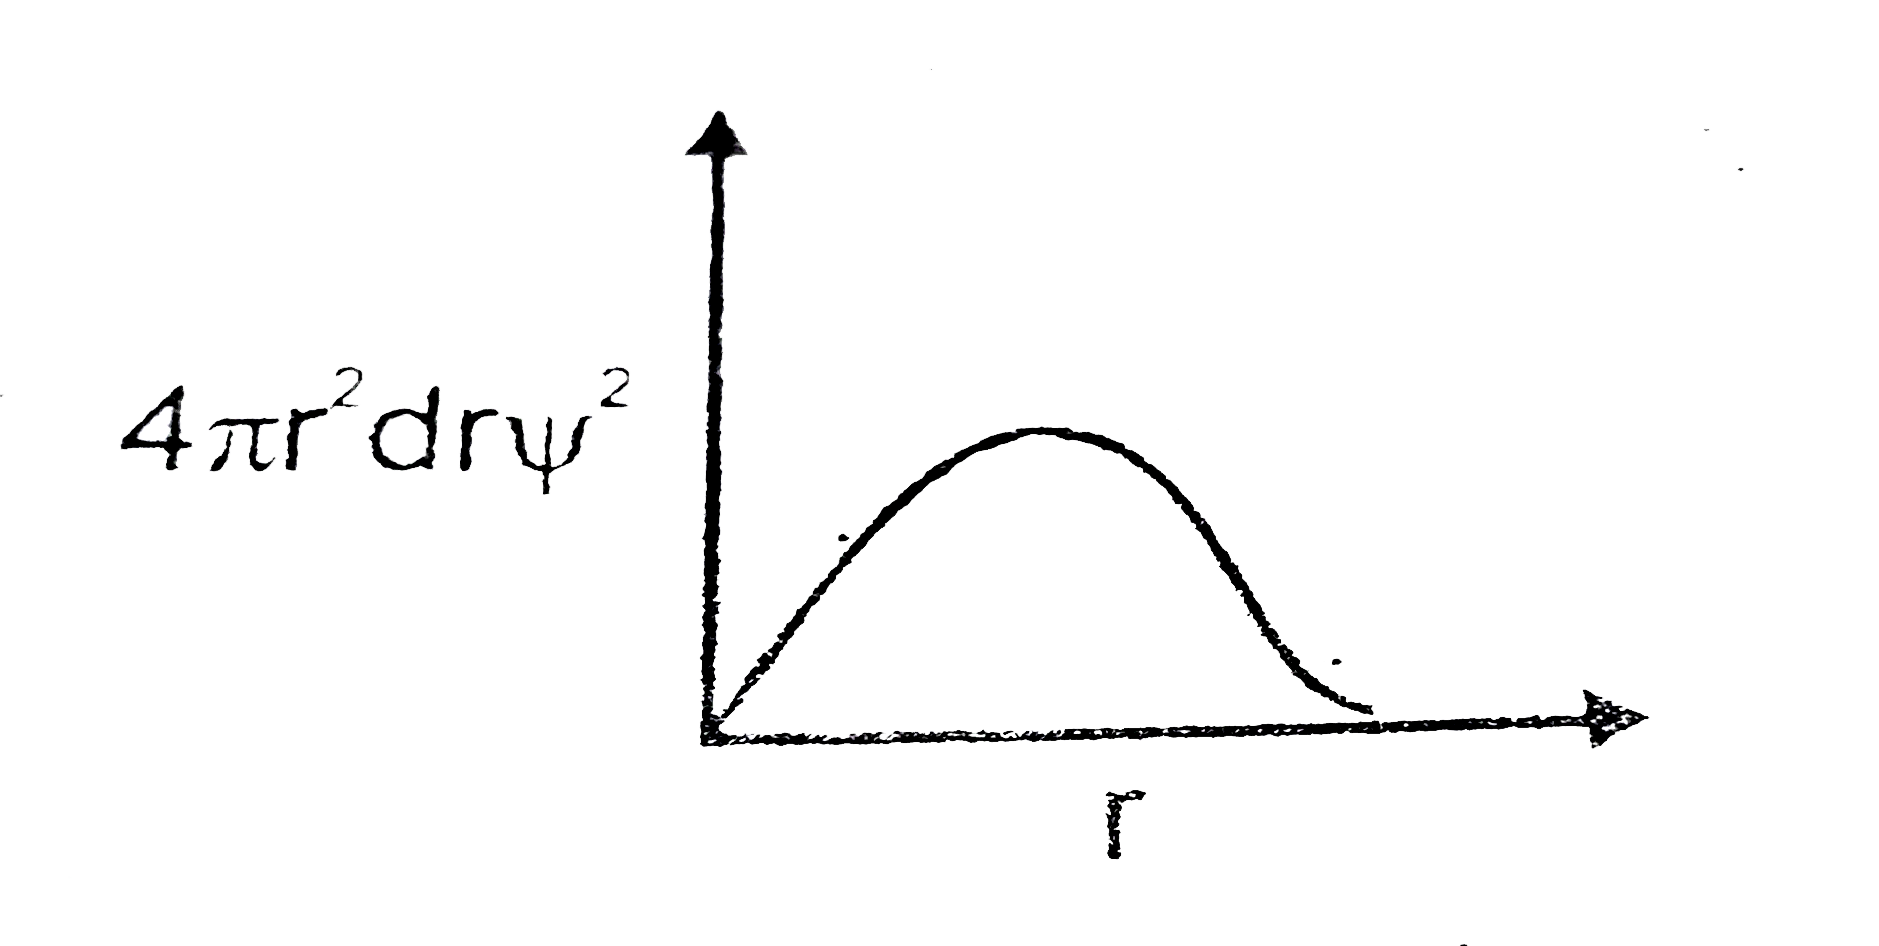
Observe the given graphs carefully.
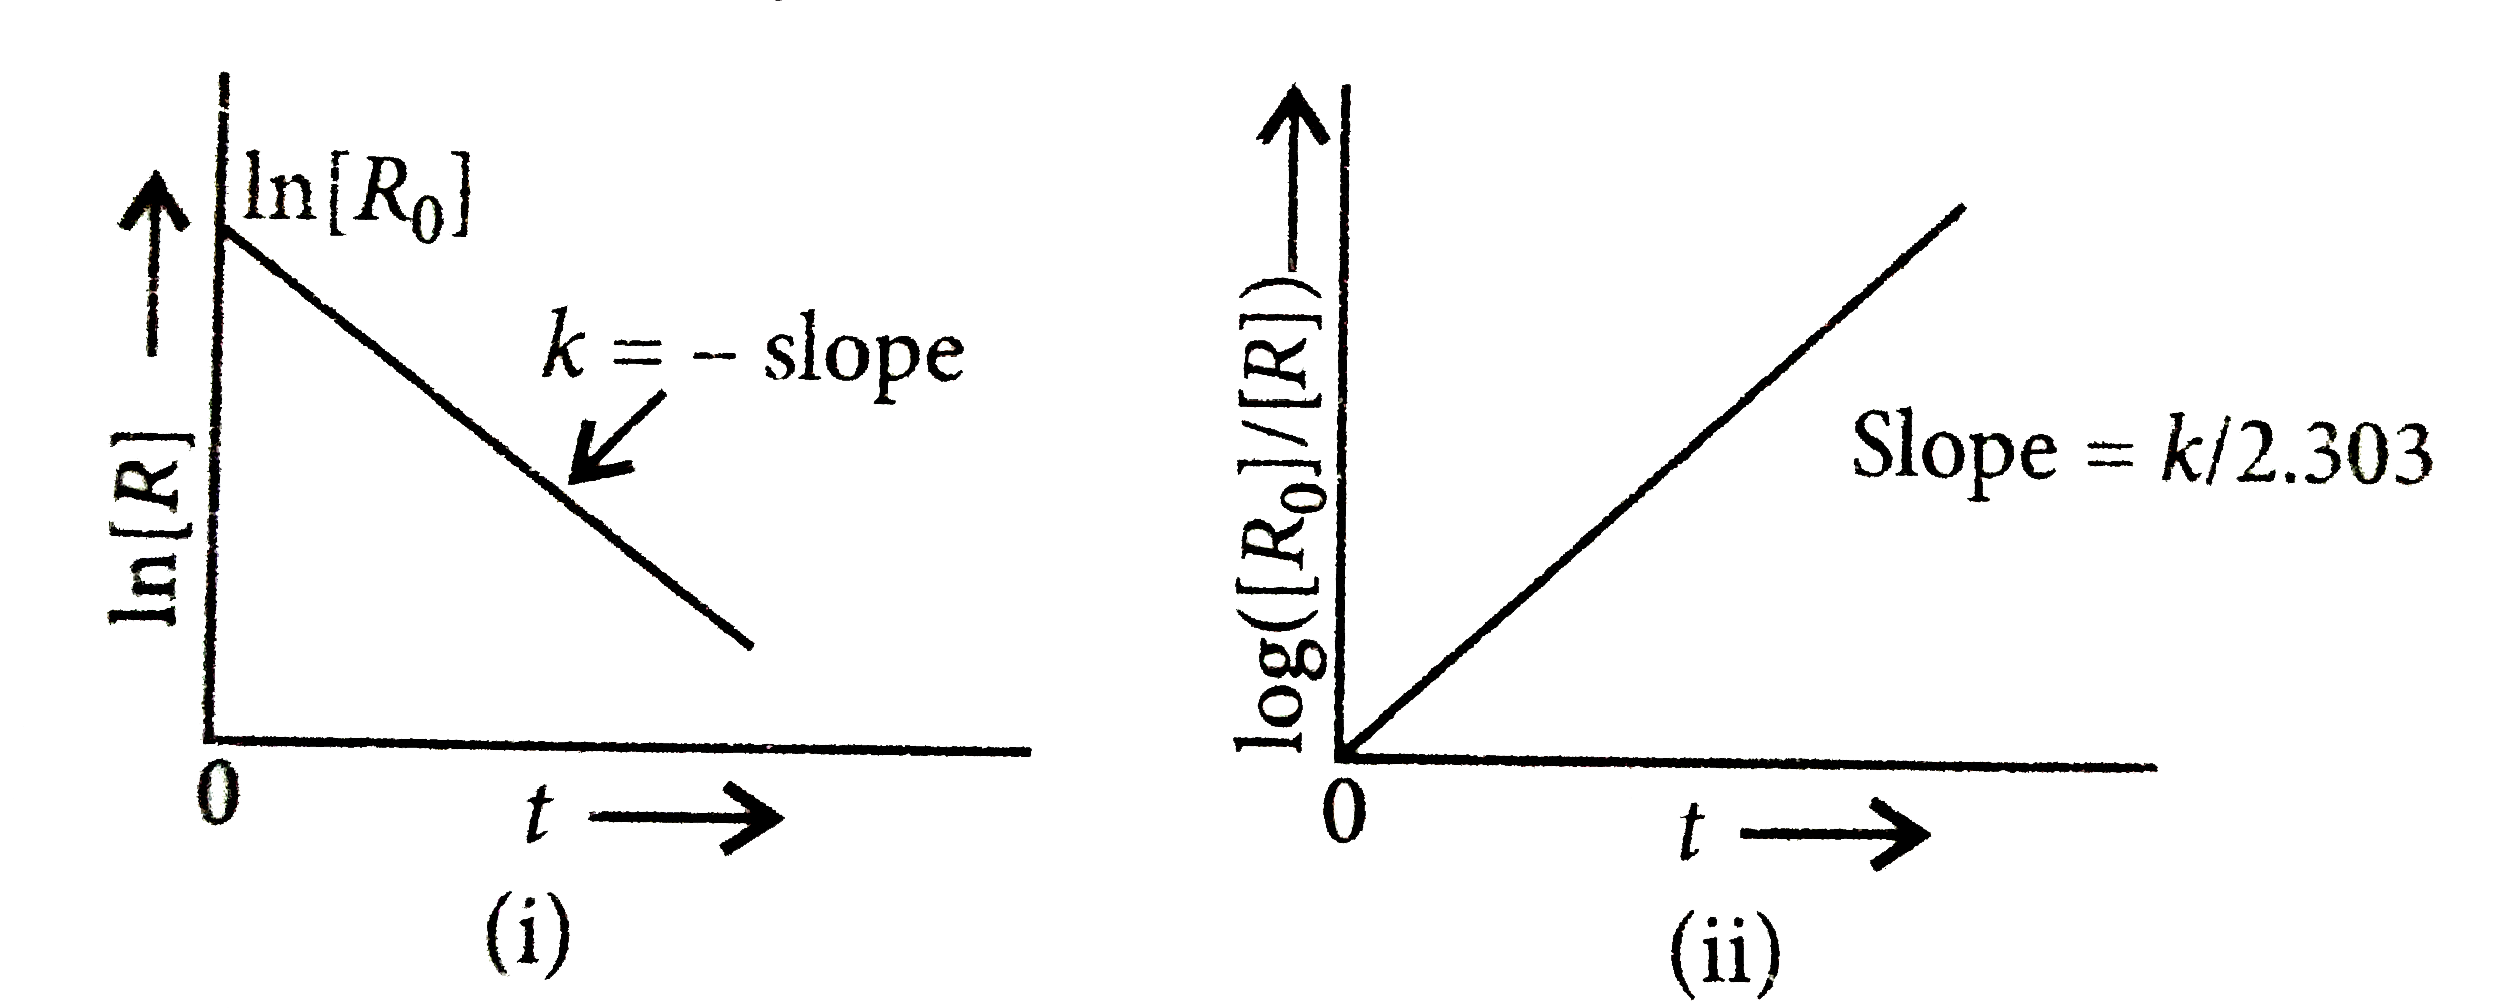
Which of the given orders are shown by the graphs respectively?
zero order, First order
First order, Zero order
First order, first order
Second order, Zero order
The correct Answer is:C
Step by step video & image solution for Observe the given graphs carefully. Which of the given orders are shown by the graphs respectively? by Chemistry experts to help you in doubts & scoring excellent marks in Class 12 exams.
Updated on:21/07/2023Topper's Solved these Questions
- CHEMICAL KINETICSBOOK - NCERT FINGERTPS ENGLISHCHAPTER - CHEMICAL KINETICSEXERCISE - Temperature Dependendence Of The Rate Of A Reaction
17 Videos
- CHEMICAL KINETICSBOOK - NCERT FINGERTPS ENGLISHCHAPTER - CHEMICAL KINETICSEXERCISE - Collision Theory Of Chemical Reactions
6 Videos
- CHEMICAL KINETICSBOOK - NCERT FINGERTPS ENGLISHCHAPTER - CHEMICAL KINETICSEXERCISE - Factors Influencing Rate Of Reaction
30 Videos
- BIOMOLECULESBOOK - NCERT FINGERTPS ENGLISHCHAPTER - BIOMOLECULESEXERCISE - Assertion And Reason
15 Videos
- CHEMISTRY IN EVERYDAY LIFE BOOK - NCERT FINGERTPS ENGLISHCHAPTER - CHEMISTRY IN EVERYDAY LIFE EXERCISE - NCERT Exemplar
15 Videos
Similar Questions
Knowledge Check
Refer to the given graph carefully and answer the following question.
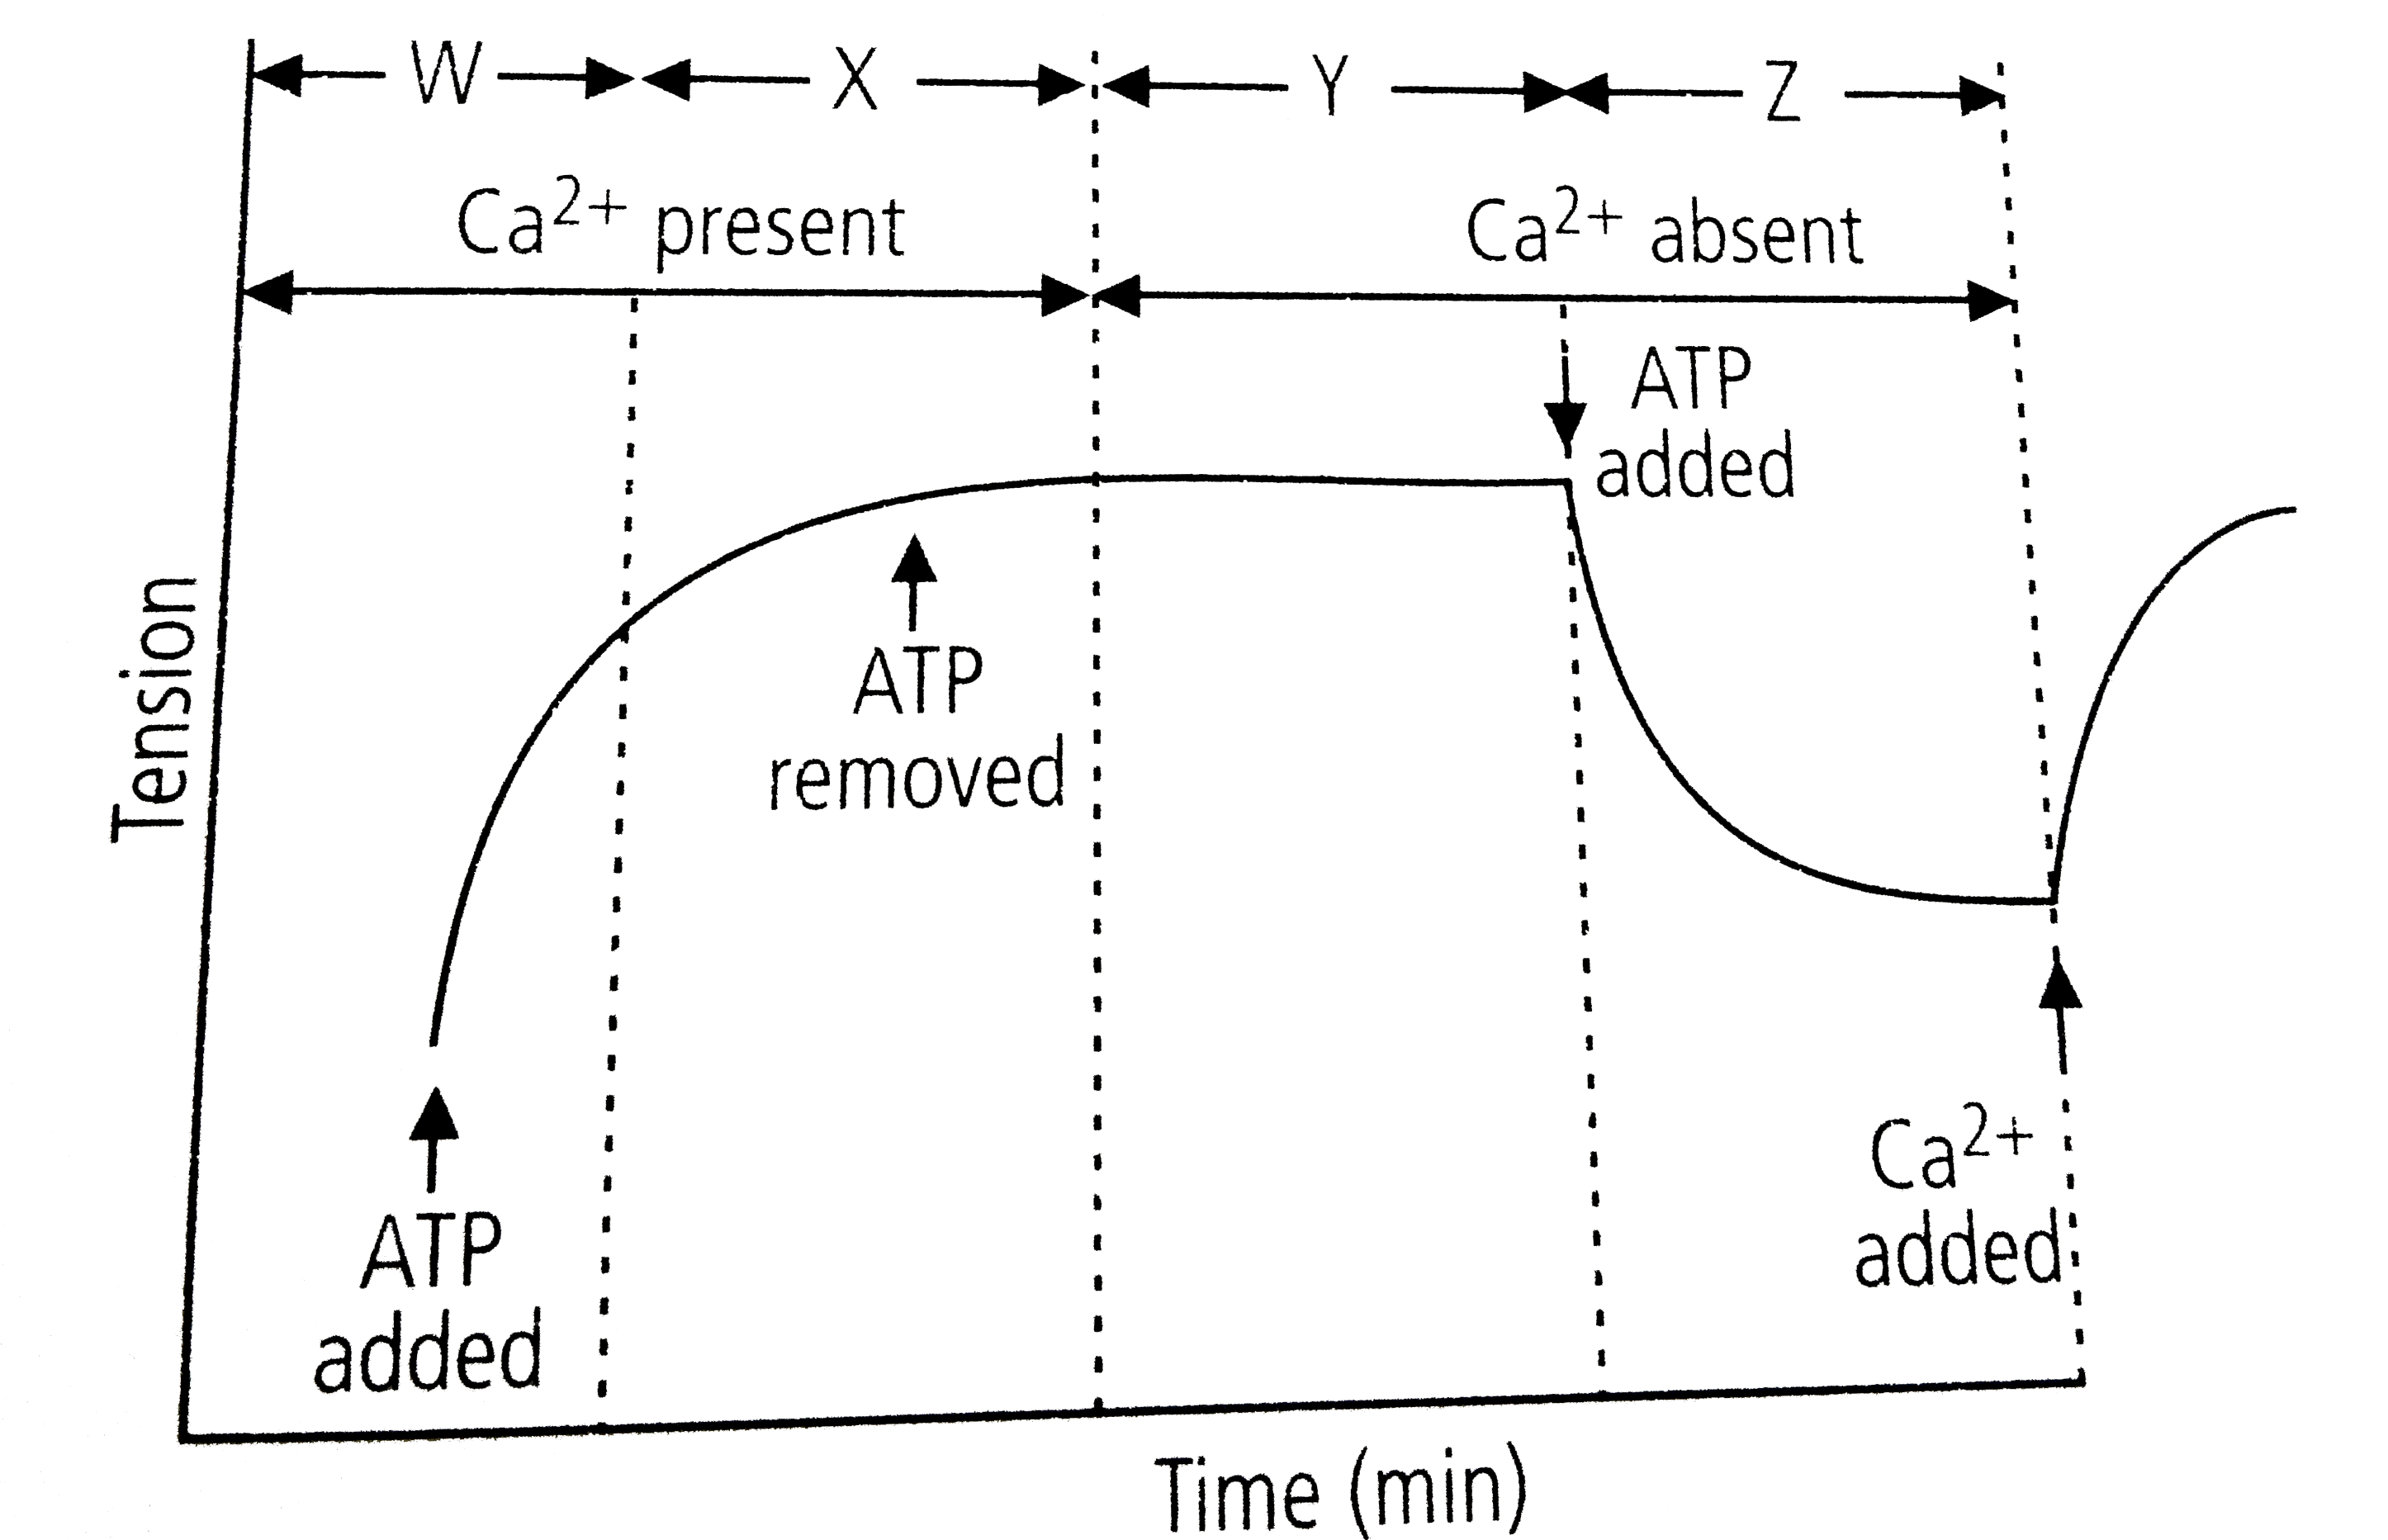
Which of the labelled parts on the graph represents rigor mortis?AXBWCZDYWhich of the following is incorrect about the given graph ?
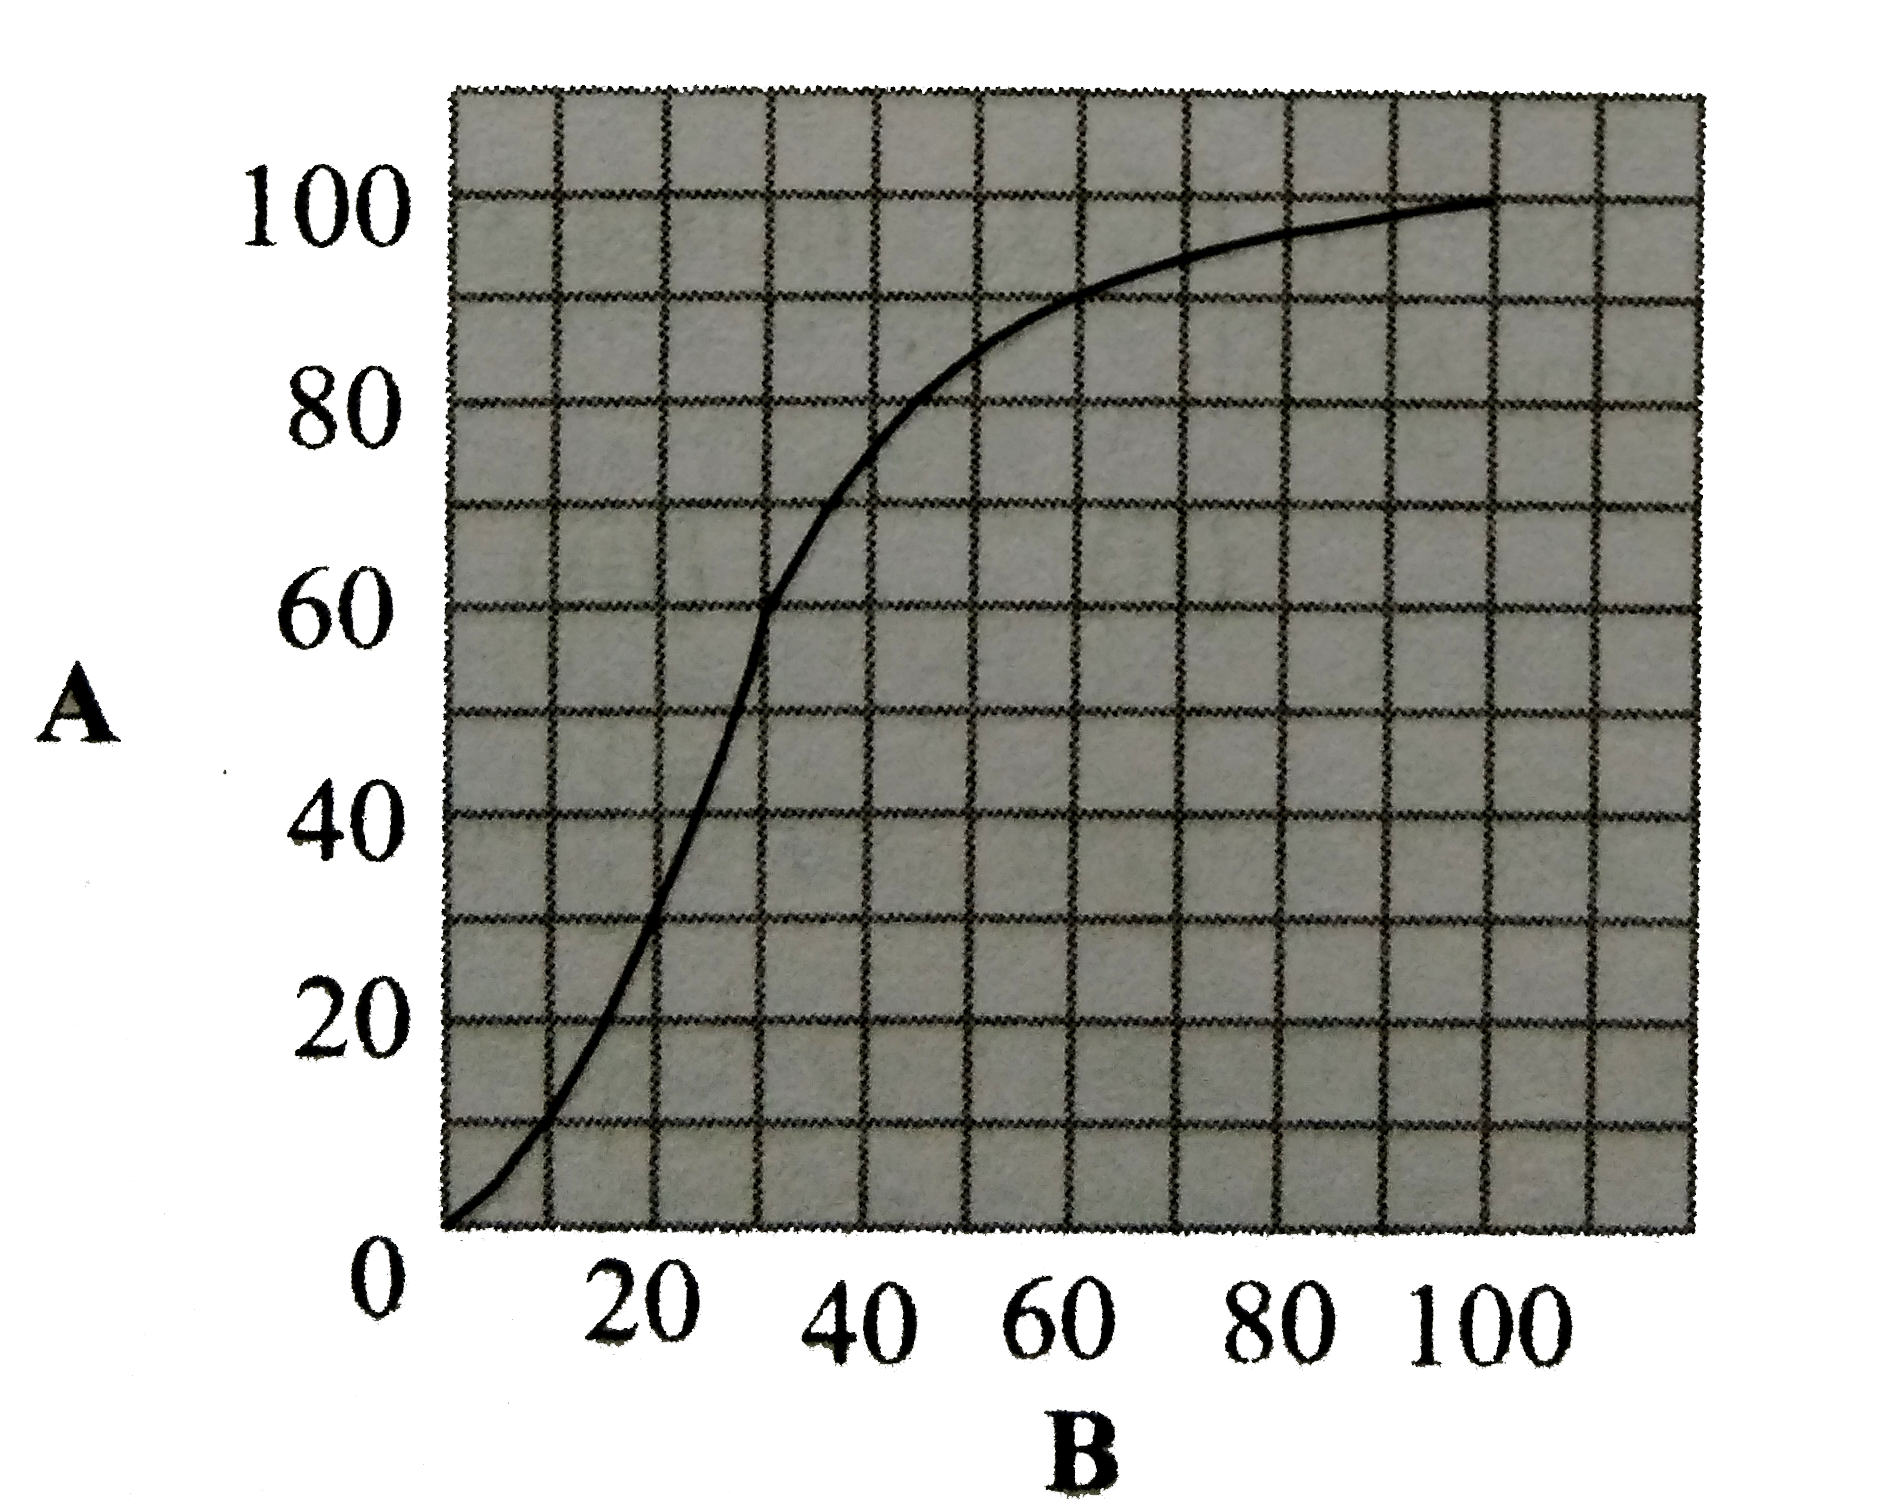 AThe curve is called oxygen dissociation curve.BThe part 'A' represents percentage saturation of haemologbin with oxygen.CThe part 'B' represents partial pressure of carbon dioxide.DThis curve is highly useful in studying the effect of factors like PCO2,H+ concentration, etc. on binding of CO2 with haemoglobin.
Which of the following describes the given graph correctly ?
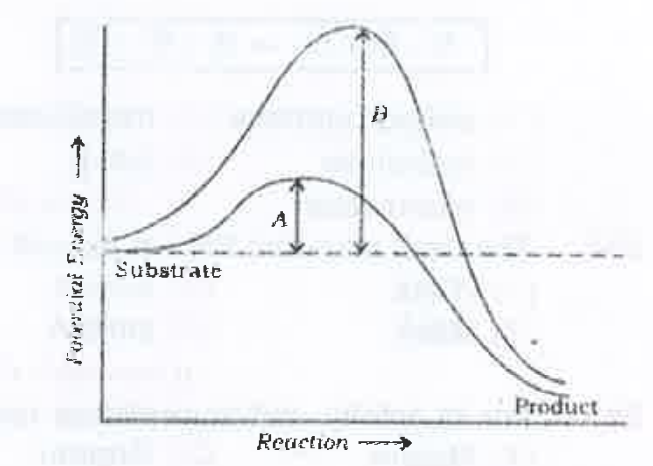
View SolutionFrom the given graph
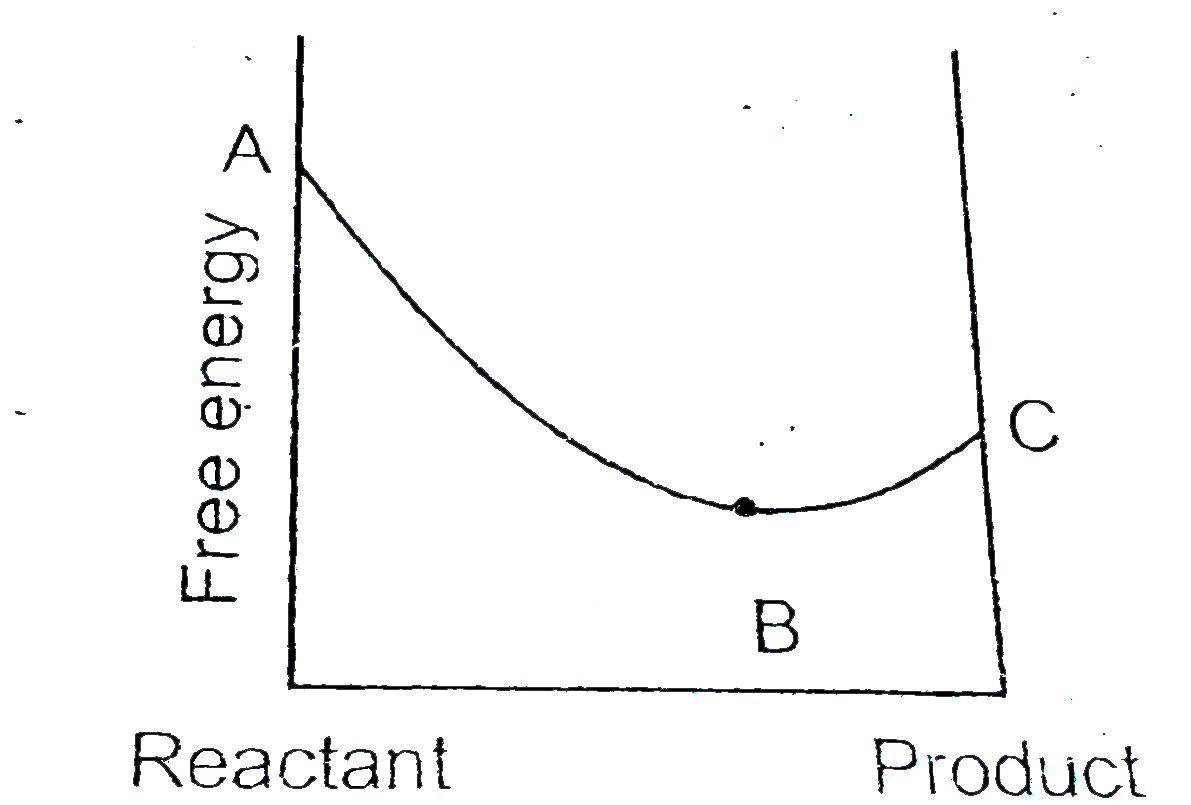
Which of the following statement is correct ?
View SolutionIn the given figure is shown a variable y varying exponentially on another variable x. Study the graph carafully. Which of the following equations best suits the show graph?
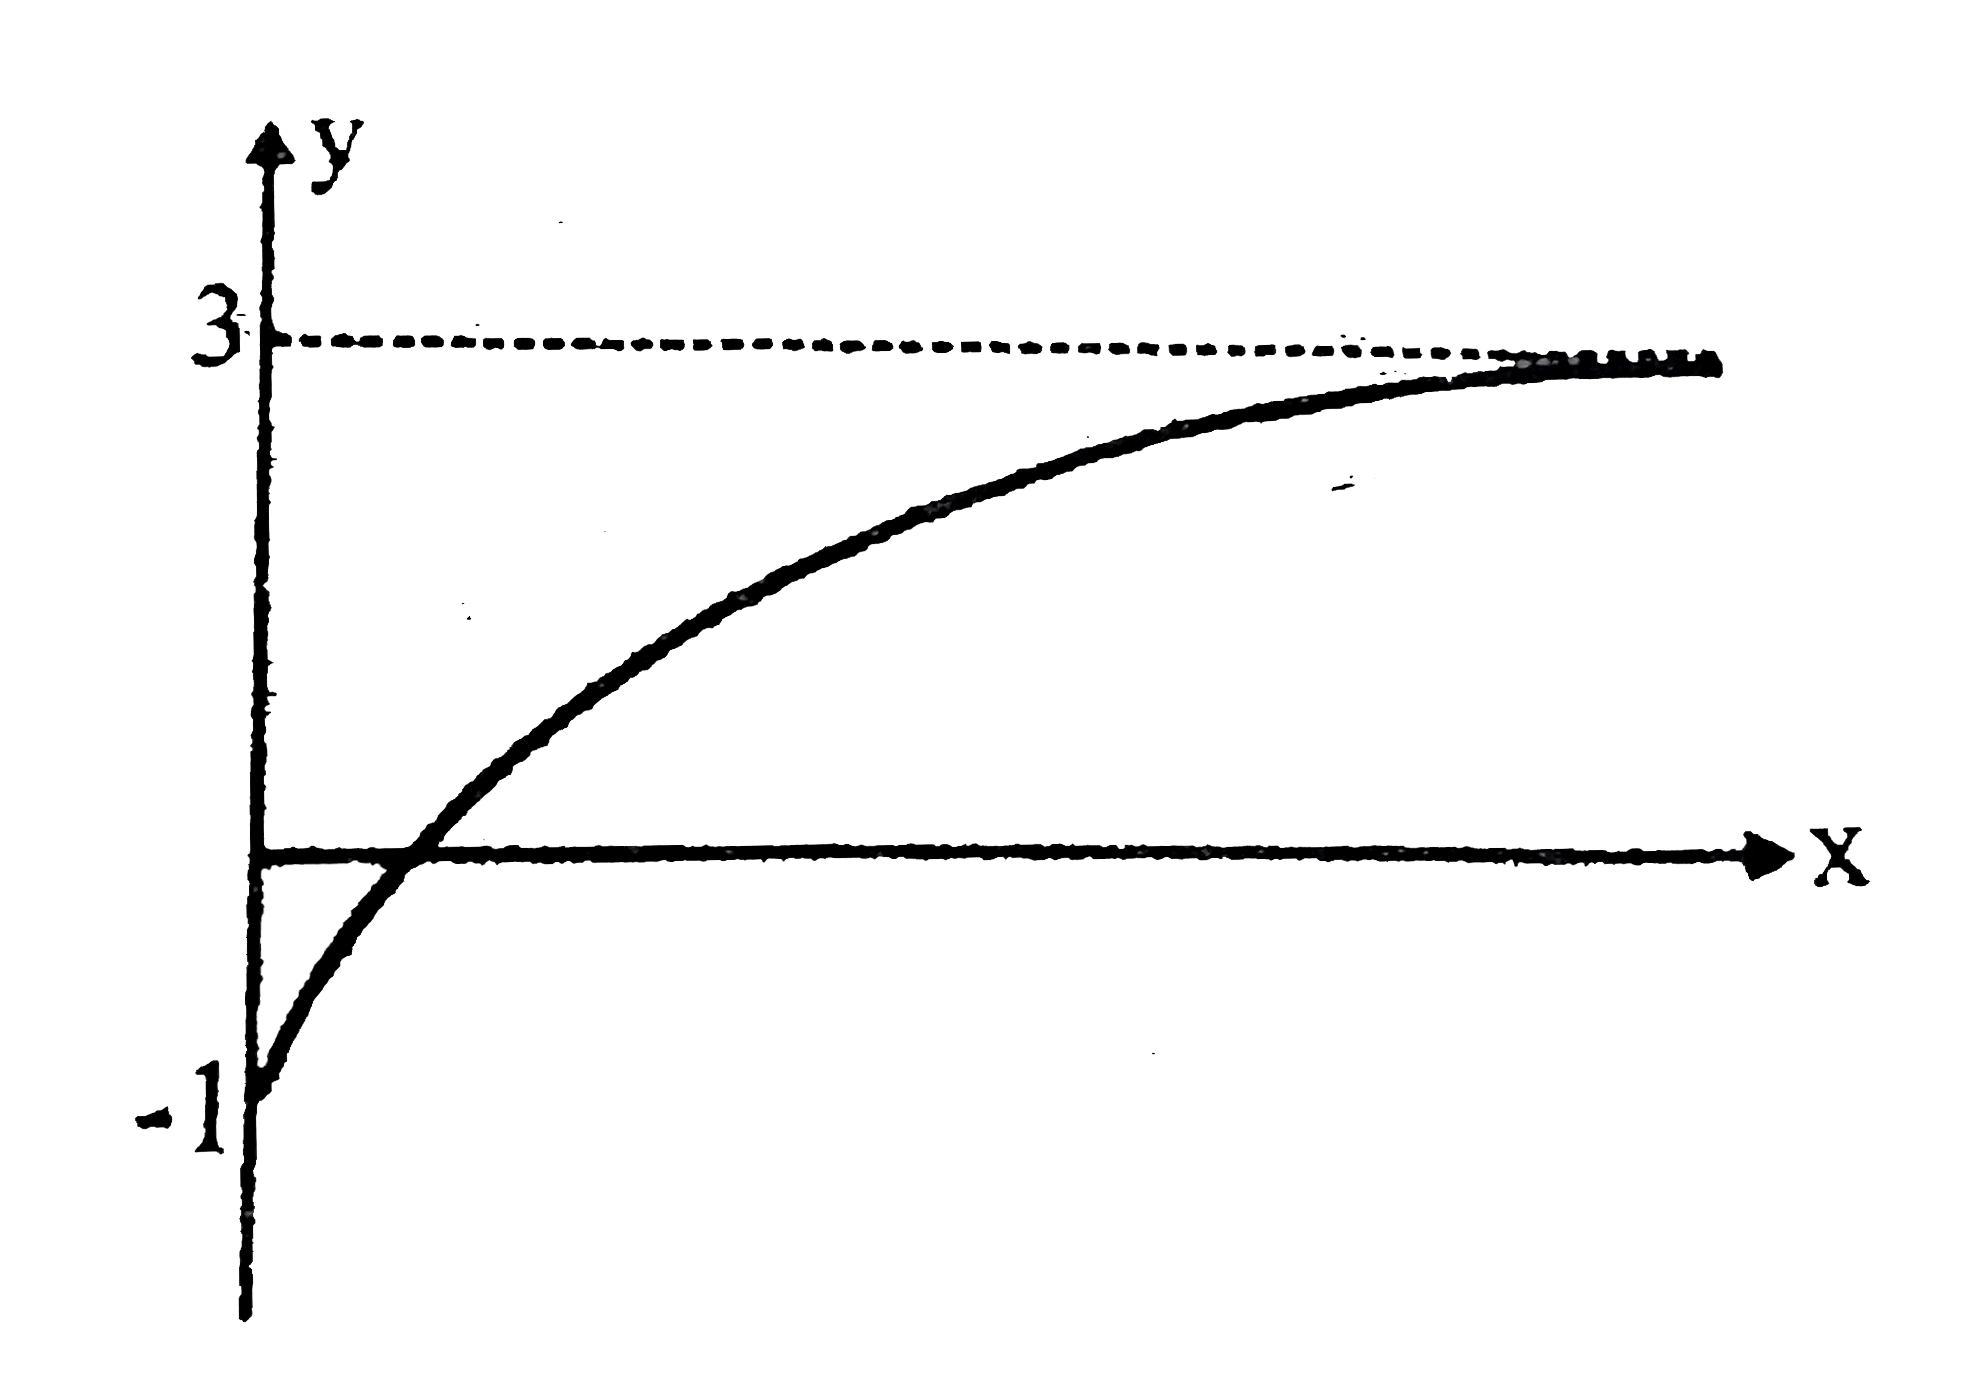
View Solution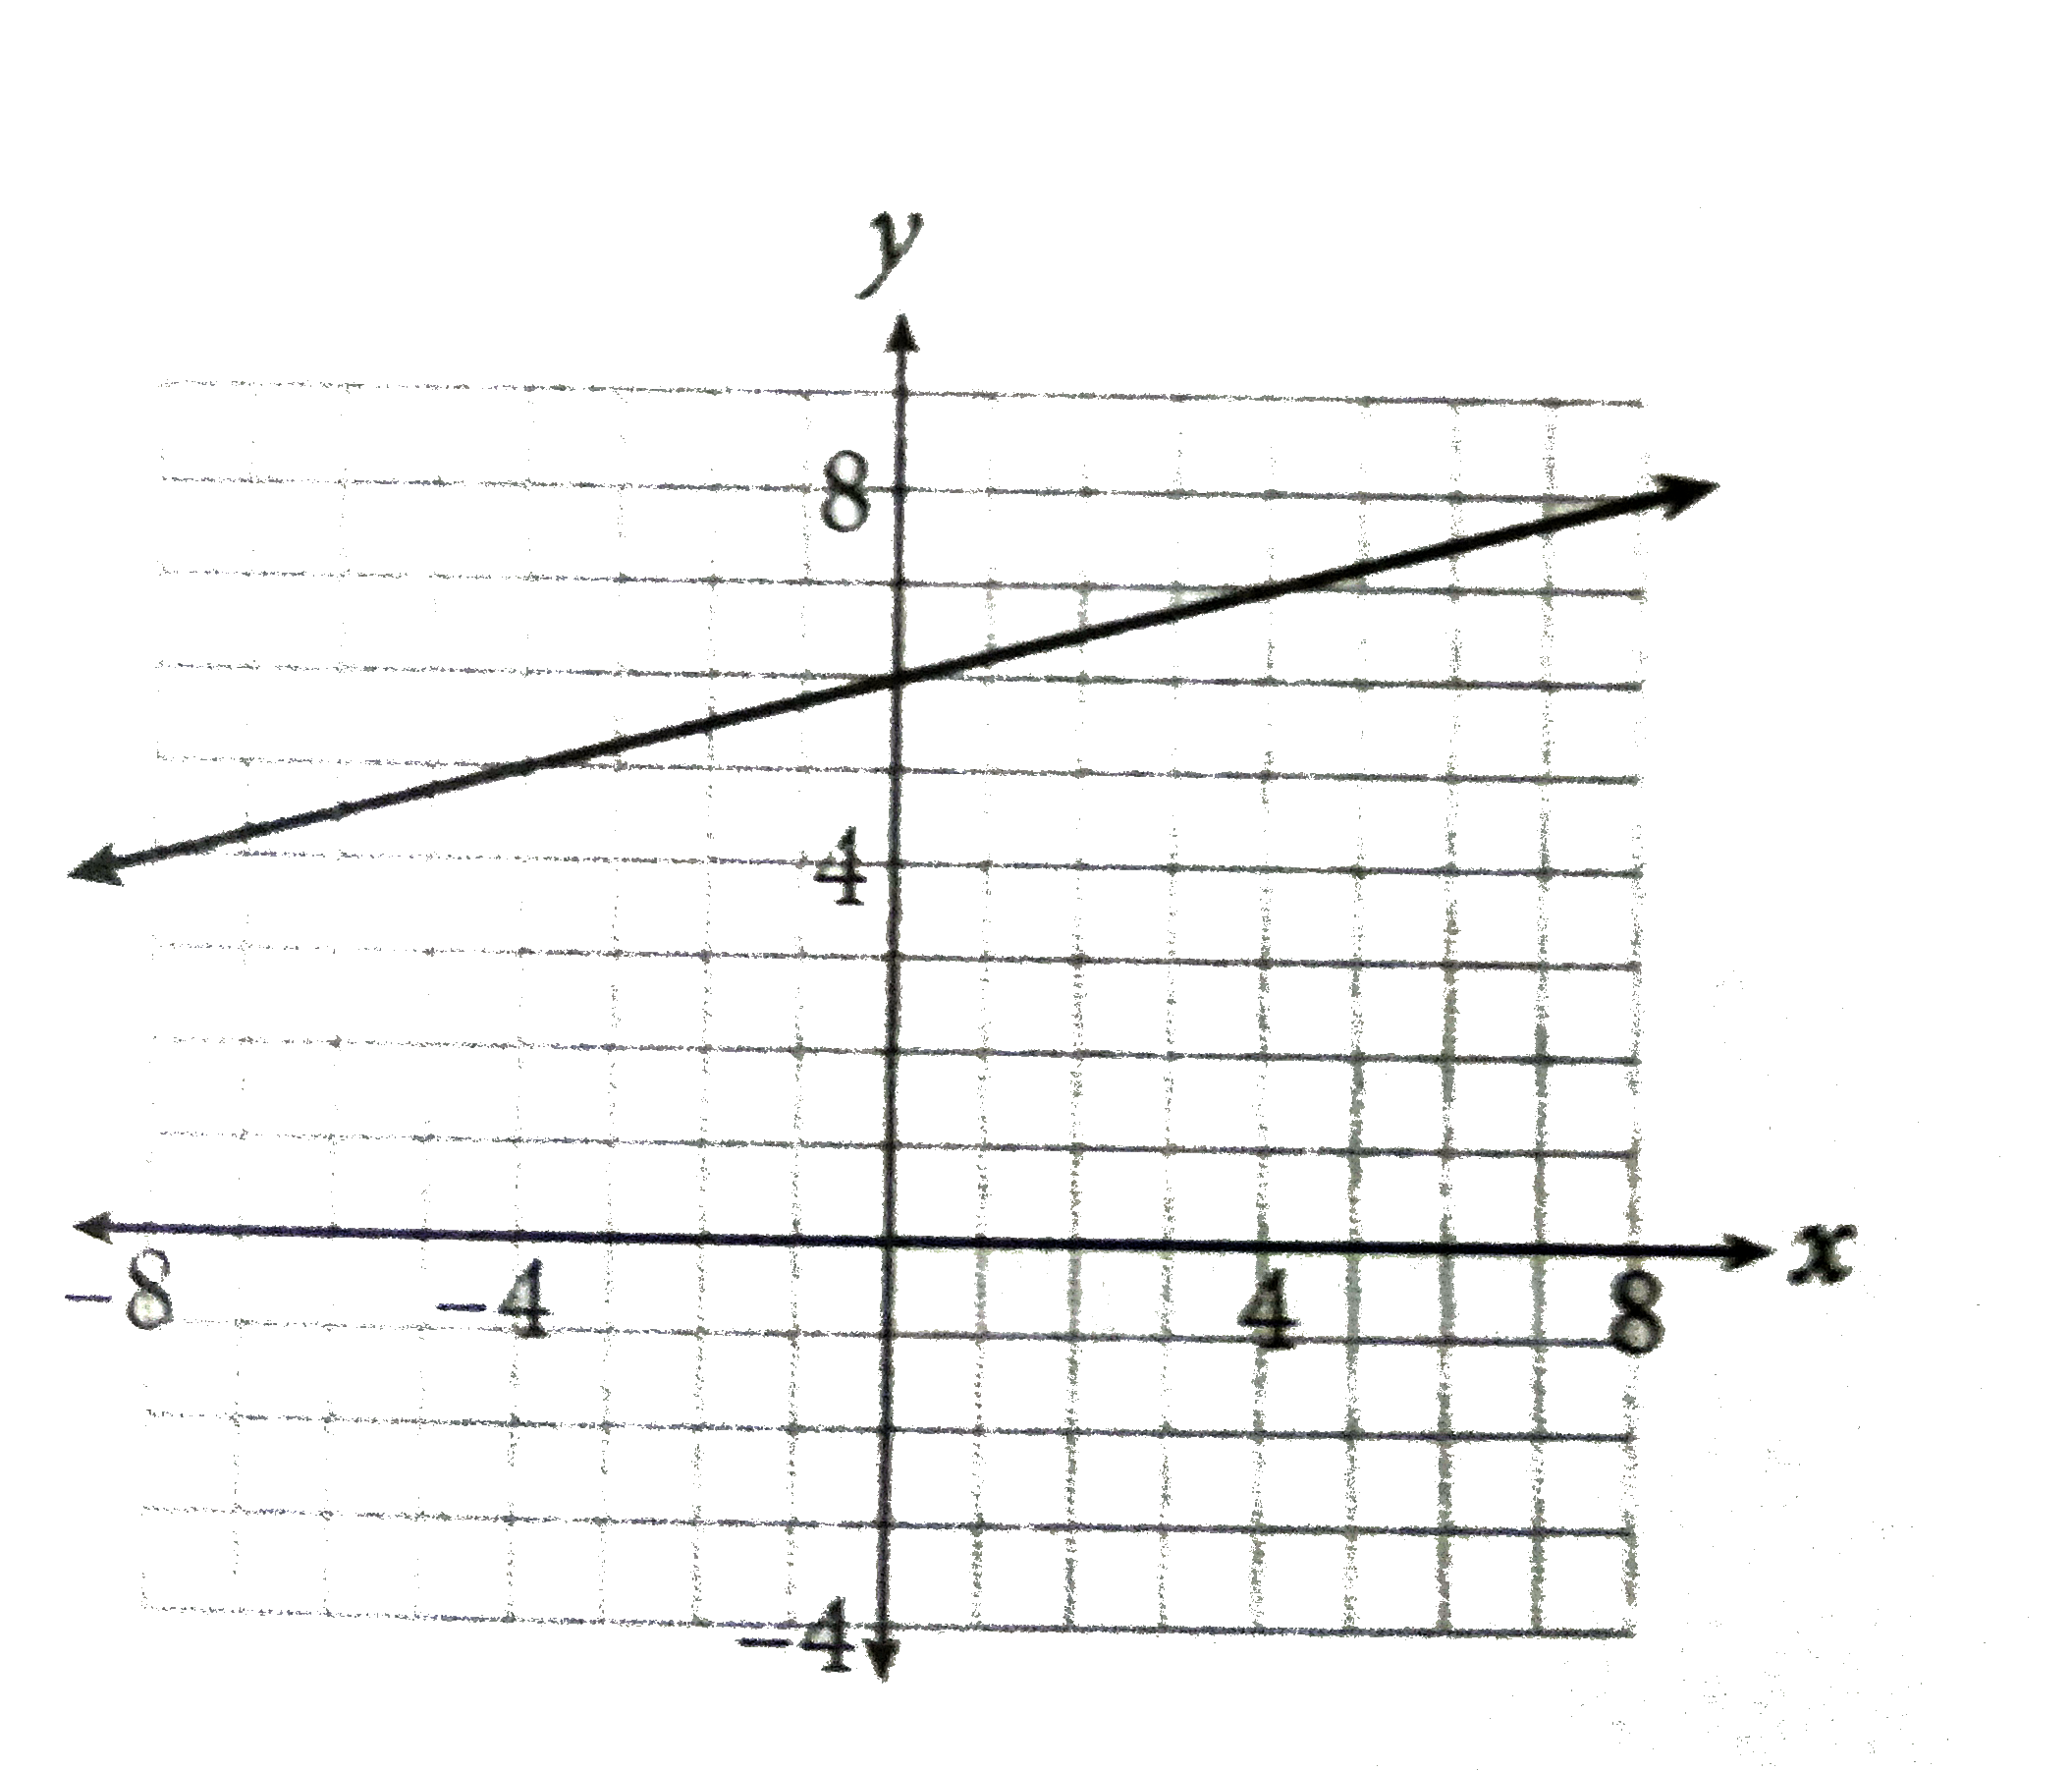
Which of the following equations represents the line shown in the graph?
View SolutionGiven graph may belong with
View Solution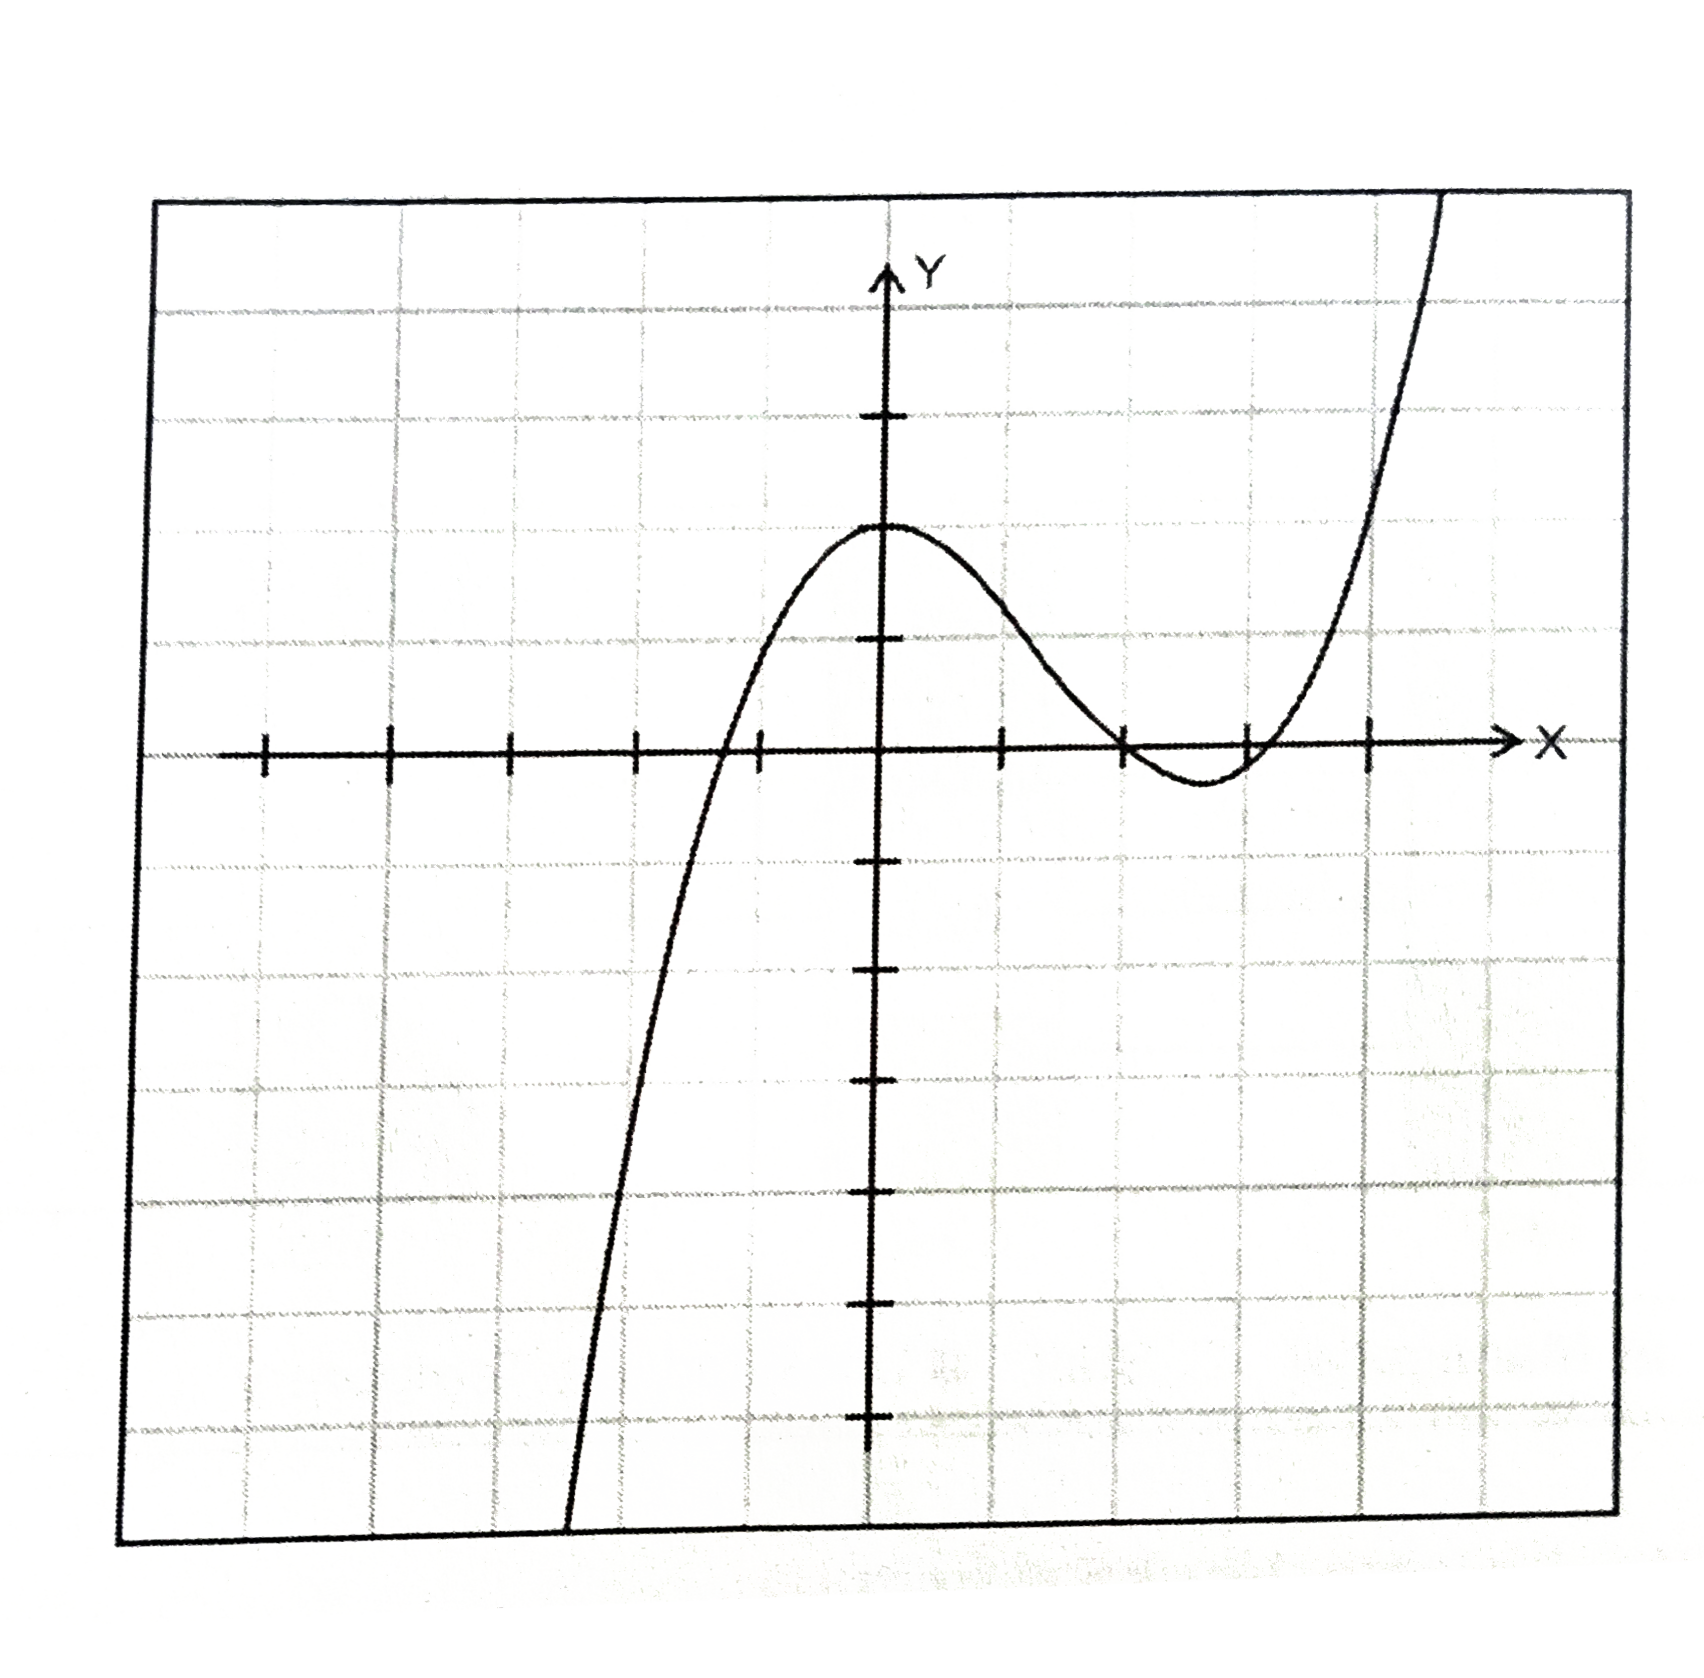
Which of the following could be the equation of the graph shown above ?
View Solution


