The law describing realtionship between P and V of ideal gas at constant temperature is called..........
To solve the question, we need to identify the law that describes the relationship between pressure (P) and volume (V) of an ideal gas at a constant temperature. Here’s a step-by-step breakdown:
Step 1: Understand the Ideal Gas Equation
The ideal gas equation is given by:
PV=nRT
where:
- P = pressure of the gas
- V = volume occupied by the gas
- n = number of moles of the gas
- R = gas constant
- T = temperature
Step 2: Identify the Conditions
In this question, we are asked to consider the relationship at constant temperature. This means that T is constant. Since R (the gas constant) is also a constant and the number of moles n is fixed, we can simplify the equation.
Step 3: Simplify the Equation
Since T, R, and n are constants, we can express the equation as:
PV=constant
This indicates that the product of pressure and volume remains constant when the temperature is held constant.
Step 4: Identify the Law
The relationship PV=constant at constant temperature is known as Boyle's Law. Therefore, the answer to the question is:
Boyle's Law
Final Answer
The law describing the relationship between P and V of an ideal gas at constant temperature is called Boyle's Law.
---
The ideal gas equation is given by:
PV=nRT
where:
- P = pressure of the gas
- V = volume occupied by the gas
- n = number of moles of the gas
- R = gas constant
- T = temperature
In this question, we are asked to consider the relationship at constant temperature. This means that T is constant. Since R (the gas constant) is also a constant and the number of moles n is fixed, we can simplify the equation.
Since T, R, and n are constants, we can express the equation as:
PV=constant
This indicates that the product of pressure and volume remains constant when the temperature is held constant.
The relationship PV=constant at constant temperature is known as Boyle's Law. Therefore, the answer to the question is:
Boyle's Law
The law describing the relationship between P and V of an ideal gas at constant temperature is called Boyle's Law.
Topper's Solved these Questions
- STATES OF MATTERBOOK - CENGAGE CHEMISTRY ENGLISHCHAPTER - STATES OF MATTEREXERCISE - Exercises (Ture False)
25 Videos
- STATES OF MATTERBOOK - CENGAGE CHEMISTRY ENGLISHCHAPTER - STATES OF MATTEREXERCISE - Ex 5.4
32 Videos
- SOME BASIC CONCEPTS AND MOLE CONCEPTBOOK - CENGAGE CHEMISTRY ENGLISHCHAPTER - SOME BASIC CONCEPTS AND MOLE CONCEPTEXERCISE - Archives Subjective
11 Videos
- STOICHIOMETRYBOOK - CENGAGE CHEMISTRY ENGLISHCHAPTER - STOICHIOMETRYEXERCISE - Archives Subjective
33 Videos
Similar Questions
The bulk modulus of an ideal gas at constant temperature
View SolutionWhich of the following shown the correct relationship between the pressure 'P' and density ρ of an ideal gas at constant temperature?
View SolutionWhat is the type of graph between log P and log V at constant temperature?
View SolutionThe slope of the graph between log P and log V at constant temperature for a given mass of gas is
View SolutionWhich of the following graphs correctly represents the variation of β=−dV/dPV
with P for an ideal gas at constant temperature?
View SolutionWhich of the following graphs correctly represents the variation of β=−(dVdP)/V with P for an ideal gas at constant temperature
View SolutionWhich of the following graphs correctly represents the variation of β=−dV/dPV
with P for an ideal gas at constant temperature?
View SolutionWhen a sample of ideal gas is changed from an initial state to a final state, various curves can be plotted for the process like P-V curve, V-T curve,P-T curve etc.
For example, P-V curve for a fixed amount of an ideal gas at constant temperature is a rectangular hyperbola, V-T curve for a fixed amount of an ideal gas at constant volume is again a straight line. However, the shapes may vary if the constant parameters are also changed.
Now, answer the following questions :
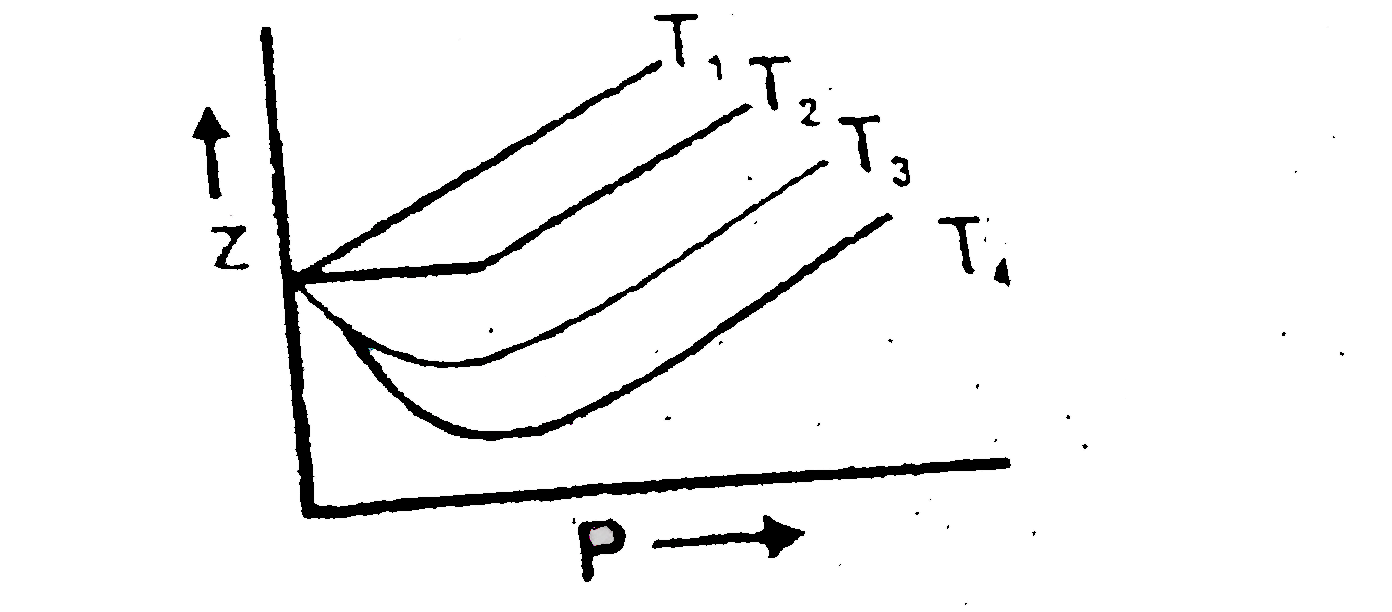
From the given plot between Z and P for a real gas the correct is :

View SolutionWhen a sample of ideal gas is changed from an initial state to a final state, various curves can be plotted for the process like P-V curve, V-T curve,P-T curve etc.
For example, P-V curve for a fixed amount of an ideal gas at constant temperature is a rectangular hyperbola, V-T curve for a fixed amount of an ideal gas at constant volume is again a straight line. However, the shapes may vary if the constant parameters are also changed.
Now, answer the following questions :
Which of the following graphs is not possible for a fixed amount of ideal gas upon moving from initial state A to final state B :
View SolutionThere is no change in internal energy for an ideal gas at constant temperature.
Internal energy of an ideal gas is a function of temperature only.
View Solution
