When a sample of ideal gas is changed from an initial state to a final state, various curves can be plotted for the process like P-V curve, V-T curve,P-T curve etc.
For example, P-V curve for a fixed amount of an ideal gas at constant temperature is a rectangular hyperbola, V-T curve for a fixed amount of an ideal gas at constant volume is again a straight line. However, the shapes may vary if the constant parameters are also changed.
Now, answer the following questions :
Which of the following graphs is not possible for a fixed amount of ideal gas upon moving from initial state A to final state B :
None of these
The correct Answer is:D
To determine which graph is not possible for a fixed amount of ideal gas moving from initial state A to final state B, we need to analyze the given graphs based on the properties of ideal gases and the relationships between pressure (P), volume (V), and temperature (T).
1. Understanding Ideal Gas Behavior:
- For a fixed amount of ideal gas, the number of moles (n) remains constant. The relationships between P, V, and T are described by the ideal gas law:
PV=nRT
- This means that if any two of the variables (P, V, T) are known, the third can be determined.
2. Analyzing the First Graph:
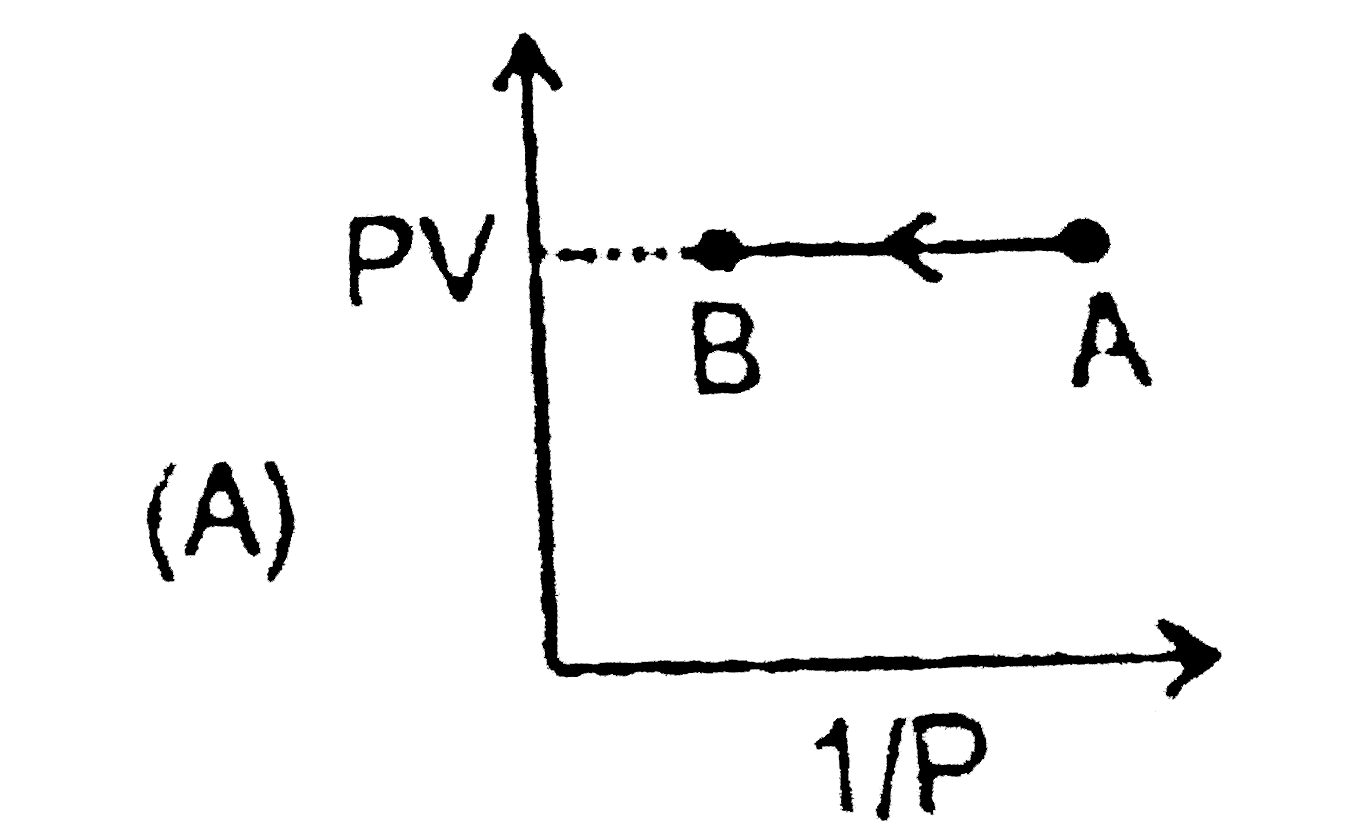
- The first graph is a P-V curve at constant temperature. According to Boyle's Law, for a fixed amount of gas at constant temperature, the graph of P vs. V is a rectangular hyperbola.
- As we move from state A to state B, if pressure increases, volume must decrease to maintain the product PV constant.
- Conclusion: This graph is possible.
3. Analyzing the Second Graph:
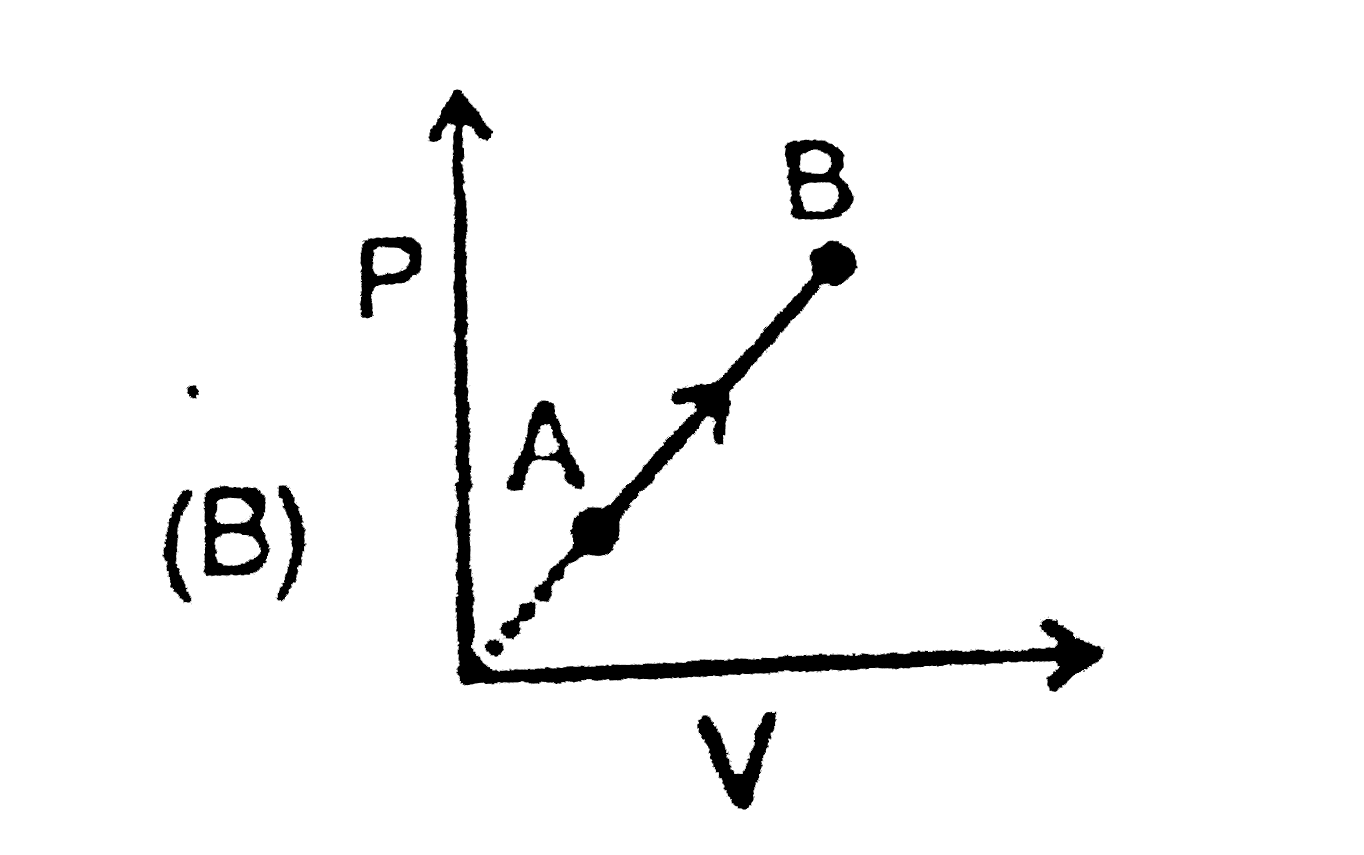
- The second graph shows a linear increase in pressure with volume. This can occur if the temperature is increasing.
- If temperature increases, the relationship can be linear under certain conditions, as described by the ideal gas law.
- Conclusion: This graph is also possible.
4. Analyzing the Third Graph:
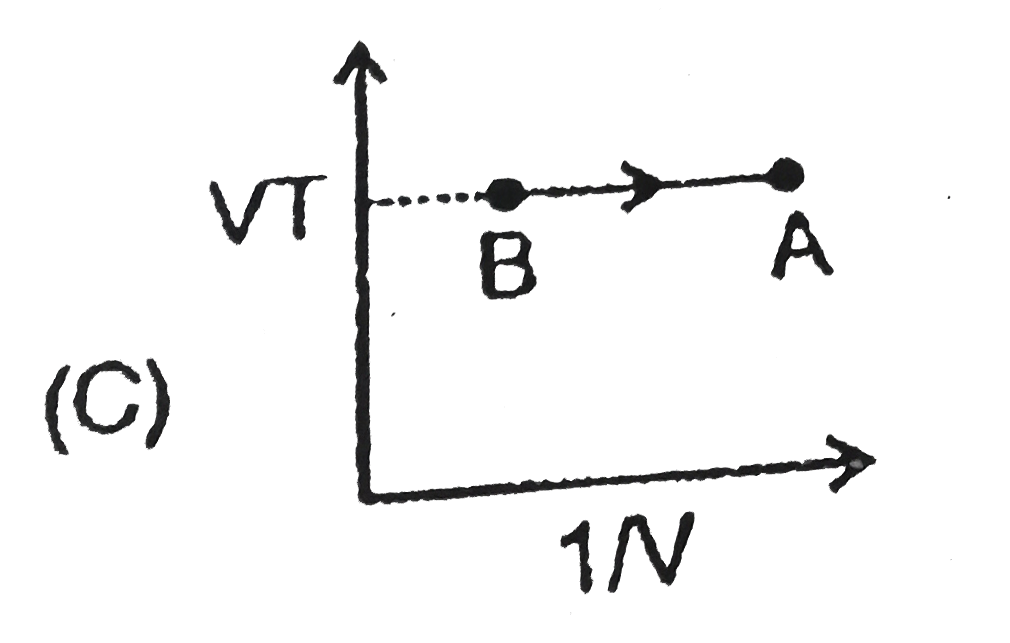
- The third graph is a V-T curve, where V is constant. This indicates that the volume does not change while the temperature changes.
- According to the ideal gas law, if V is constant, then as temperature increases, pressure must also increase proportionally.
- This graph is also valid as it can represent a scenario where volume remains constant while temperature changes.
- Conclusion: This graph is possible.
5. Final Analysis:
- Since all three graphs analyzed (P-V, P-T, and V-T) are possible for a fixed amount of ideal gas transitioning from state A to state B, we conclude that none of the graphs presented are impossible.
- Therefore, the answer to the question is that all graphs are possible.
Final Answer:
None of these graphs is impossible for a fixed amount of ideal gas moving from initial state A to final state B.
- For a fixed amount of ideal gas, the number of moles (n) remains constant. The relationships between P, V, and T are described by the ideal gas law:
PV=nRT
- This means that if any two of the variables (P, V, T) are known, the third can be determined.
- The first graph is a P-V curve at constant temperature. According to Boyle's Law, for a fixed amount of gas at constant temperature, the graph of P vs. V is a rectangular hyperbola.
- As we move from state A to state B, if pressure increases, volume must decrease to maintain the product PV constant.
- Conclusion: This graph is possible.
- The second graph shows a linear increase in pressure with volume. This can occur if the temperature is increasing.
- If temperature increases, the relationship can be linear under certain conditions, as described by the ideal gas law.
- Conclusion: This graph is also possible.
- The third graph is a V-T curve, where V is constant. This indicates that the volume does not change while the temperature changes.
- According to the ideal gas law, if V is constant, then as temperature increases, pressure must also increase proportionally.
- This graph is also valid as it can represent a scenario where volume remains constant while temperature changes.
- Conclusion: This graph is possible.
- Since all three graphs analyzed (P-V, P-T, and V-T) are possible for a fixed amount of ideal gas transitioning from state A to state B, we conclude that none of the graphs presented are impossible.
- Therefore, the answer to the question is that all graphs are possible.
None of these graphs is impossible for a fixed amount of ideal gas moving from initial state A to final state B.
Topper's Solved these Questions
Similar Questions
When a sample of ideal gas is changed from an initial state to a final state, various curves can be plotted for the process like P-V curve, V-T curve,P-T curve etc.
For example, P-V curve for a fixed amount of an ideal gas at constant temperature is a rectangular hyperbola, V-T curve for a fixed amount of an ideal gas at constant volume is again a straight line. However, the shapes may vary if the constant parameters are also changed.
Now, answer the following questions :
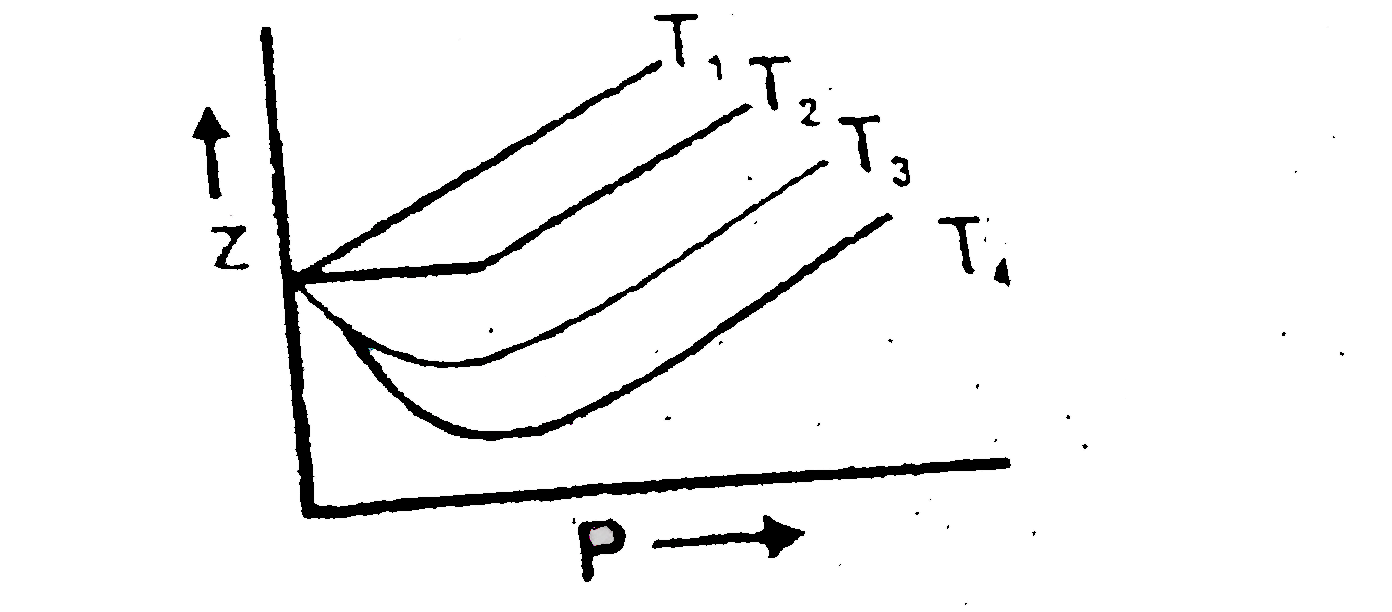
From the given plot between Z and P for a real gas the correct is :
View SolutionWhen a sample of ideal gas is changed from an initial state to a final state, various curves can be plotted for the process like P-V curve, V-T curve,P-T curve etc.
For example, P-V curve for a fixed amount of an ideal gas at constant temperature is a rectangular hyperbola, V-T curve for a fixed amount of an ideal gas at constant volume is again a straight line. However, the shapes may vary if the constant parameters are also changed.
Now, answer the following questions :
Two moles of an ideal gas is changed from its initial state (16 atm, 6L) to final state (4 atm, 15L) in such a way that this change can be represented by a straight line in P-V curve.The maximum temperature attained by the gas during the above change is :(Take : R=112LatmK−1mol−1)
View SolutionWhen a sample of ideal gas is changed from an initial state to a final state, various curves can be plotted for the process like P-V curve, V-T curve,P-T curve etc.
For example, P-V curve for a fixed amount of an ideal gas at constant temperature is a rectangular hyperbola, V-T curve for a fixed amount of an ideal gas at constant volume is again a straight line. However, the shapes may vary if the constant parameters are also changed.
Now, answer the following questions :
Two Vander waals gases have same value 'b' but different 'a' value then which of the following statement is correct under simialr condition .
View SolutionWhich of the following curve is correct for a given amount of an ideal gas at constant pressure?
View SolutionWhat is the shape of the curve obtained on plotting P against PV at constant temperature for an ideal gas ?
View SolutionWhich of the following curve is correct for an ideal gas ?
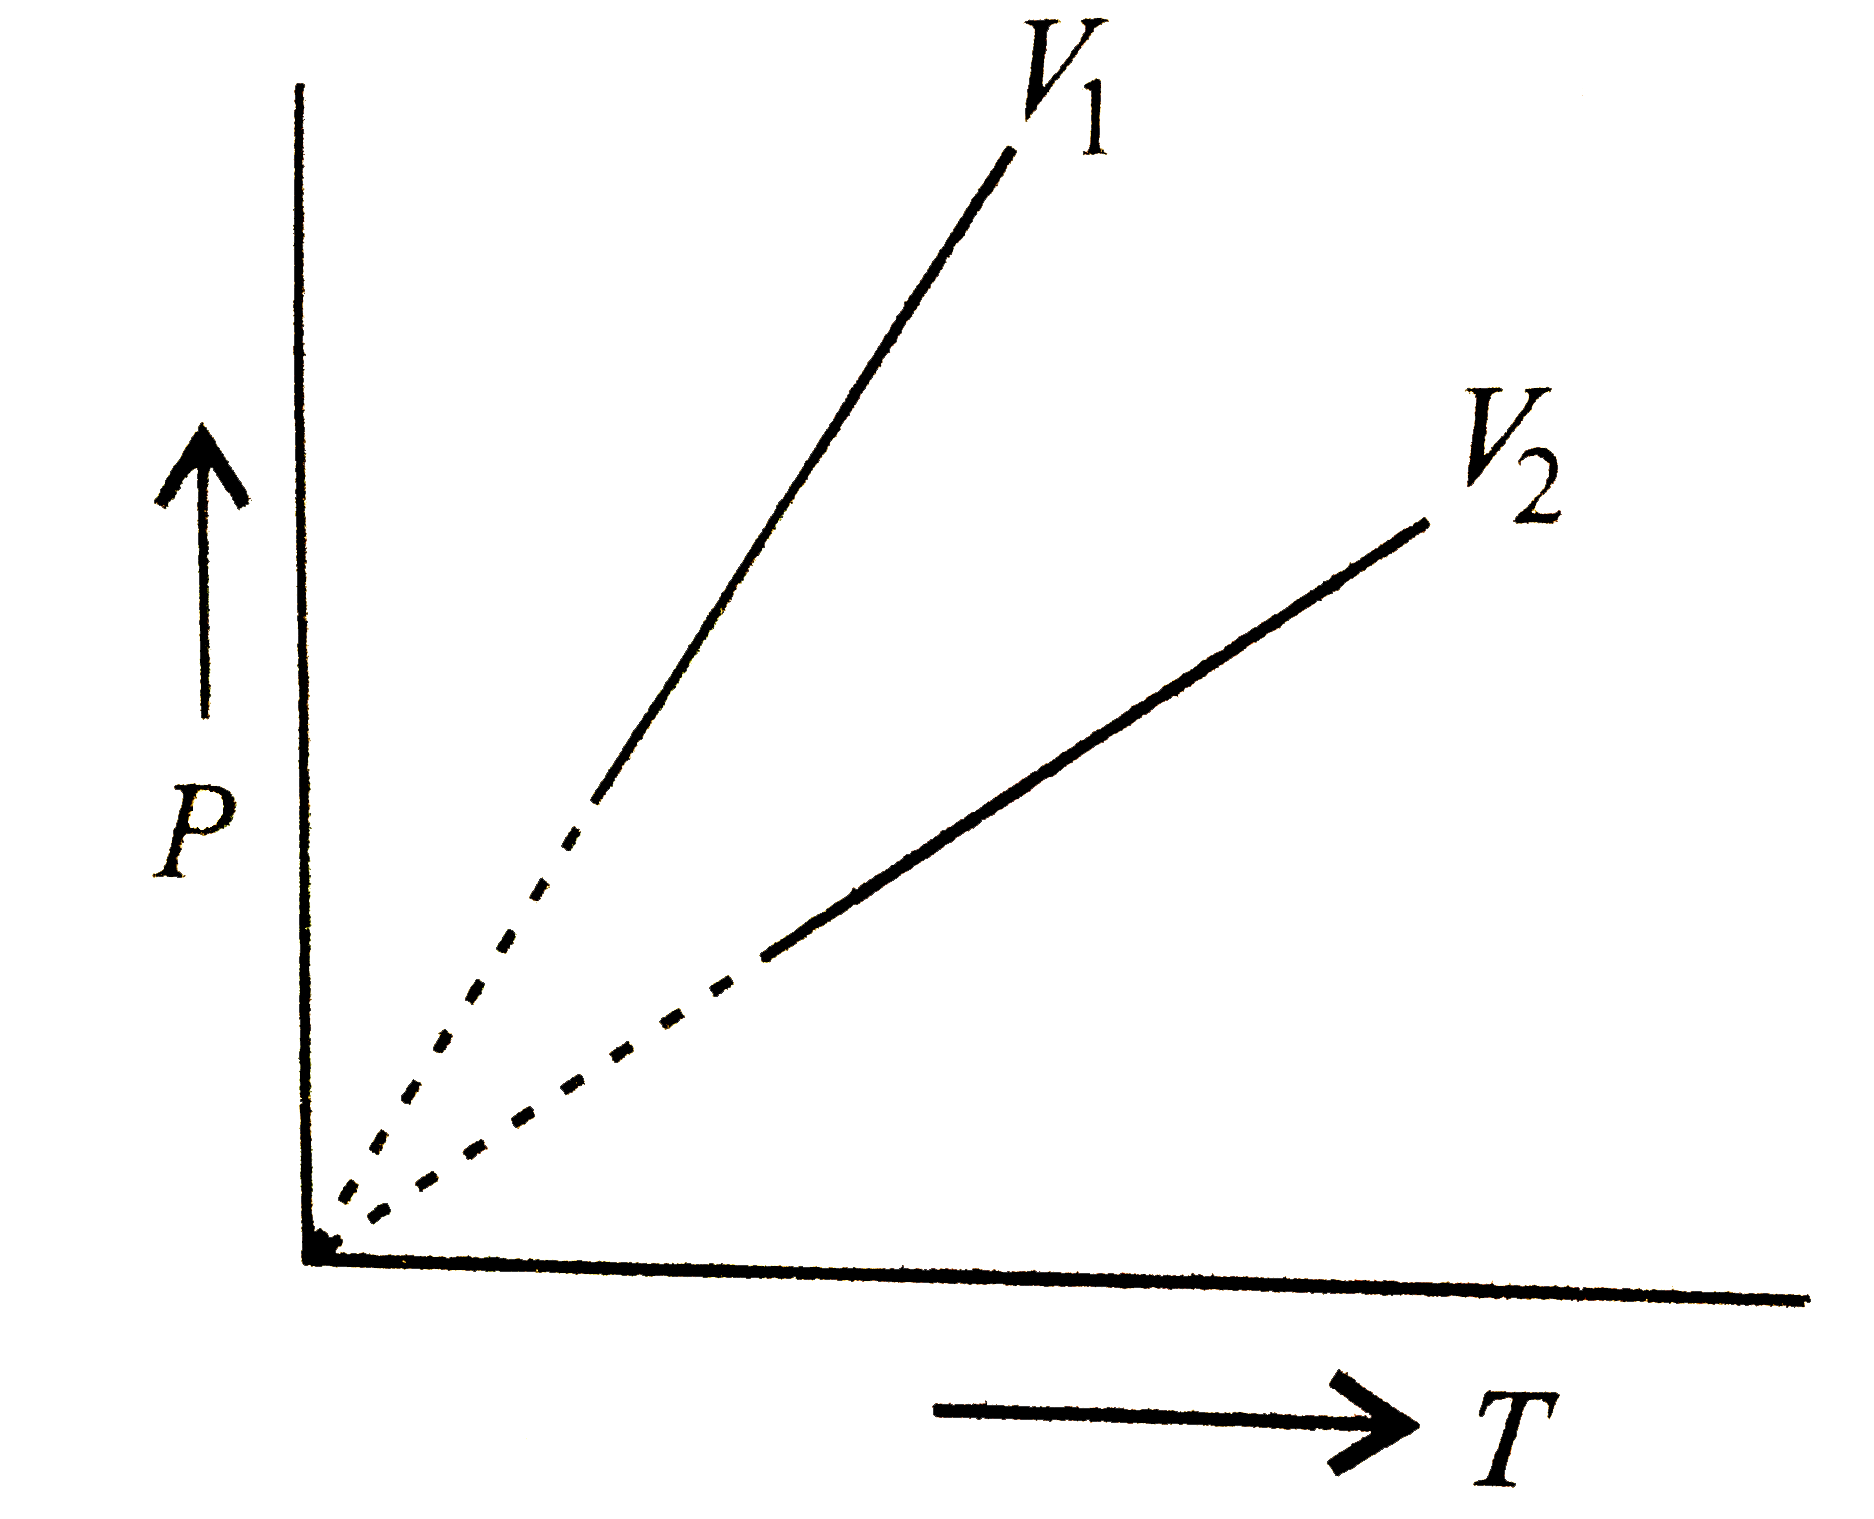
View SolutionA plot of P vs T for a given mass of gas at constant volume is a straight line . P vs T at constant volumes V1 and V2 for an ideal gas are shown below :
Which of the following is correct ?
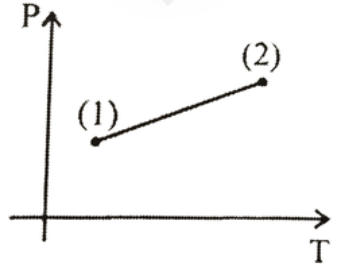
View SolutionFigure shows a process for a given amount of an ideal gas. If volume in state 1 is V1 & in state 2 is V2, then
View SolutionV vs T curves at constant pressure P1 and P2 for an ideal gas are shown in the figure. Which of the following is correct?

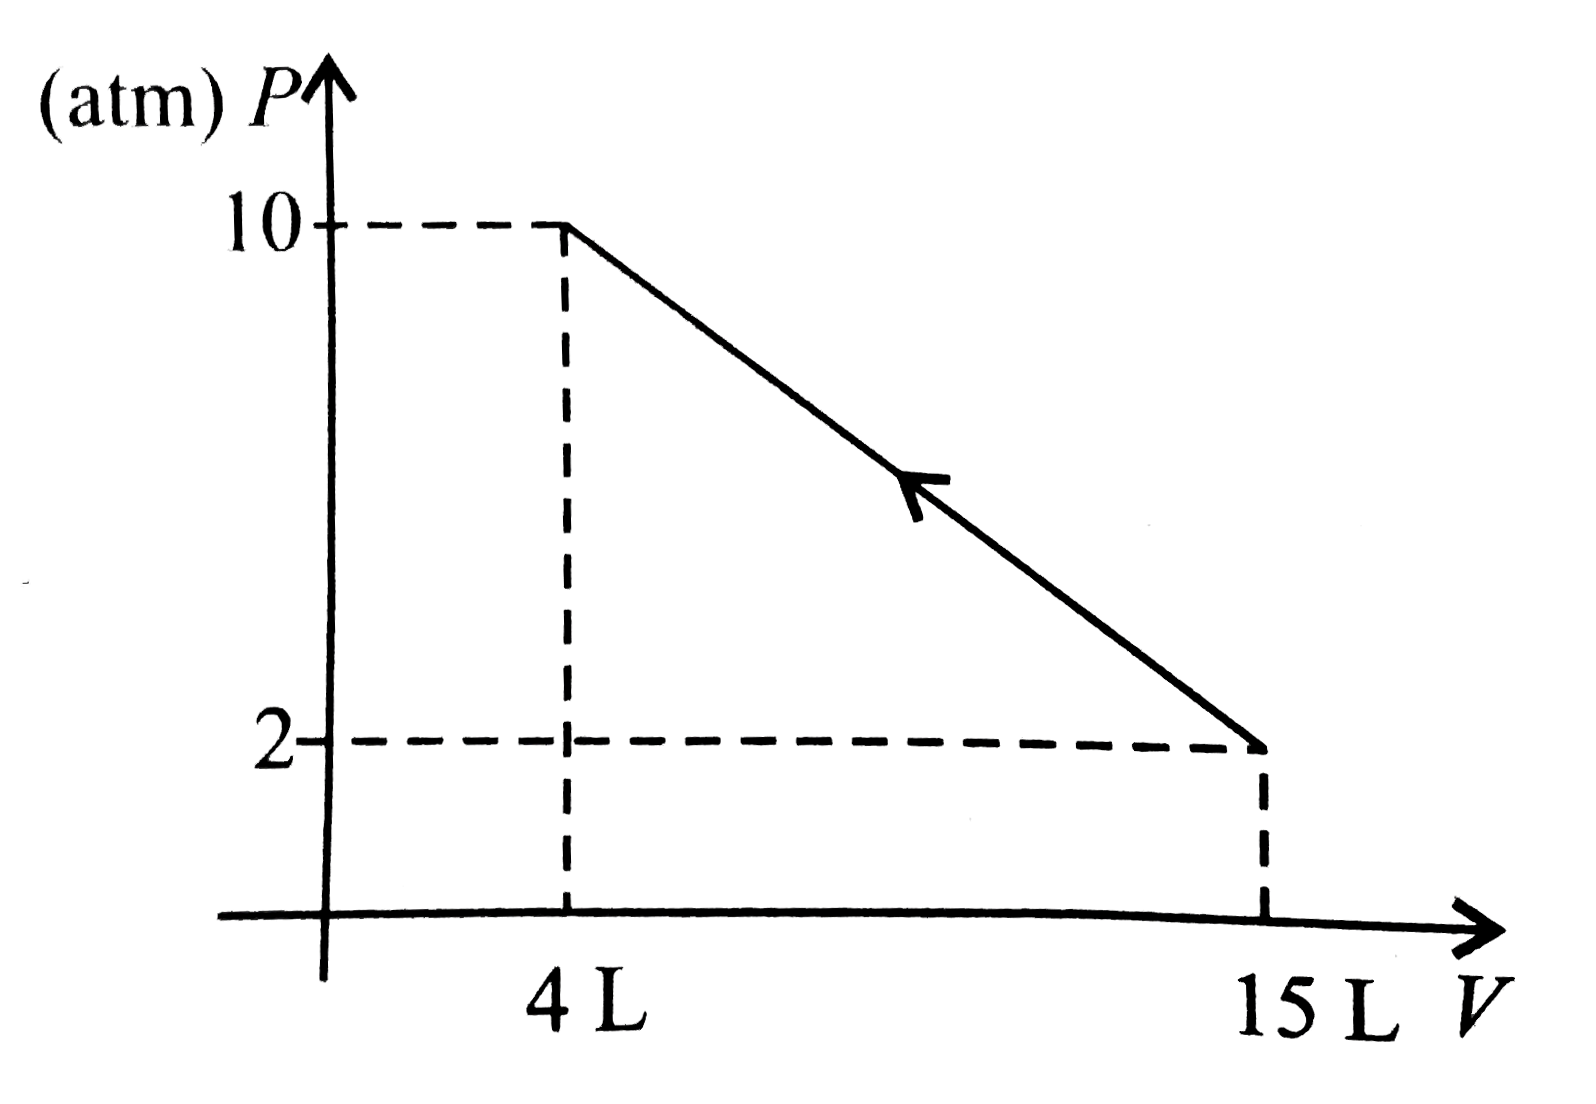
View Solution1mol of a gas is changed from its initial state (15L,2atm) to final state (4L,10atm). If this change can be represented by a straight line in P−V curve, calculate the maximum temperature that, the gas attained.
View Solution
