What do we get for a plot between V and ?
Step by step video & image solution for What do we get for a plot between V and 1//P ? by Chemistry experts to help you in doubts & scoring excellent marks in Class 11 exams.
Topper's Solved these Questions
- BOOK - DINESH PUBLICATIONCHAPTER - STATES OF MATTER : GASES AND LIQUIDSEXERCISE - Long Answer Question7videos
STATES OF MATTER : GASES AND LIQUIDS
- BOOK - DINESH PUBLICATIONCHAPTER - STATES OF MATTER : GASES AND LIQUIDSEXERCISE - Very Short Answer Questions25videos
STATES OF MATTER : GASES AND LIQUIDS
- BOOK - DINESH PUBLICATIONCHAPTER - STATES OF MATTER : GASES AND LIQUIDSEXERCISE - Multiple Choice Question (Select the correct Answer)13videos
STATES OF MATTER : GASES AND LIQUIDS
- BOOK - DINESH PUBLICATIONCHAPTER - STATES OF MATTER (SOLID STATE CHEMISTRY)EXERCISE - ULTIMATE PREPARATORY PACKAGE21videos
STATES OF MATTER (SOLID STATE CHEMISTRY)
- BOOK - DINESH PUBLICATIONCHAPTER - STRUCTURE OF ATOMEXERCISE - Reason Type Questions1videos
STRUCTURE OF ATOM
Similar Questions
Knowledge Check
- Question 1 - Select One
The slope of the plot between pV and p at constant temperature is
AnegativeBpositiveC1/2Dzero - Question 2 - Select One
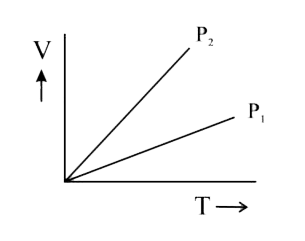
In V-T diagram shown in fig., what is the relation between P1andP2 ?
 AP2andP1BP2>P1CP1>P2DCannot say
 - Question 3 - Select One
Slope of the plot between V and P at constant temperature
AzeroB1C1//2D1√2
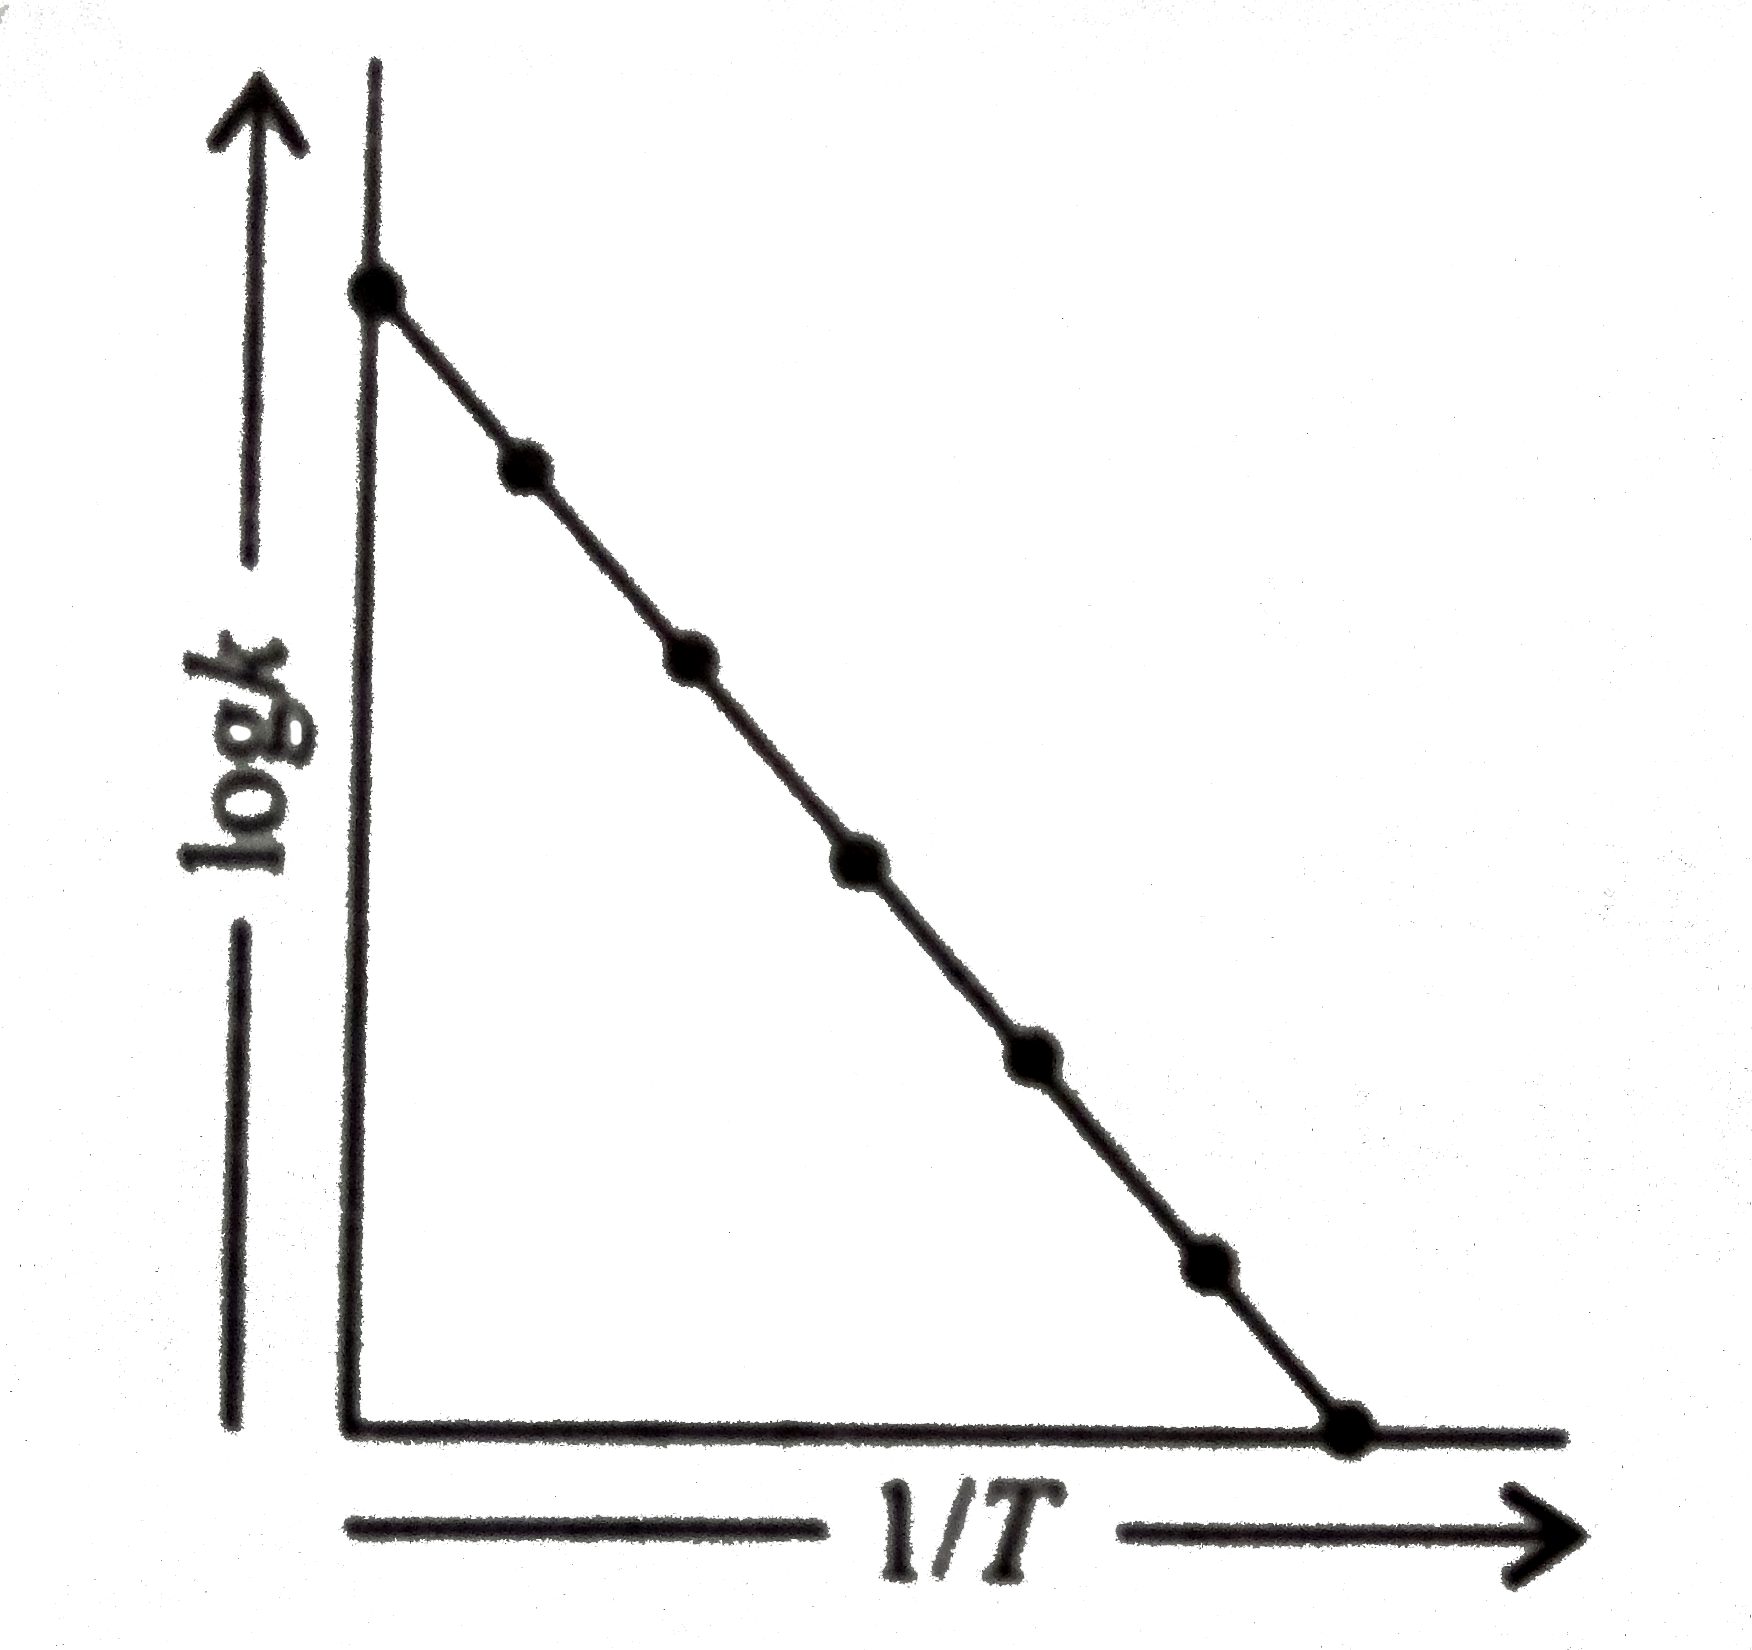
The temperature dependence of the rate constant k is expressed as k=Ae−Ea/RT
When a plot between logk and 1/T is plotted we get the graph as shown.

What is the value of slopw in the graph?View SolutionIn case of a curved mirror if the distance of object(u)and image (v) are measured from the pole and a graph is plotted between (1u) and(1/v) ,the graph is
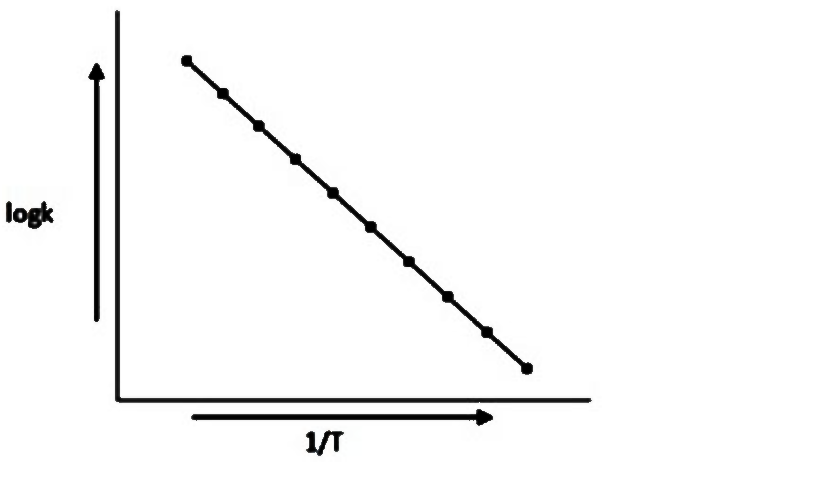
View SolutionWhen a plot between logk and 1/T is plotted we get the graph as shown.

What is the value of slope in the graph?View SolutionWhat do we get to know about the interior of the earth through mining?
View SolutionFor sperical mirros graph plotted between −1V and −1uis .
View Solution

