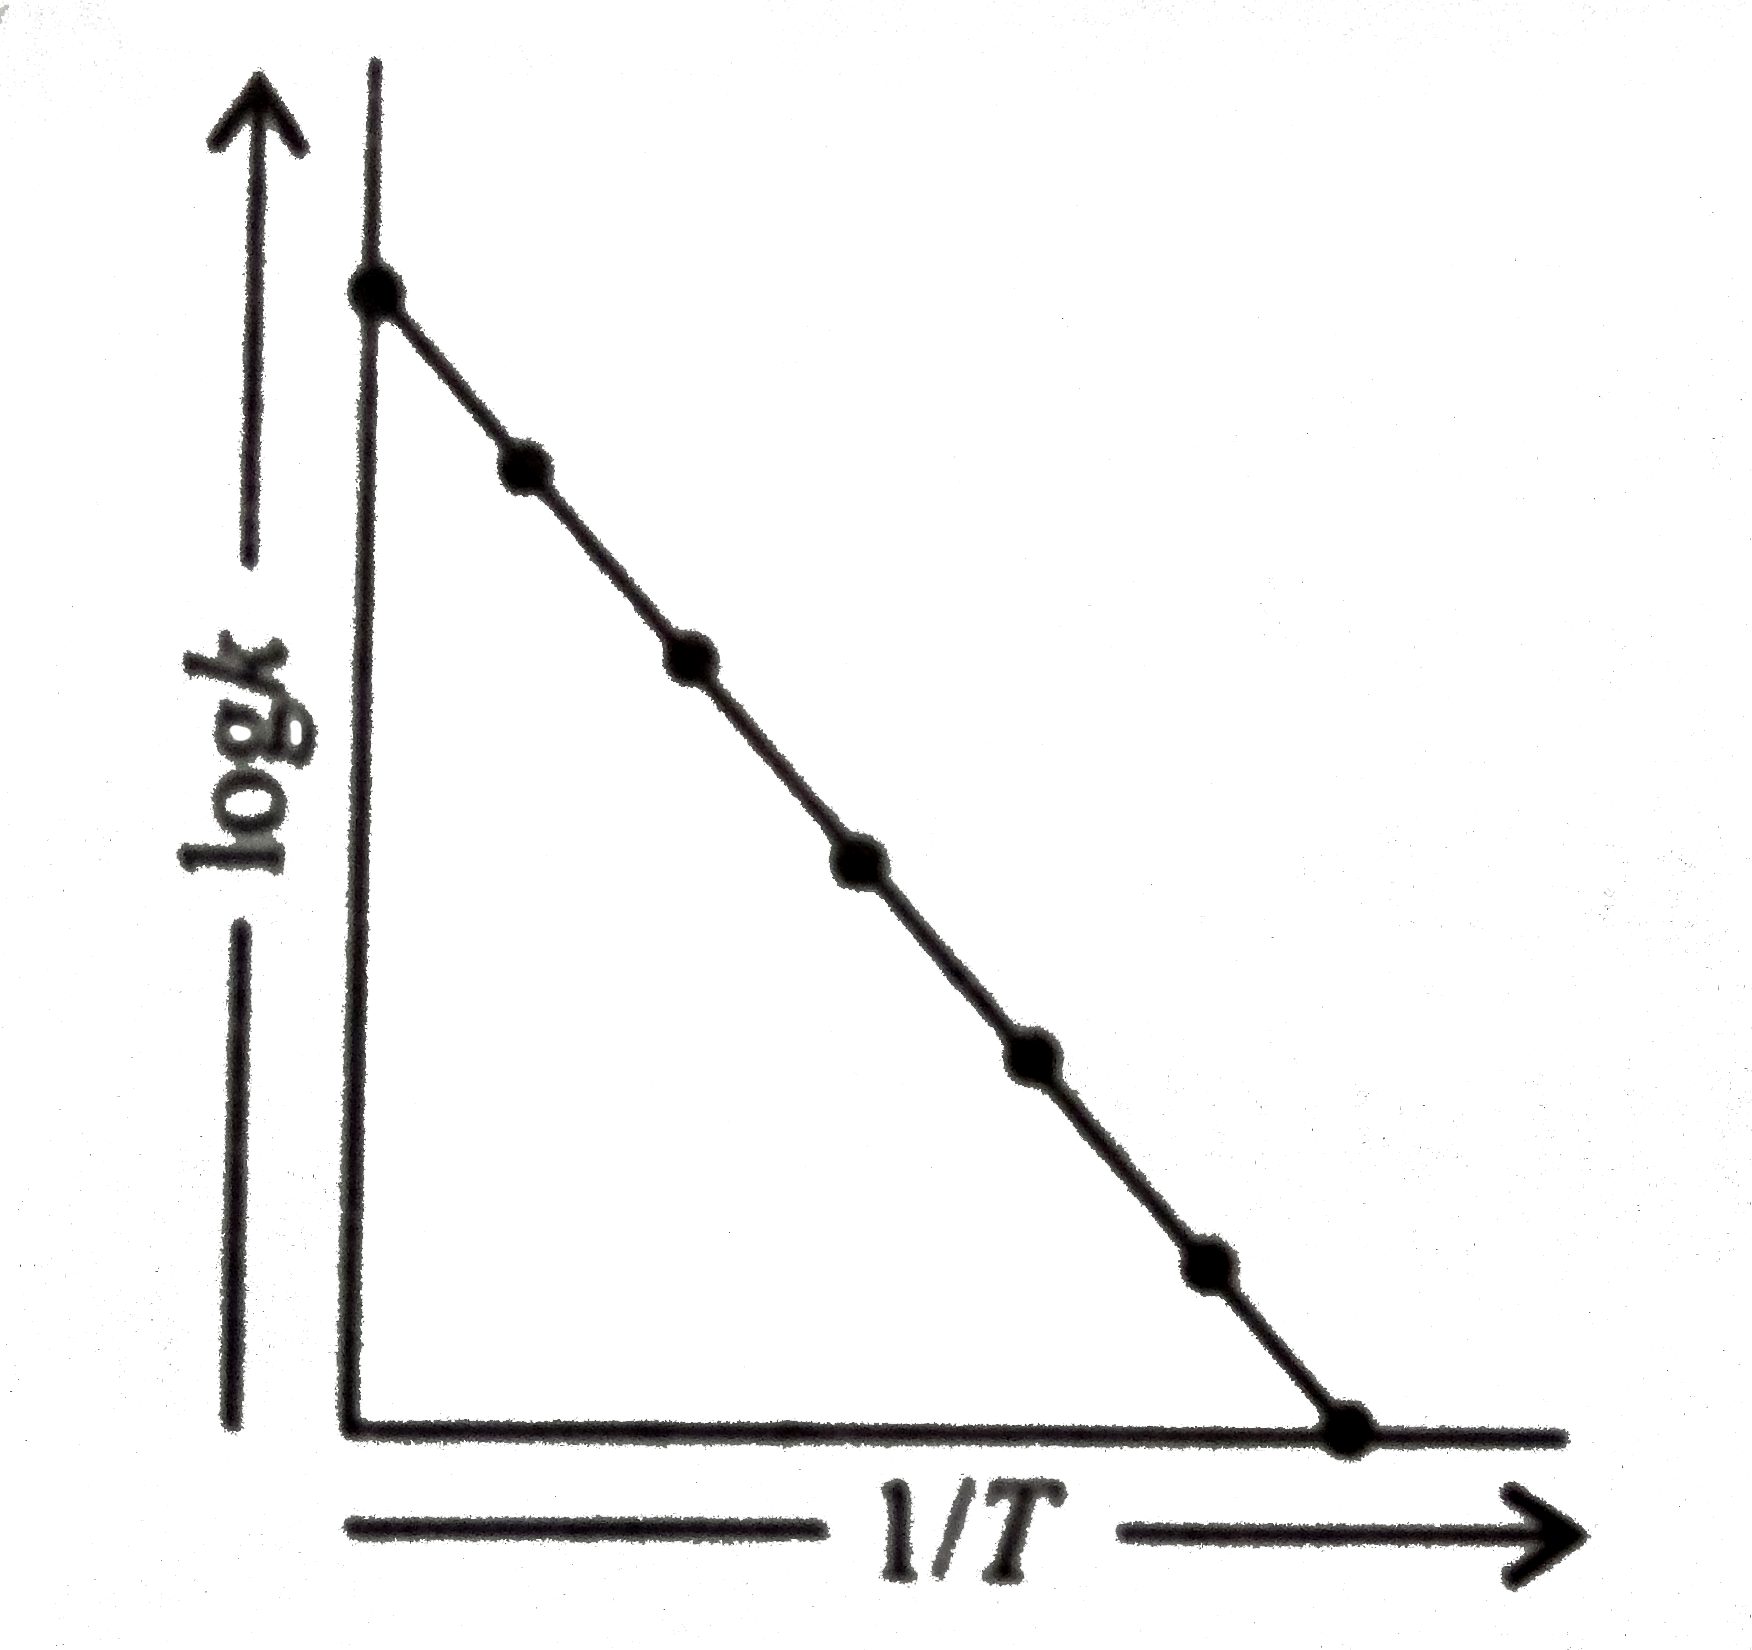
When a plot between logk and 1/T is plotted we get the graph as shown.
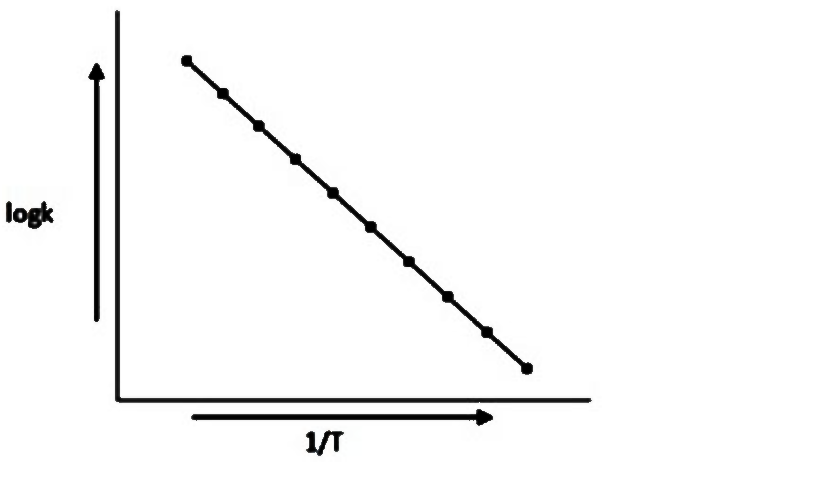
What is the value of slope in the graph?
EaRT
−Ea2.303R
−Ea2.303RTlogA
−Ea2.303RT
The correct Answer is:B
Step by step video & image solution for When a plot between logk and 1/T is plotted we get the graph as shown. What is the value of slope in the graph? by Chemistry experts to help you in doubts & scoring excellent marks in Class 12 exams.
Updated on:21/07/2023Topper's Solved these Questions
Similar Questions
Knowledge Check
A graph plotted between log k vs 1T is represented by
A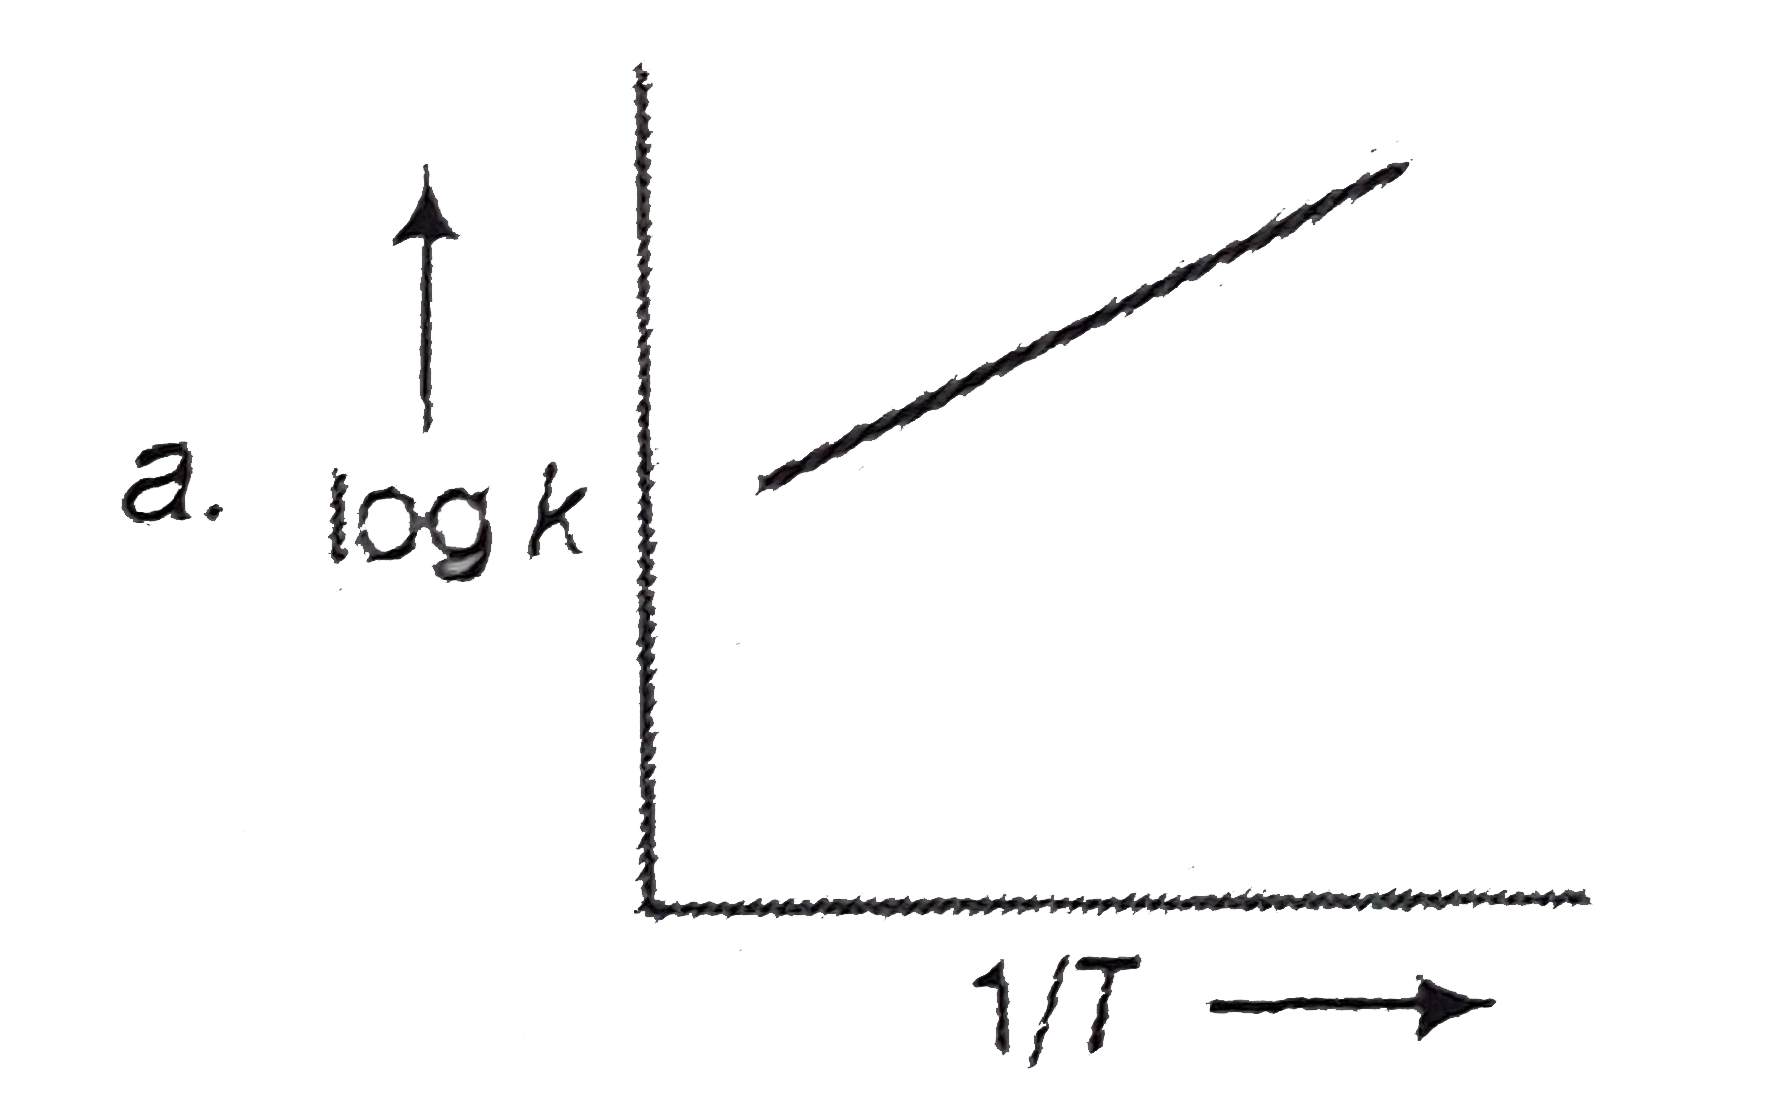 B
B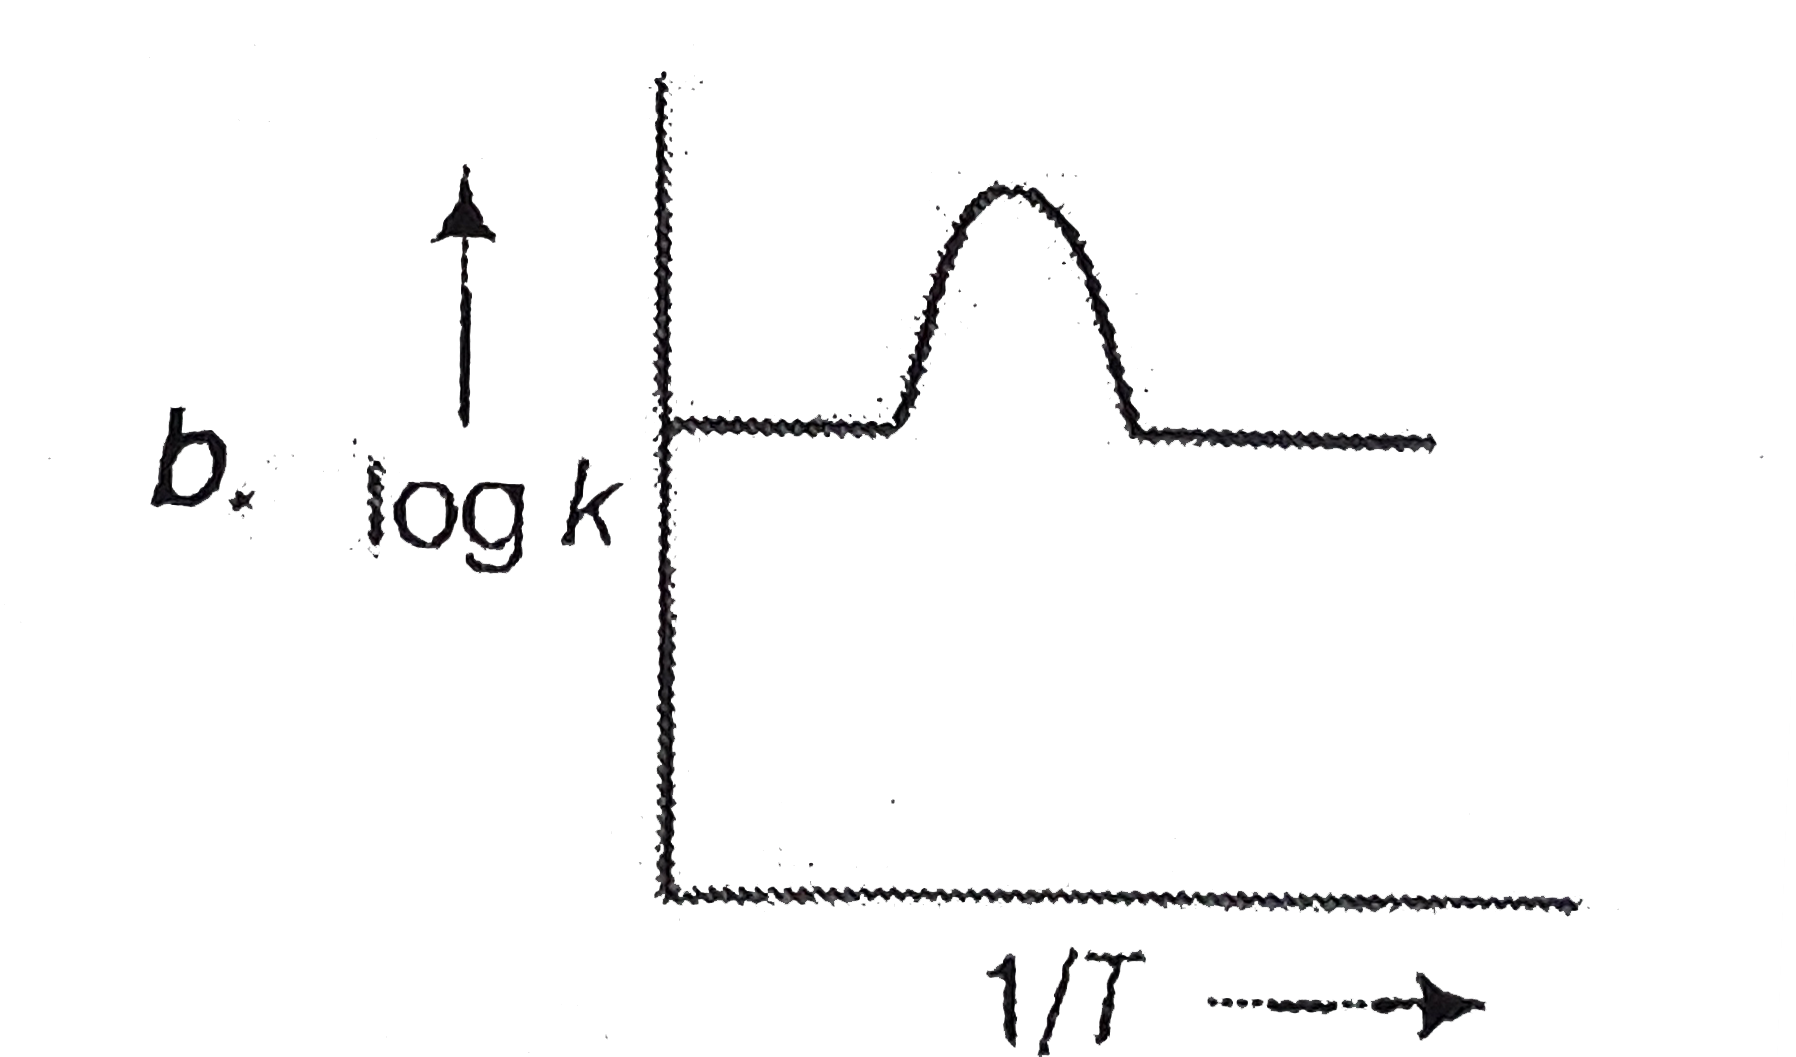 C
C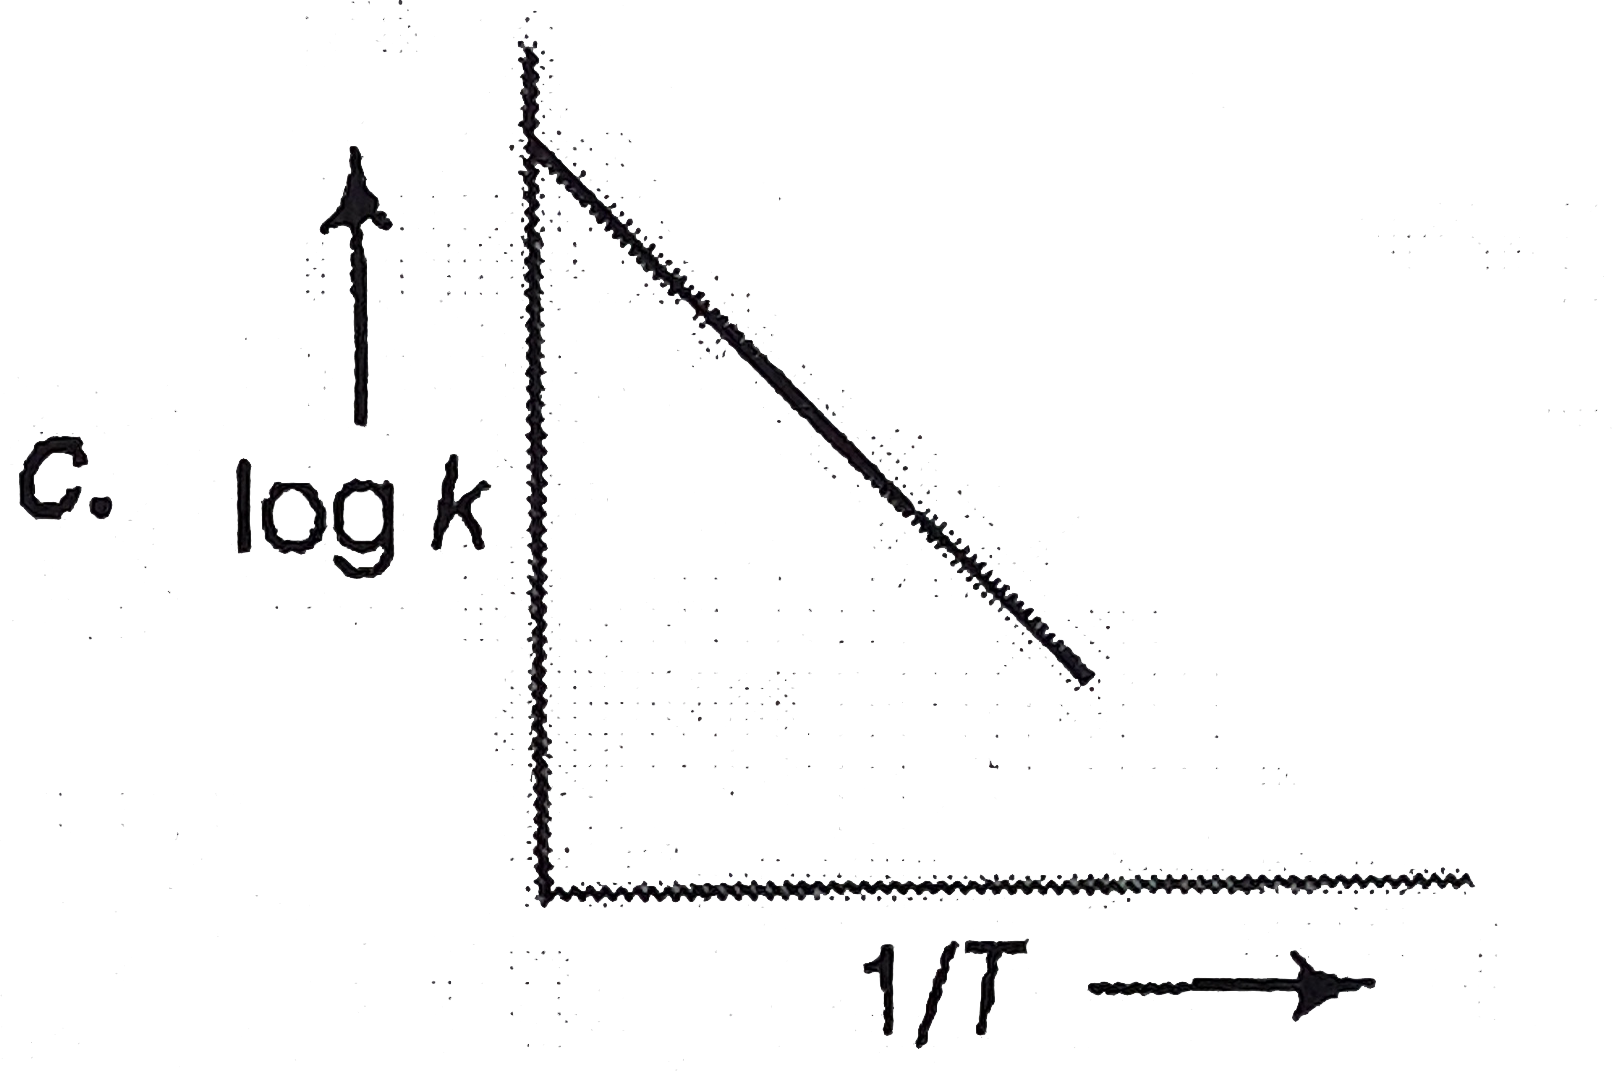 D
D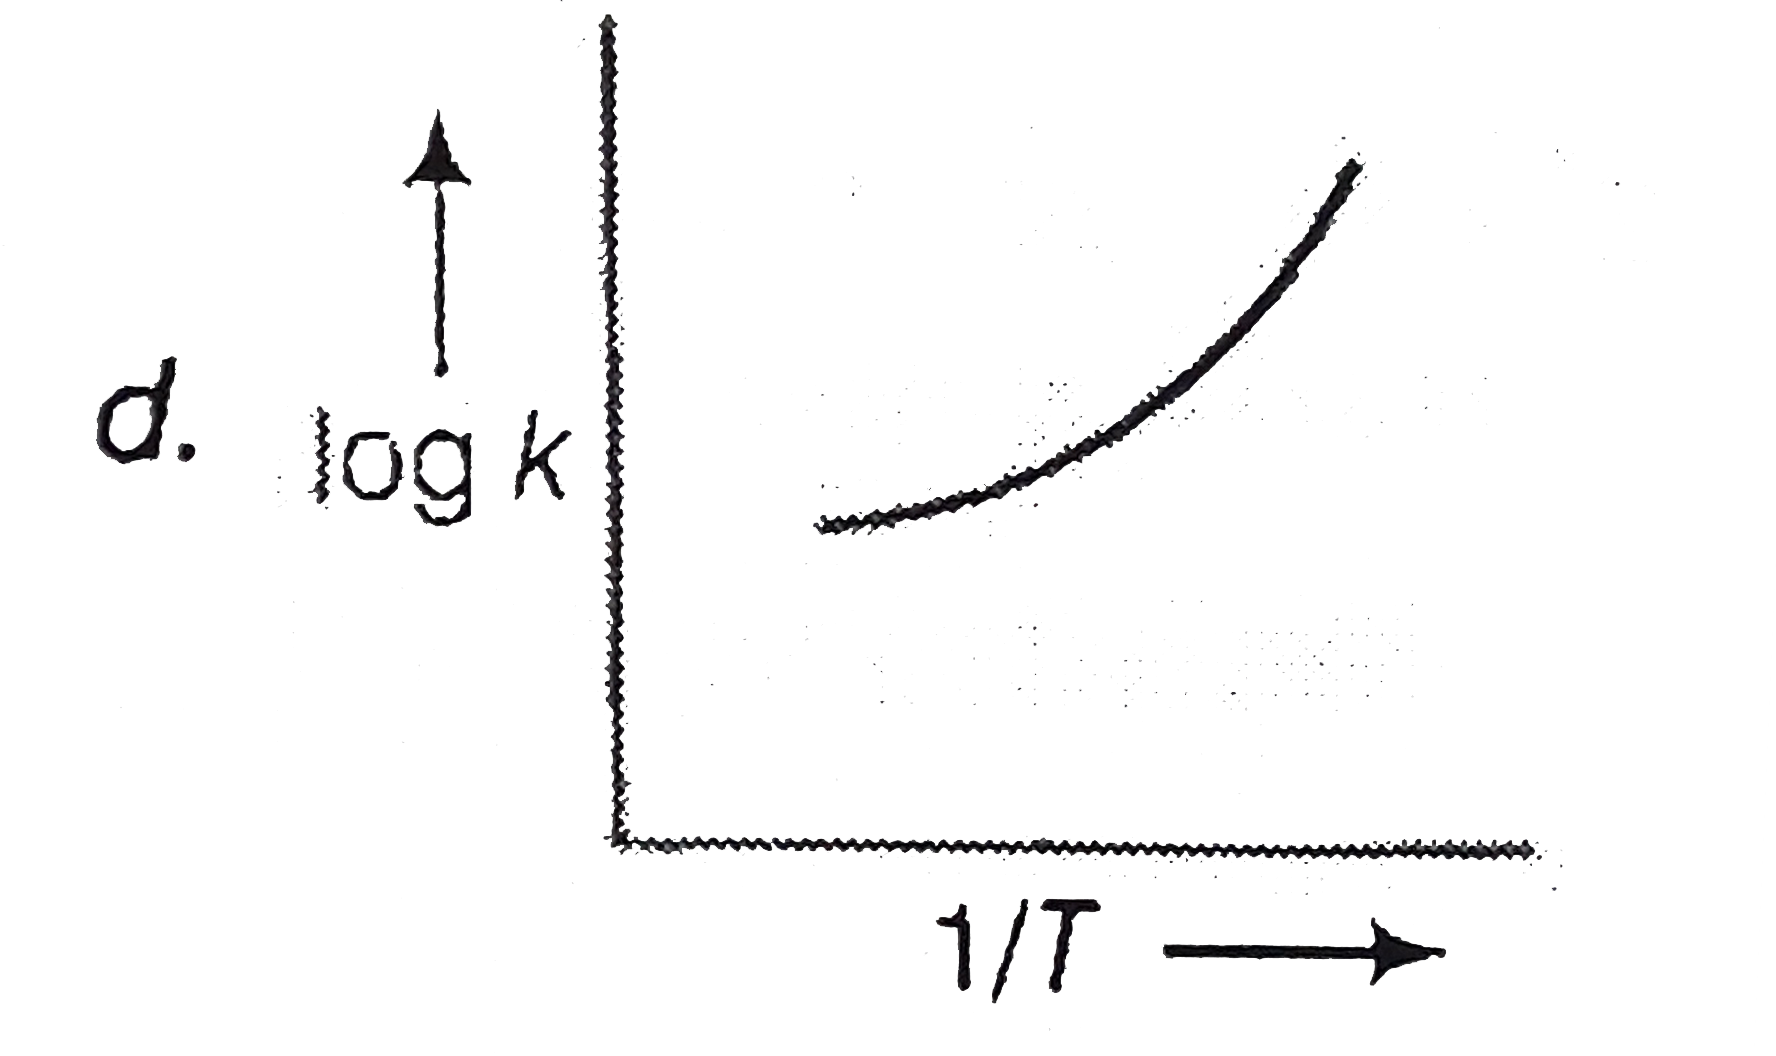
For a planet, the graph of T2 against r3 is plotted. The slope of the graph is
A4πGMB4π2GMCGM4π2DGM4πIf we plot a graph between force and time, the area under the curve and time - axis gives the value of
Aforce per unit timeBaverage forceCimpulseDrate of change of momentum
If a graph is plotted between 1/v and 1/u , which one of the graph shown in figure is approximately correct ?
View SolutionIn Searl's experiment a graph is plotted between
View SolutionAt constant temperature if a graph plotted between logP and log(1V) has an intercept of unity then what will be the value of constant (k)
View SolutionThe value of the specific rate constant, k, for a reaction is determined at two different temperatures and plotted in the accompanying graph. What is the relationship between the slope of the graph and the activation energy, Ea?
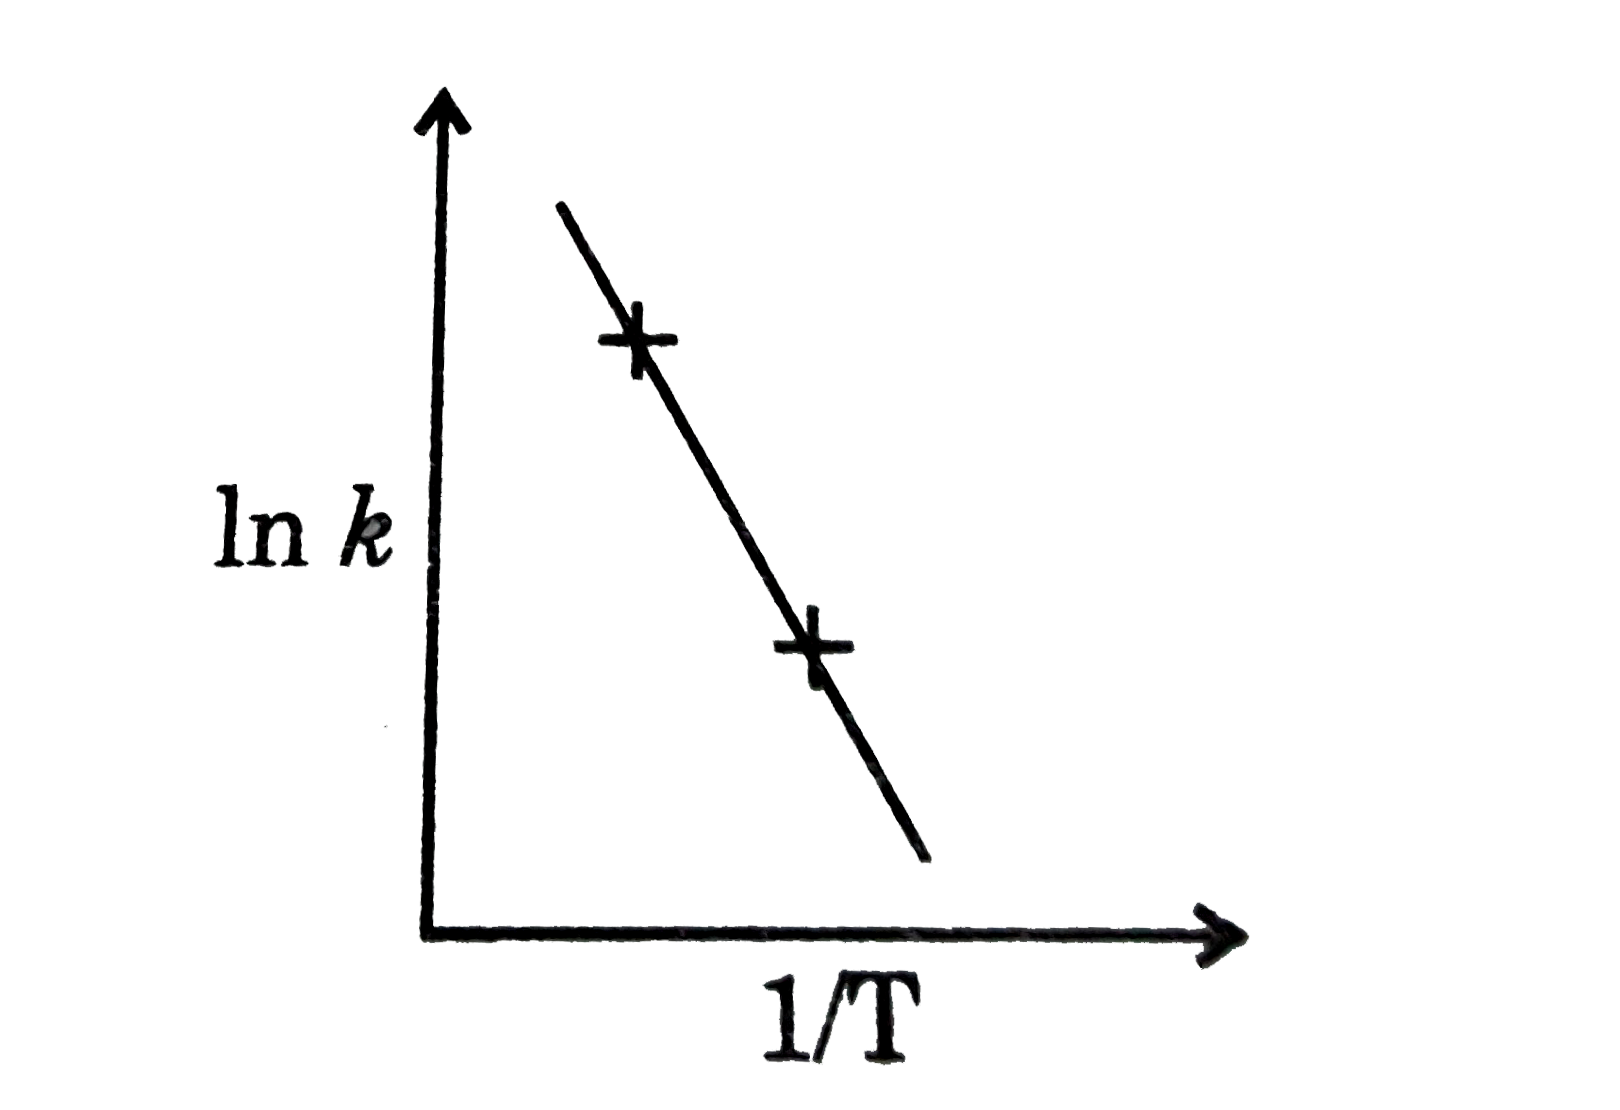
View SolutionIf a graph is plotted between ln k and 1/T for the first order reaction, the slope of the straight line so obtained is given by
View Solution

