For sperical mirros graph plotted between −1V and −1uis .
A
stright line with slope 1
B
straight line with slope -1
C
Parabola
D
none
Video Solution
Text Solution
The correct Answer is:B
|
Answer
Step by step video, text & image solution for For sperical mirros graph plotted between - (1)/(V) and -(1)/(u)is . by Physics experts to help you in doubts & scoring excellent marks in Class 12 exams.
Updated on:21/07/2023
Topper's Solved these Questions
- BOOK - RESONANCECHAPTER - EXPERIMENTAL PHYSICSEXERCISE - Exercise -1 PART1videos
EXPERIMENTAL PHYSICS
- BOOK - RESONANCECHAPTER - EXPERIMENTAL PHYSICSEXERCISE - PART II13videos
EXPERIMENTAL PHYSICS
- BOOK - RESONANCECHAPTER - EXPERIMENTAL PHYSICSEXERCISE - PART -II10videos
EXPERIMENTAL PHYSICS
- BOOK - RESONANCECHAPTER - ELECTROSTATICSEXERCISE - HLP39videos
ELECTROSTATICS
- BOOK - RESONANCECHAPTER - GEOMATRICAL OPTICS EXERCISE - Advance level Problems35videos
GEOMATRICAL OPTICS
Similar Questions
Knowledge Check
- Question 1 - Select One
For a concave mirror, if real image is formed the graph between 1u and 1v is of the form
A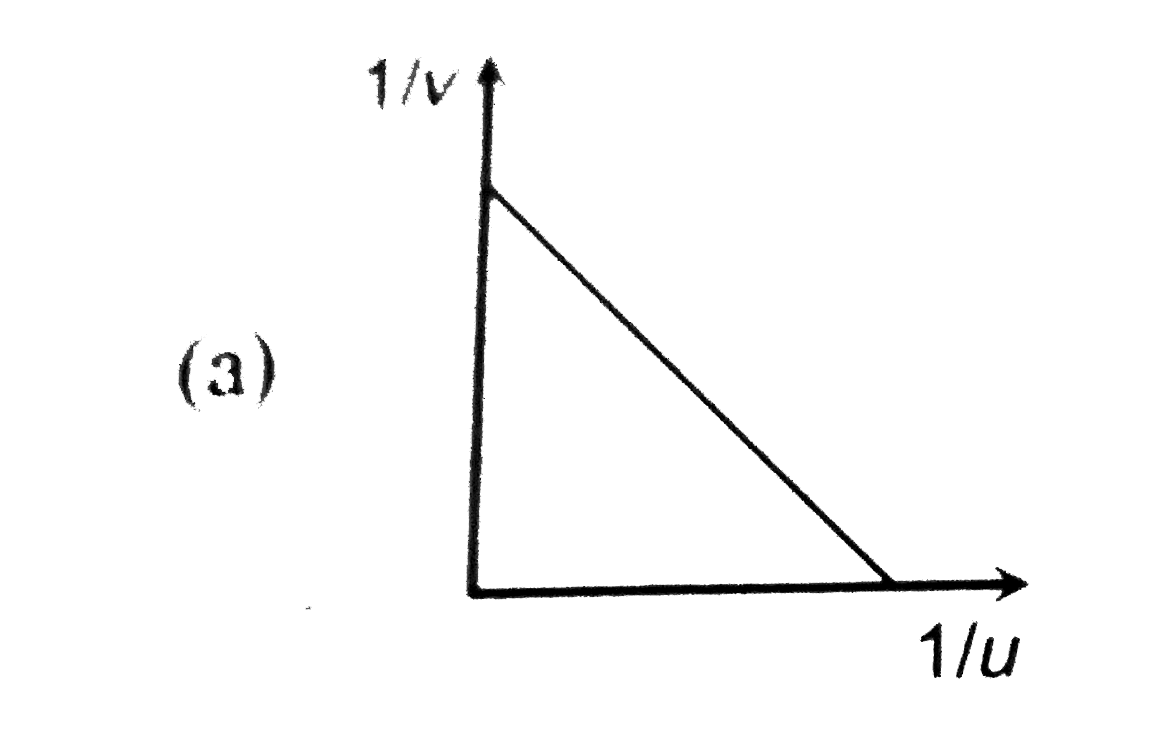 B
B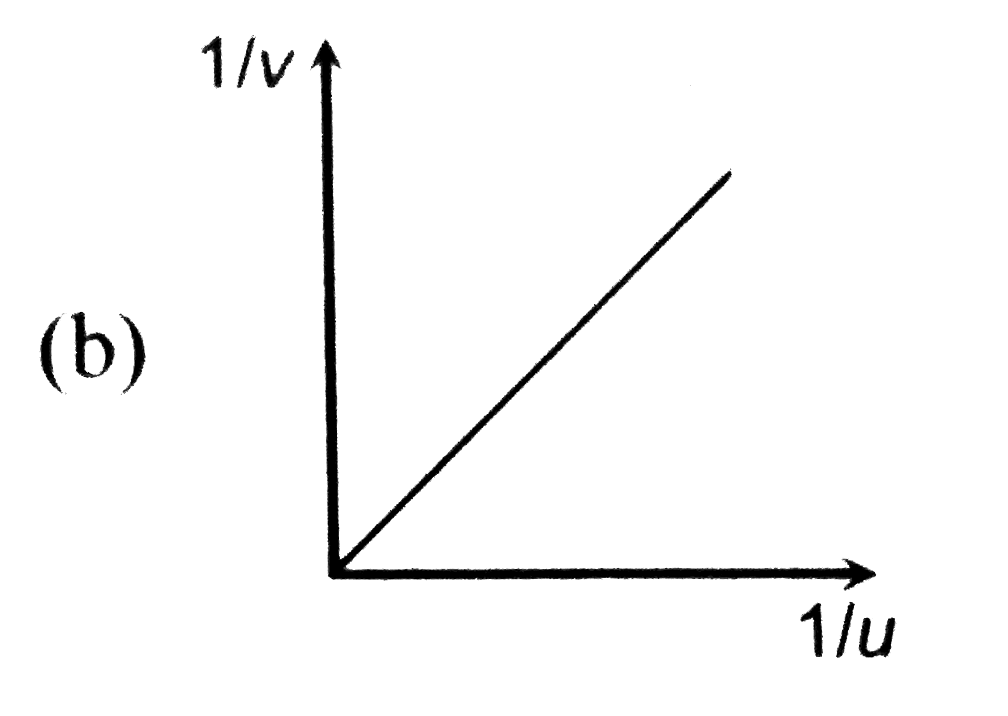 C
C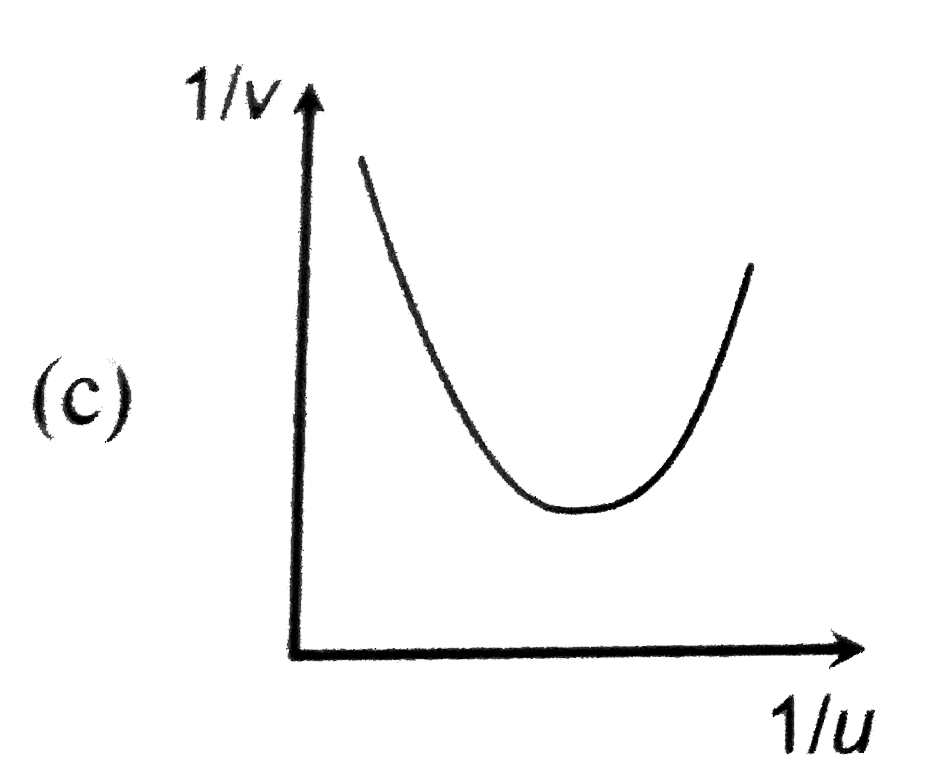 D
D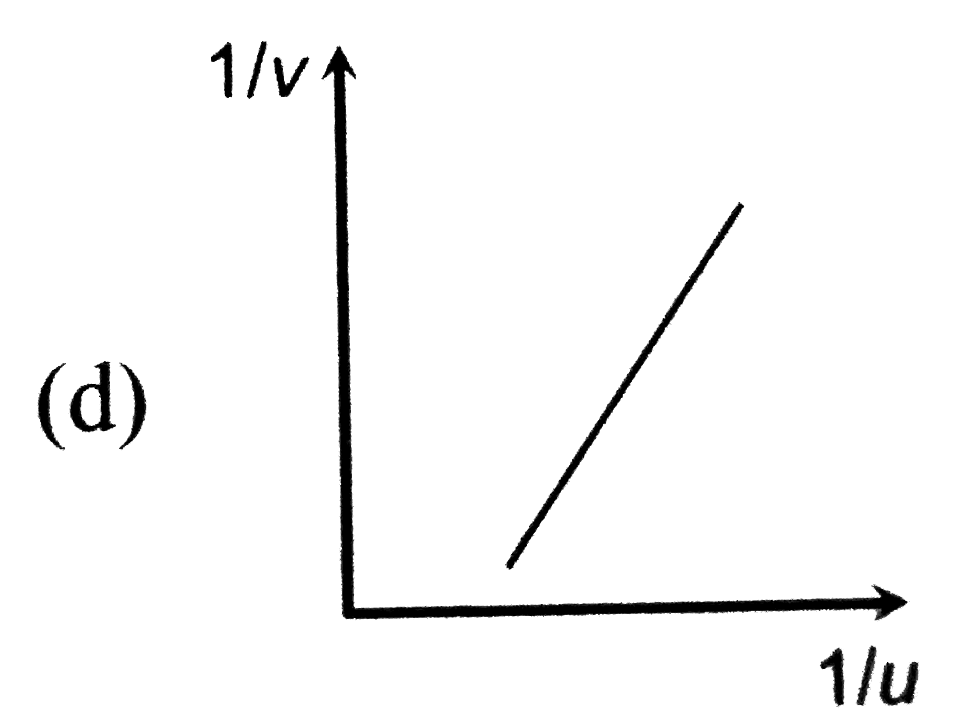
- Question 2 - Select One
A graph plotted between log k vs 1T is represented by
A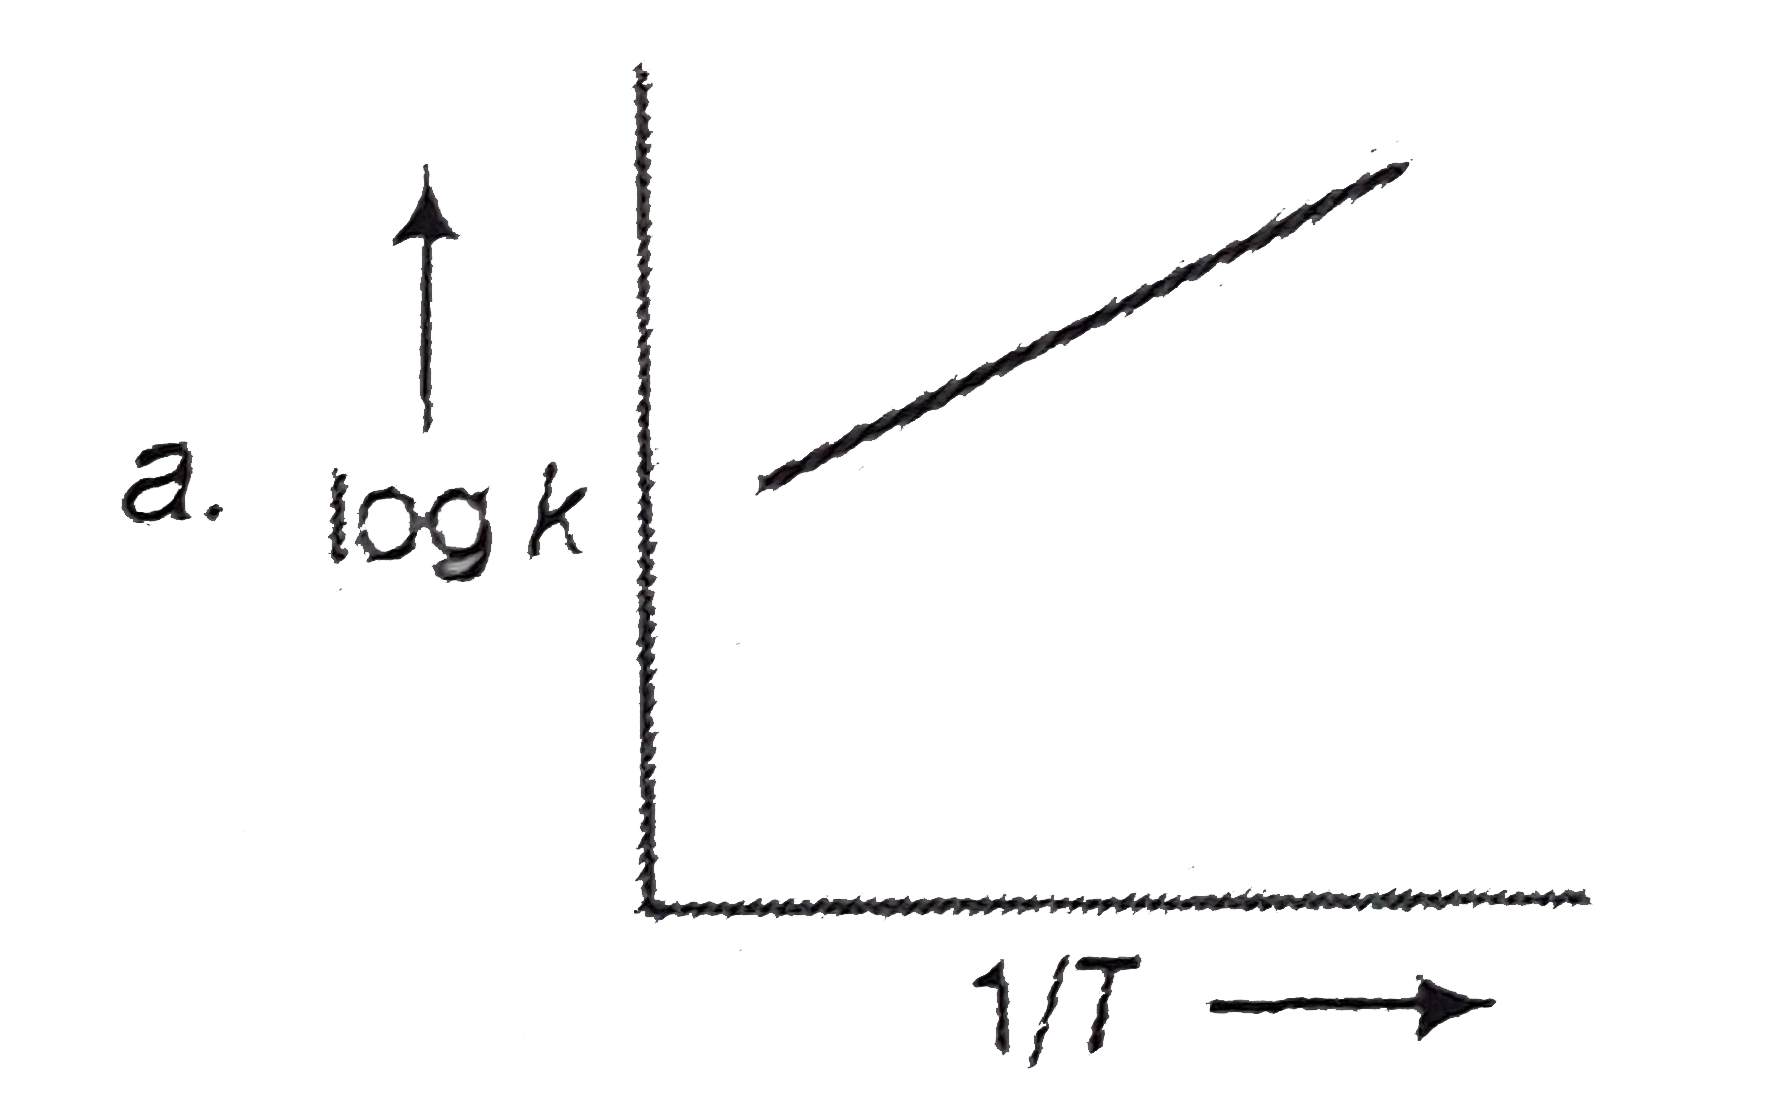 B
B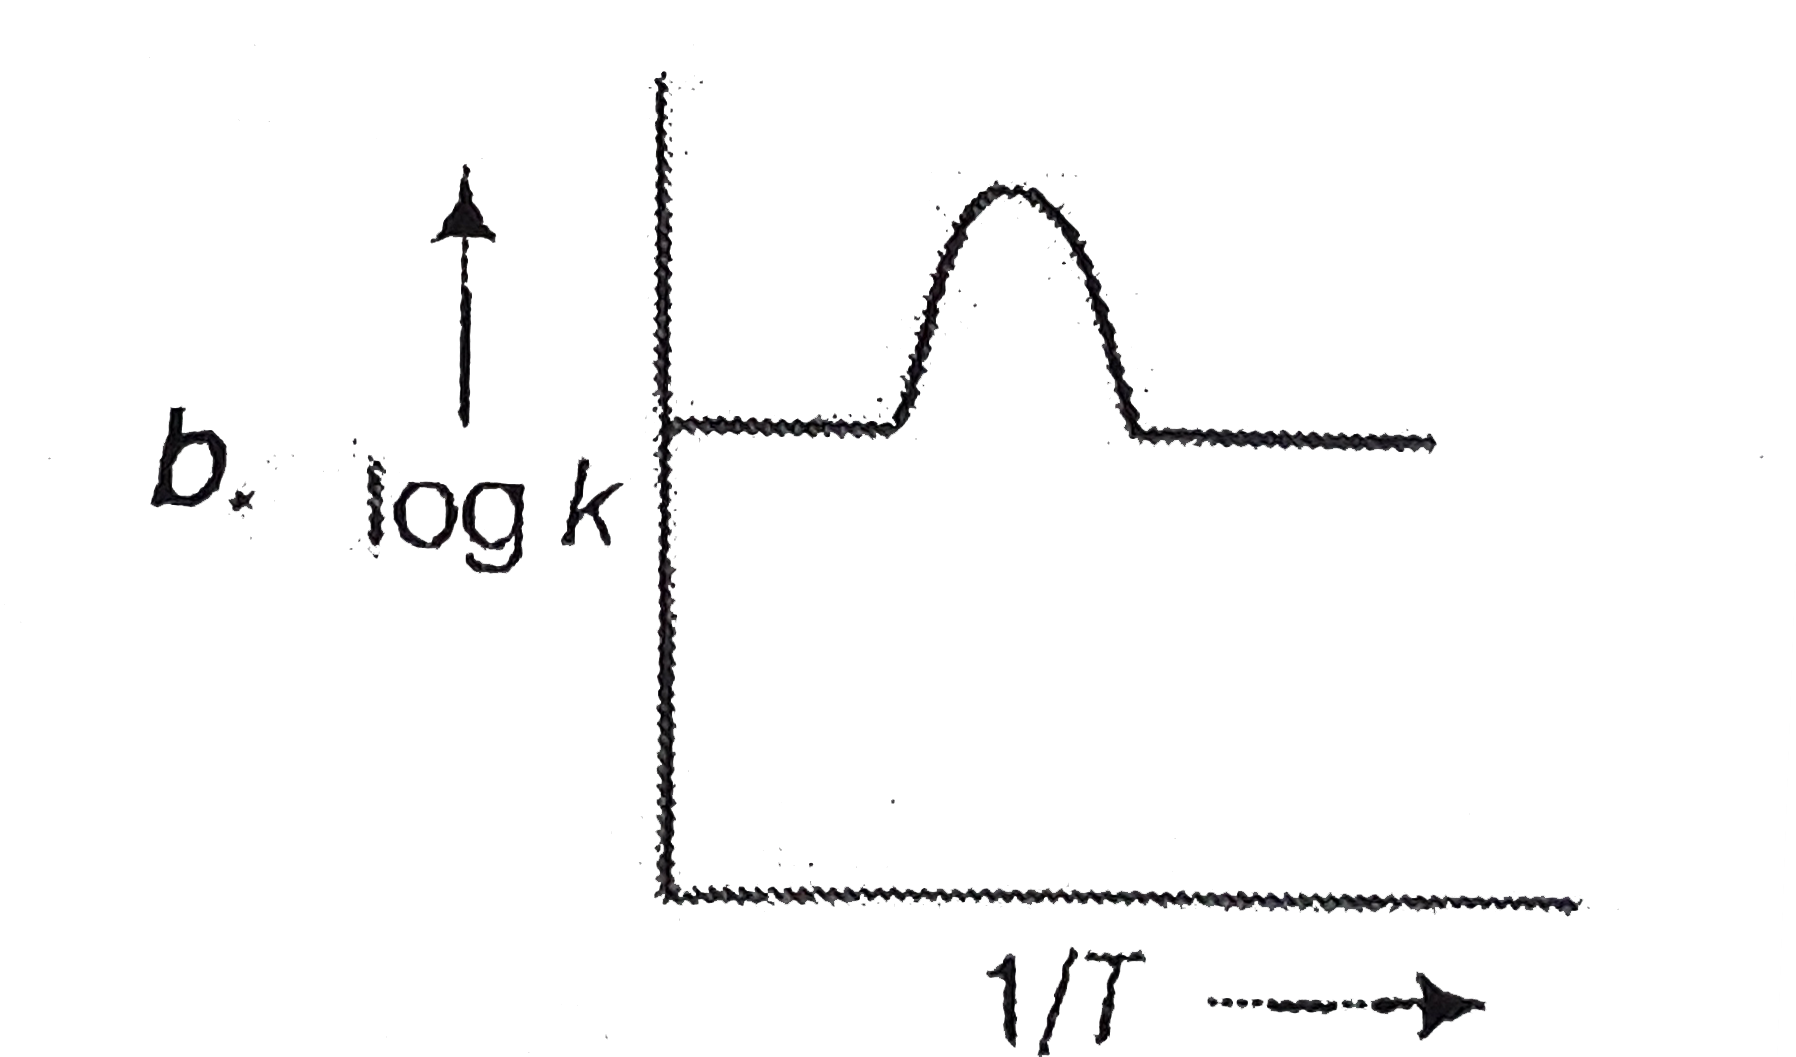 C
C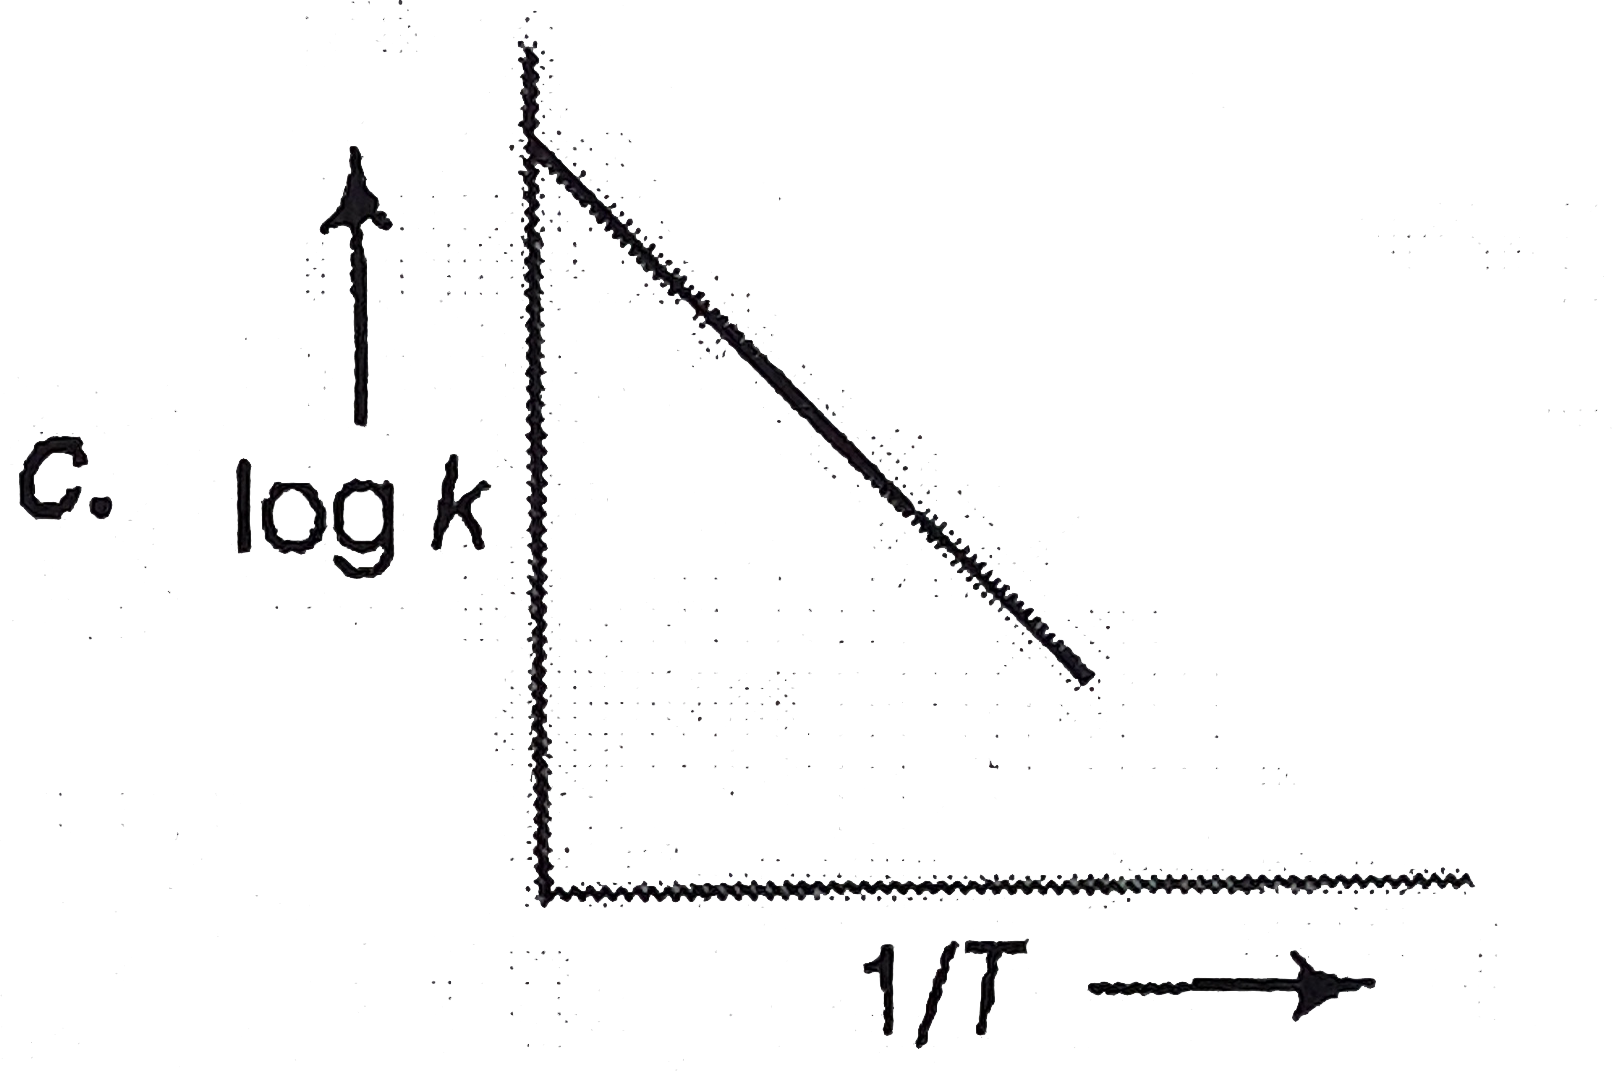 D
D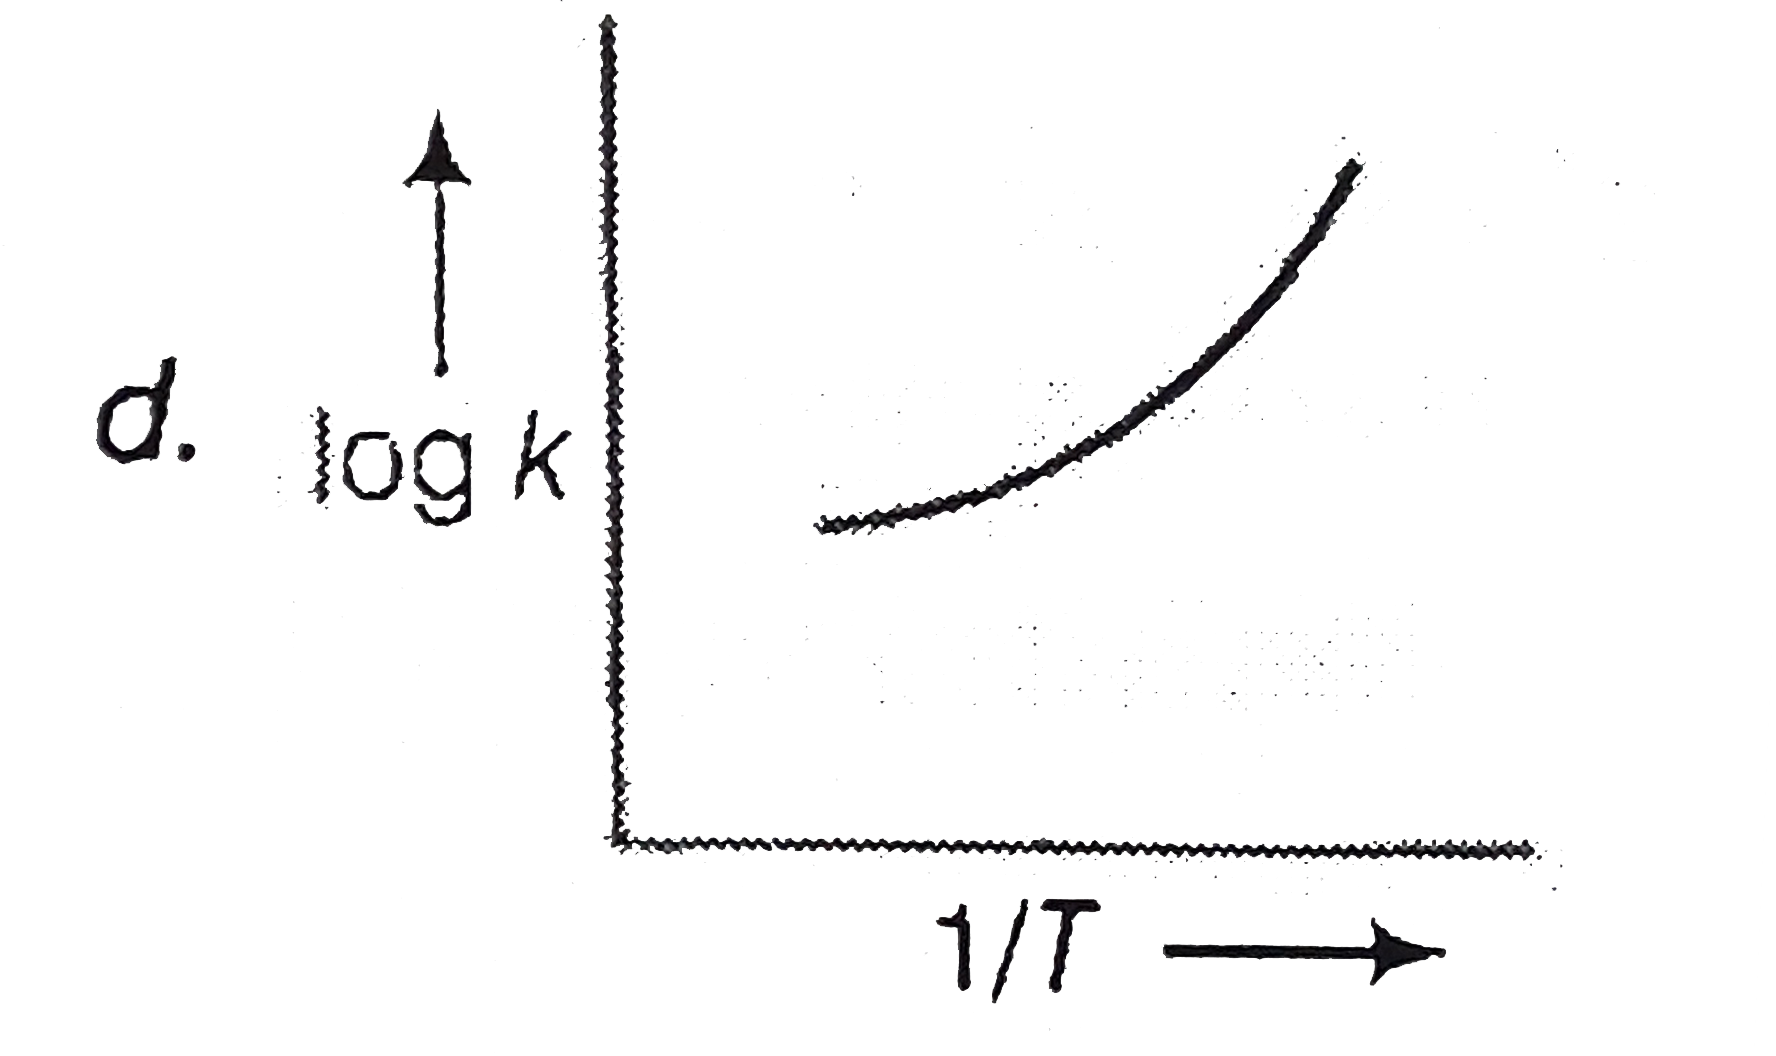
- Question 3 - Select One
At constant temperature if a graph plotted between logP and log(1V) has an intercept of unity then what will be the value of constant (k)
A1B10C100D1000
In Searl's experiment a graph is plotted between
View SolutionThe graph between 1v and 1u for a concave mirror looks like.
View SolutionThe graph between E and v is
View SolutionUnder constant pressure, graph between p and 1V is a
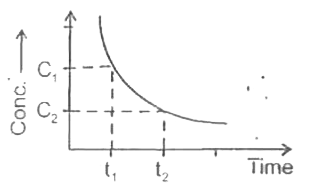
View SolutionThe graph plotted between concentration versus time
 View Solution

