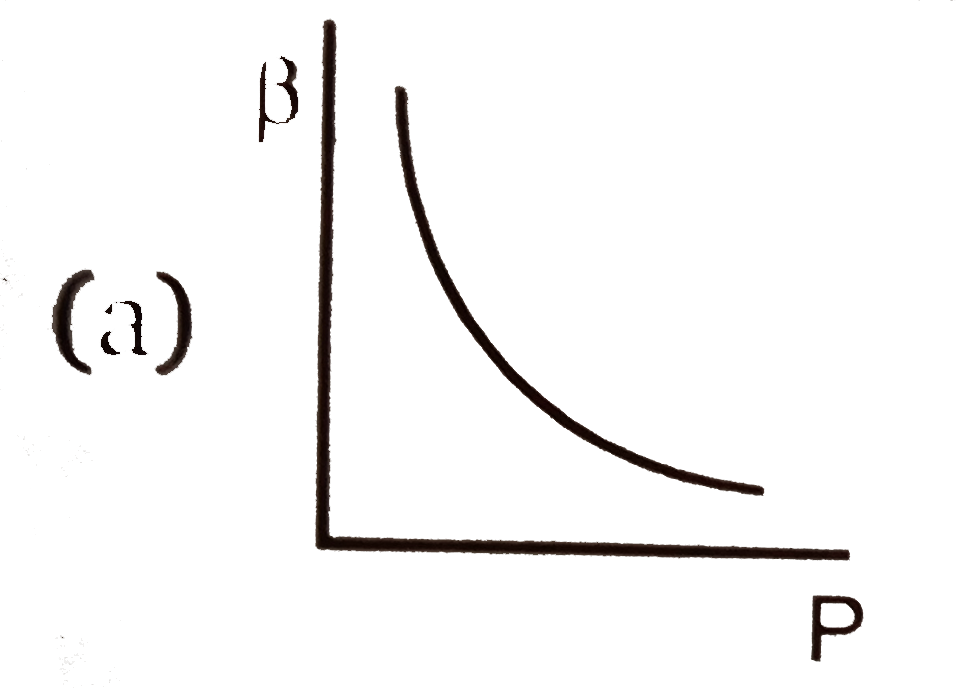
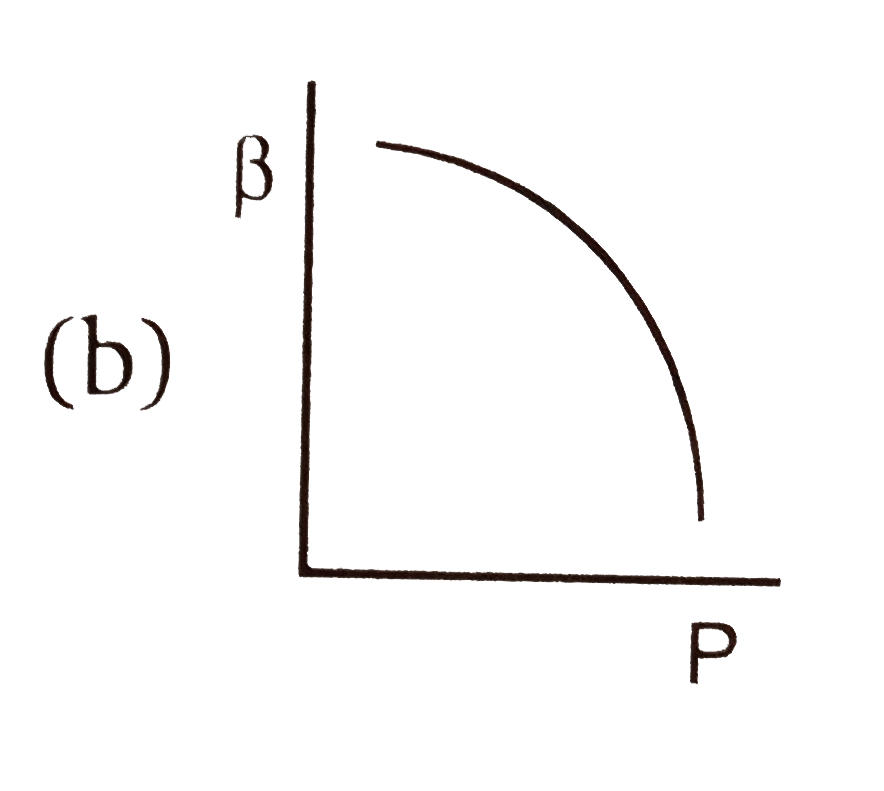
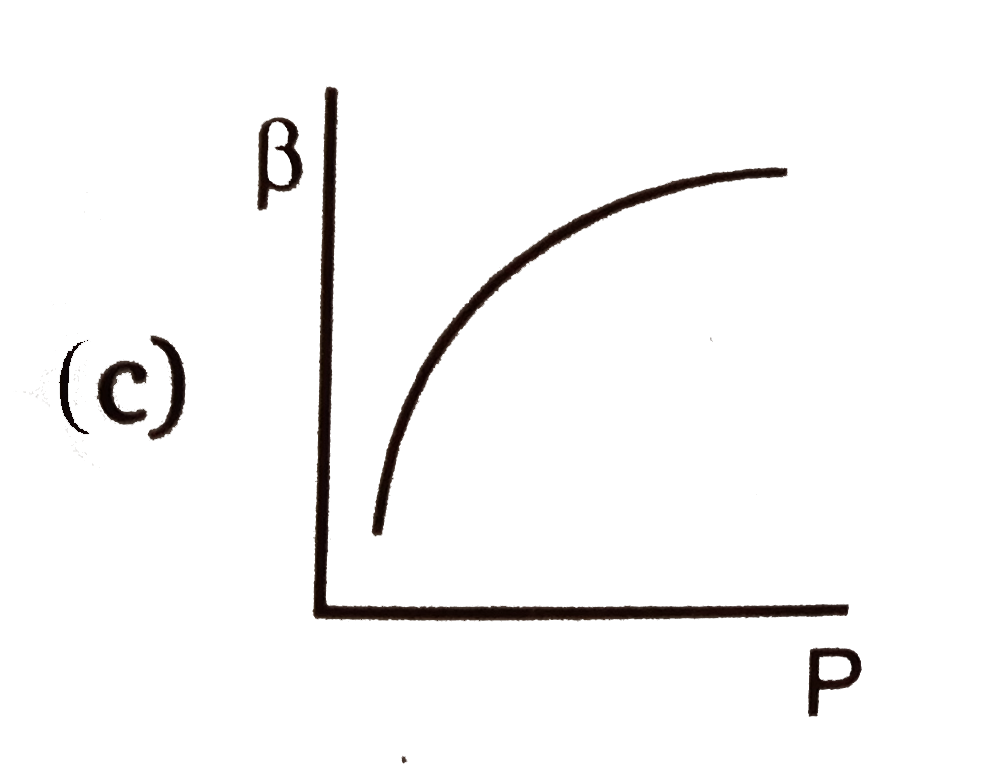
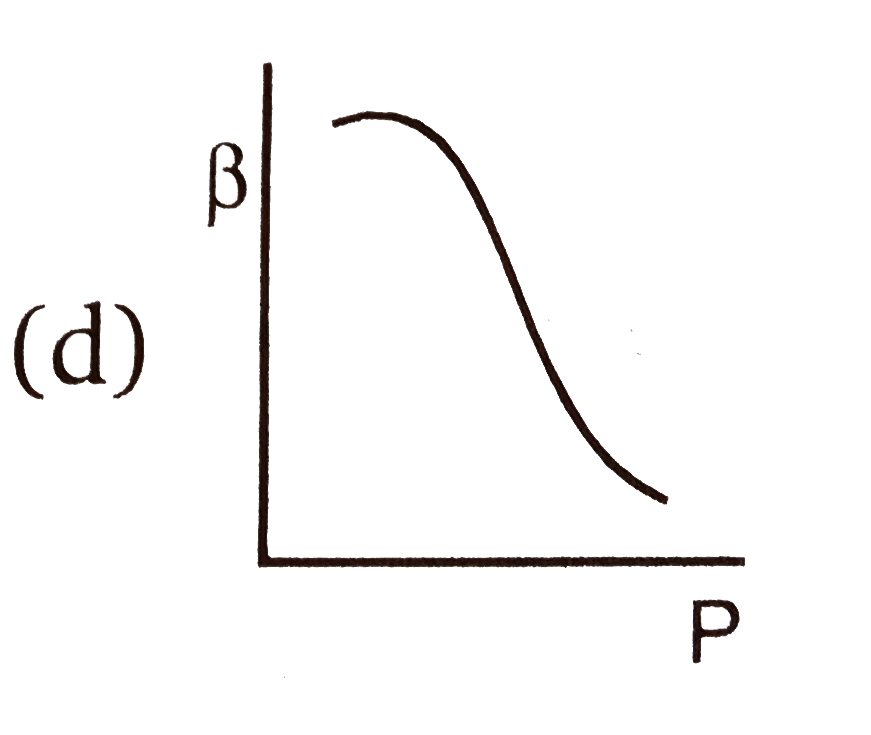
which of the following graphs correctly represents the vatiation β=−(dVdP)T/V with P for an ideal gas at constant temperature ? .
A
B
C
D
Video Solution
Text Solution
From PV=RT,dV.P=v.dP=0
or (dVdP)=−VP
or β=(−dVdP)T/V=1P
Thus plot of β vs P given (a) .
|
Topper's Solved these Questions
- GASEOUS STATEBOOK - P BAHADURCHAPTER - GASEOUS STATEEXERCISE - Exercise B
1 Videos
- GASEOUS STATEBOOK - P BAHADURCHAPTER - GASEOUS STATEEXERCISE - Exercise 4
1 Videos
- GASEOUS STATEBOOK - P BAHADURCHAPTER - GASEOUS STATEEXERCISE - Exercise 3
1 Videos
- CHEMICAL EQUILIBRIUMBOOK - P BAHADURCHAPTER - CHEMICAL EQUILIBRIUMEXERCISE - Exercise
134 Videos
- IONIC EQUILIBRIUMBOOK - P BAHADURCHAPTER - IONIC EQUILIBRIUMEXERCISE - Exercise
85 Videos
Similar Questions
Knowledge Check
Which of the following graphs correctly represents the variation of β=−(dVdP)1V with P for an ideal gas at constant temperature ?
A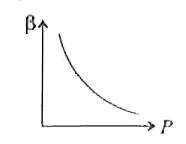 B
B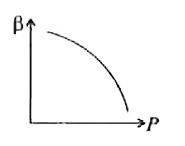 C
C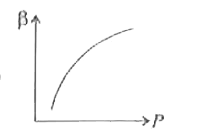 D
D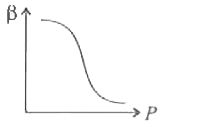
Which of the following graphs correctly represents the variation of β=−(dVdP)/V with P for an ideal gas at constant temperature
A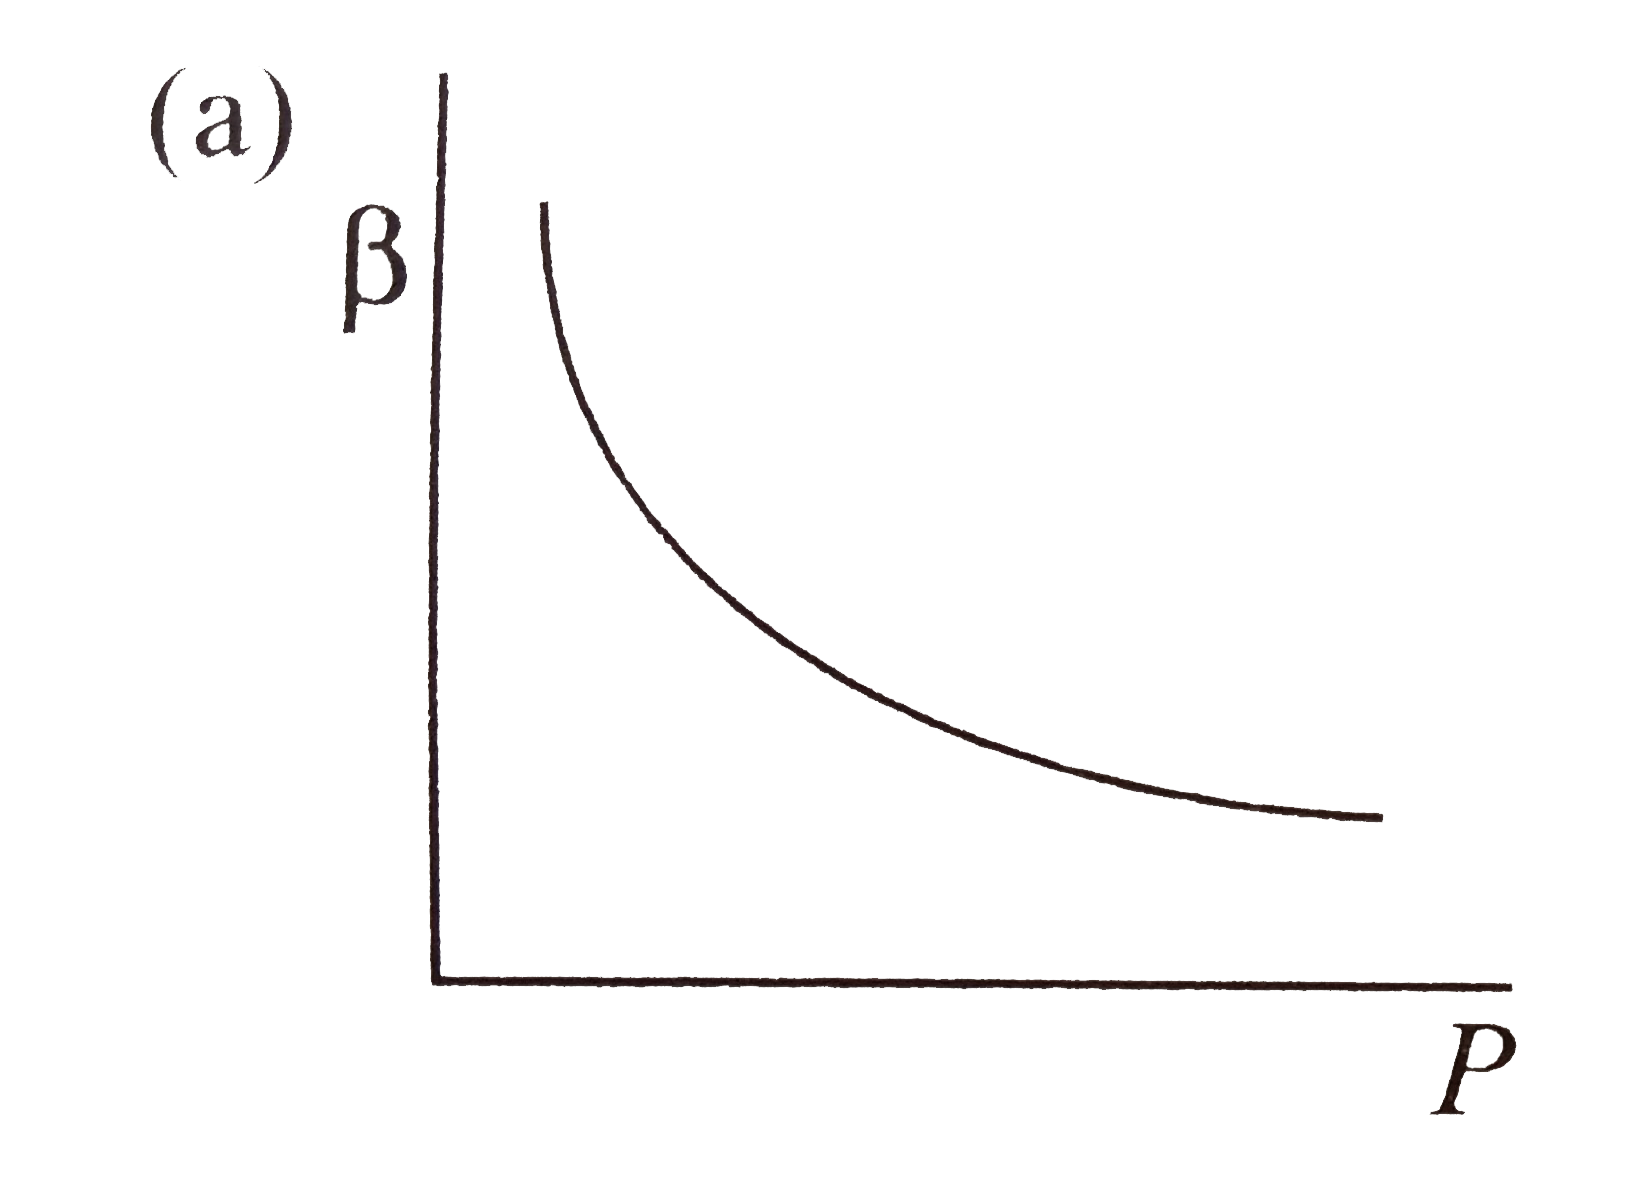 B
B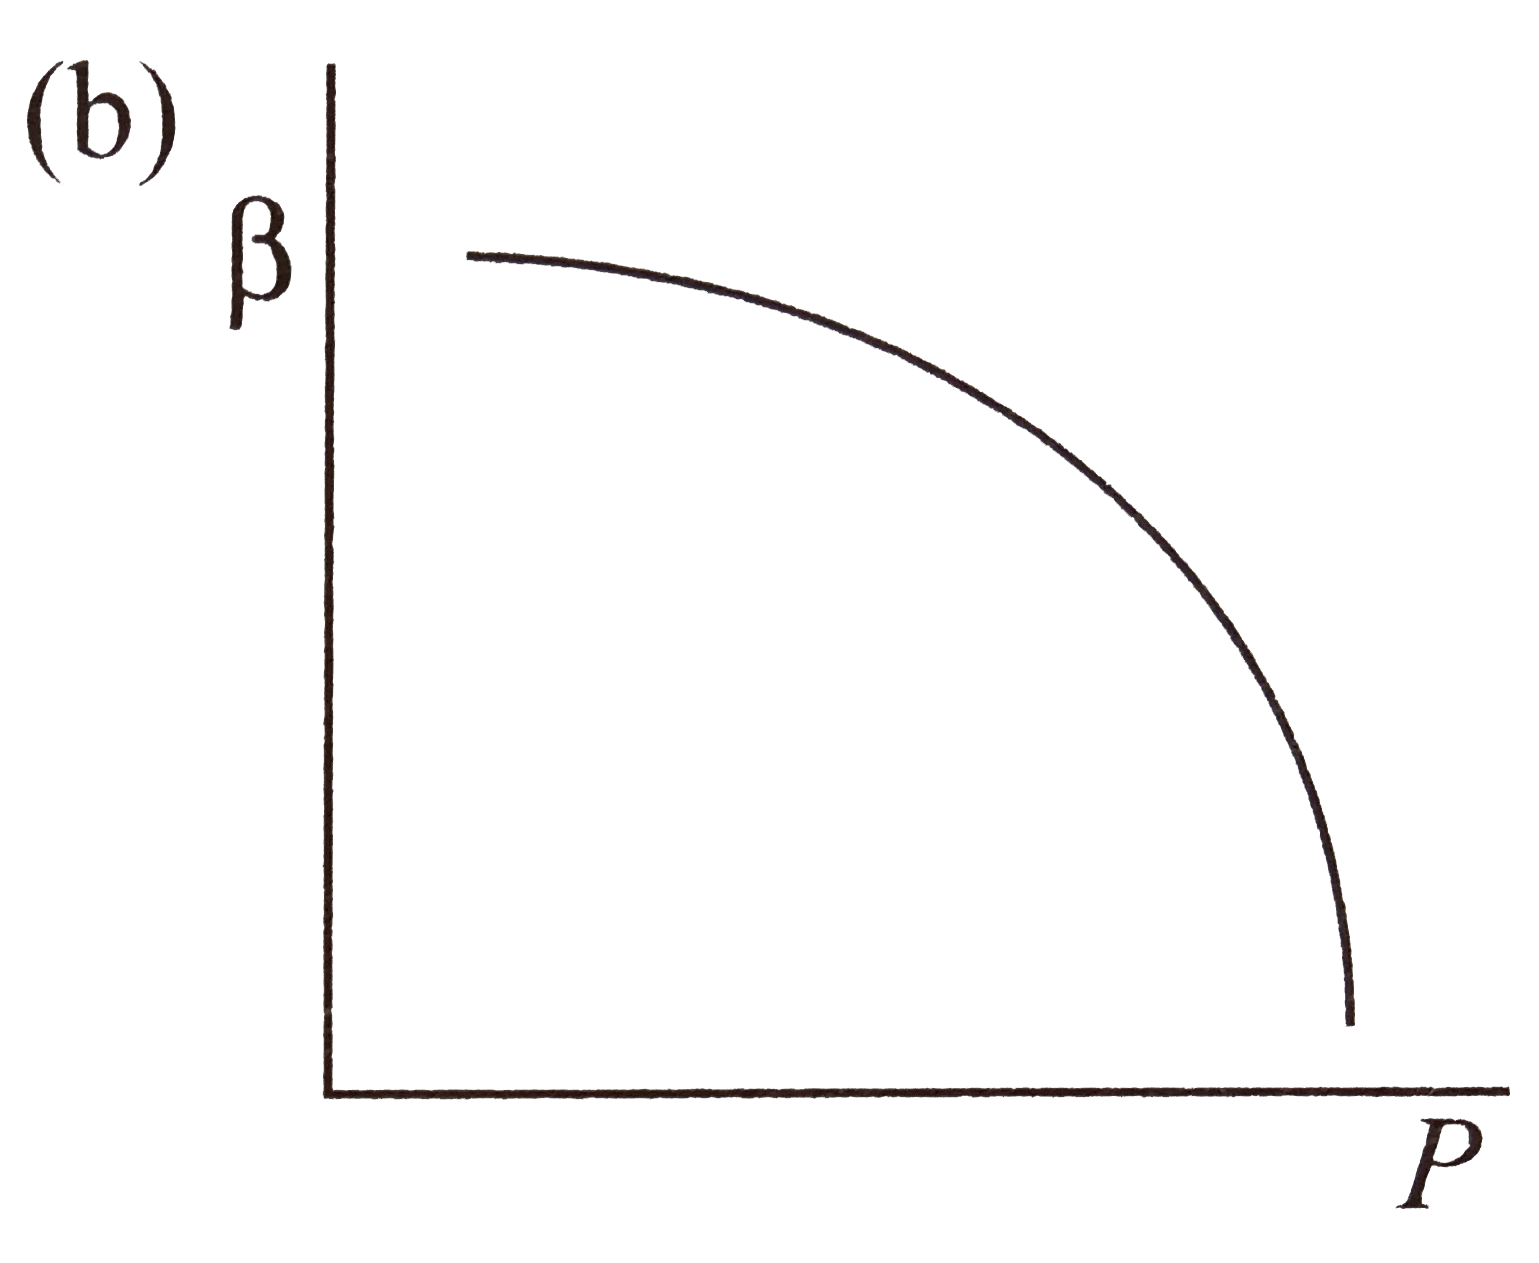 C
C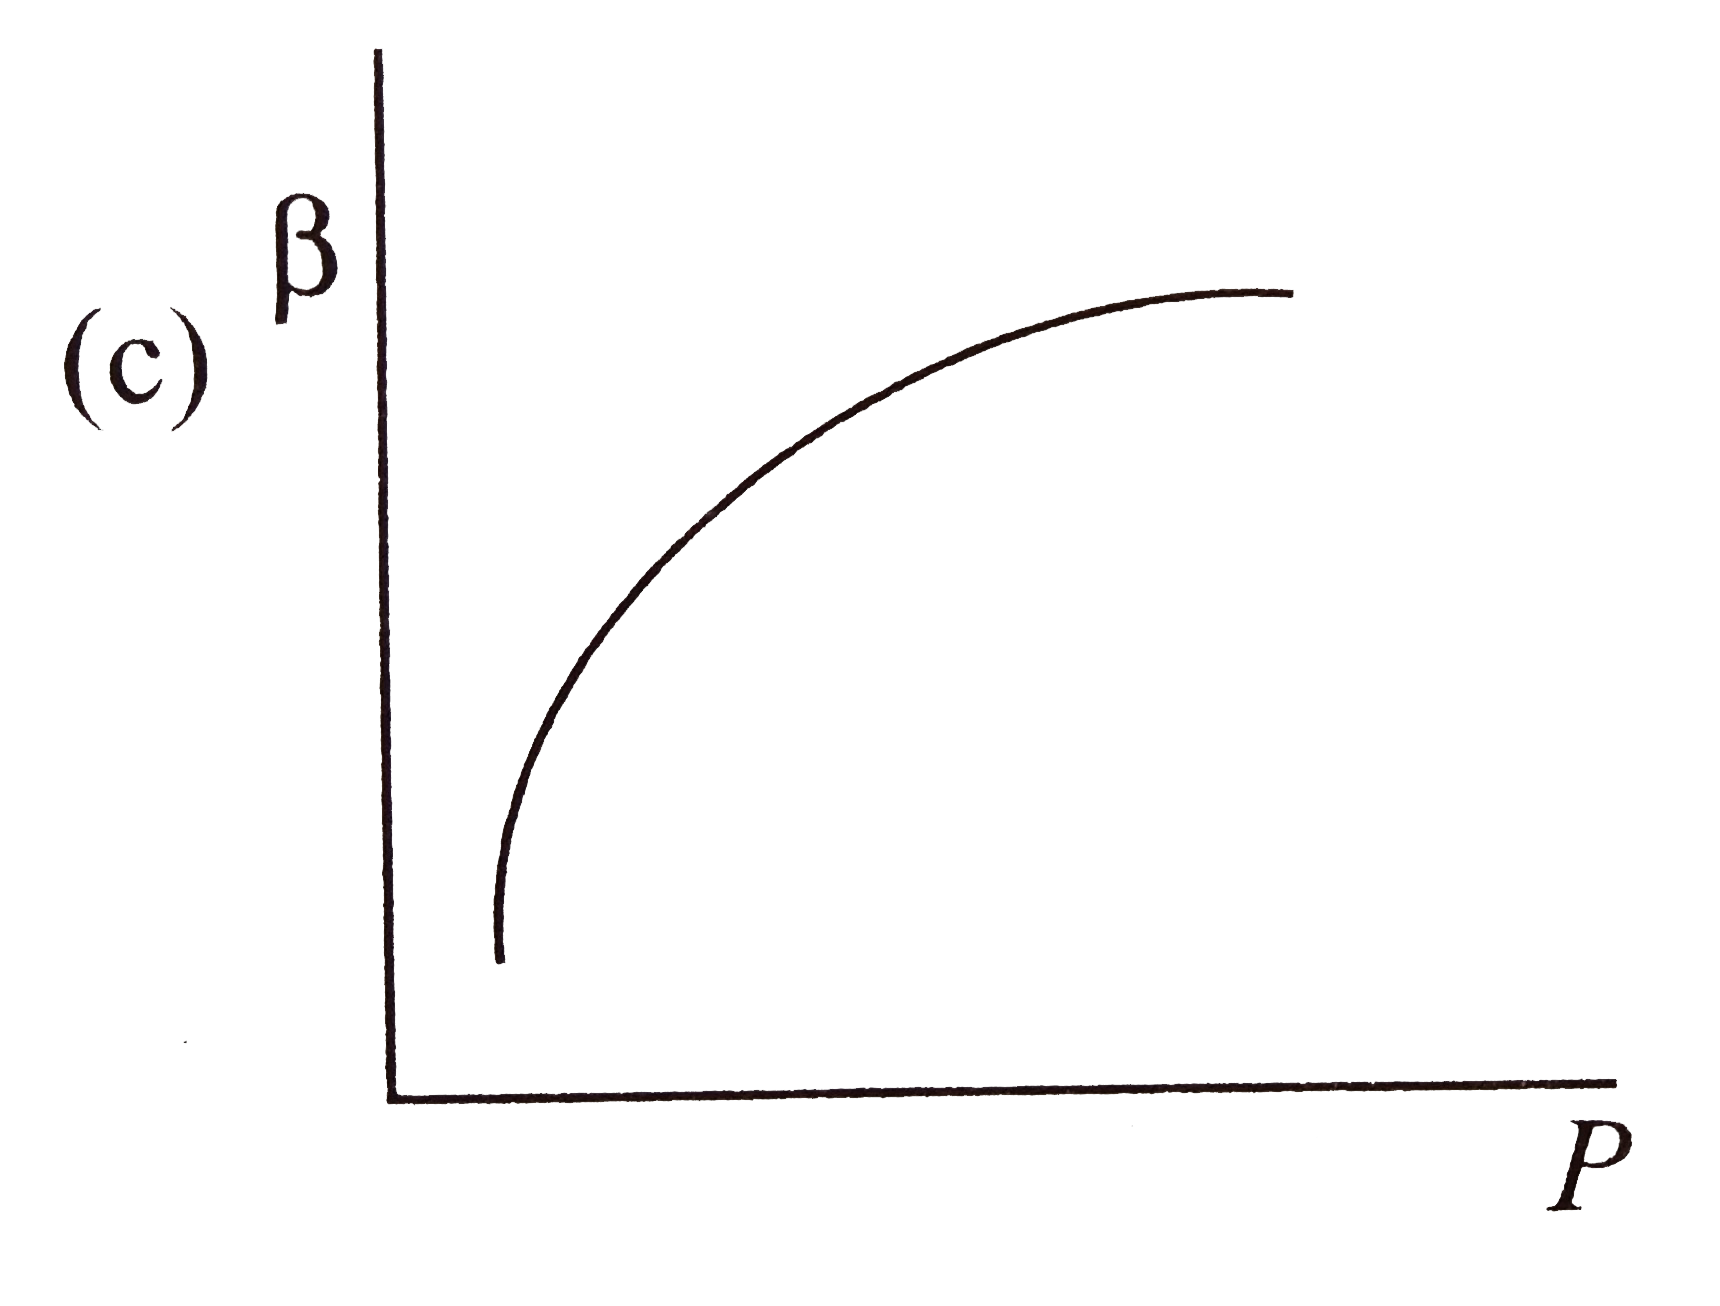 D
D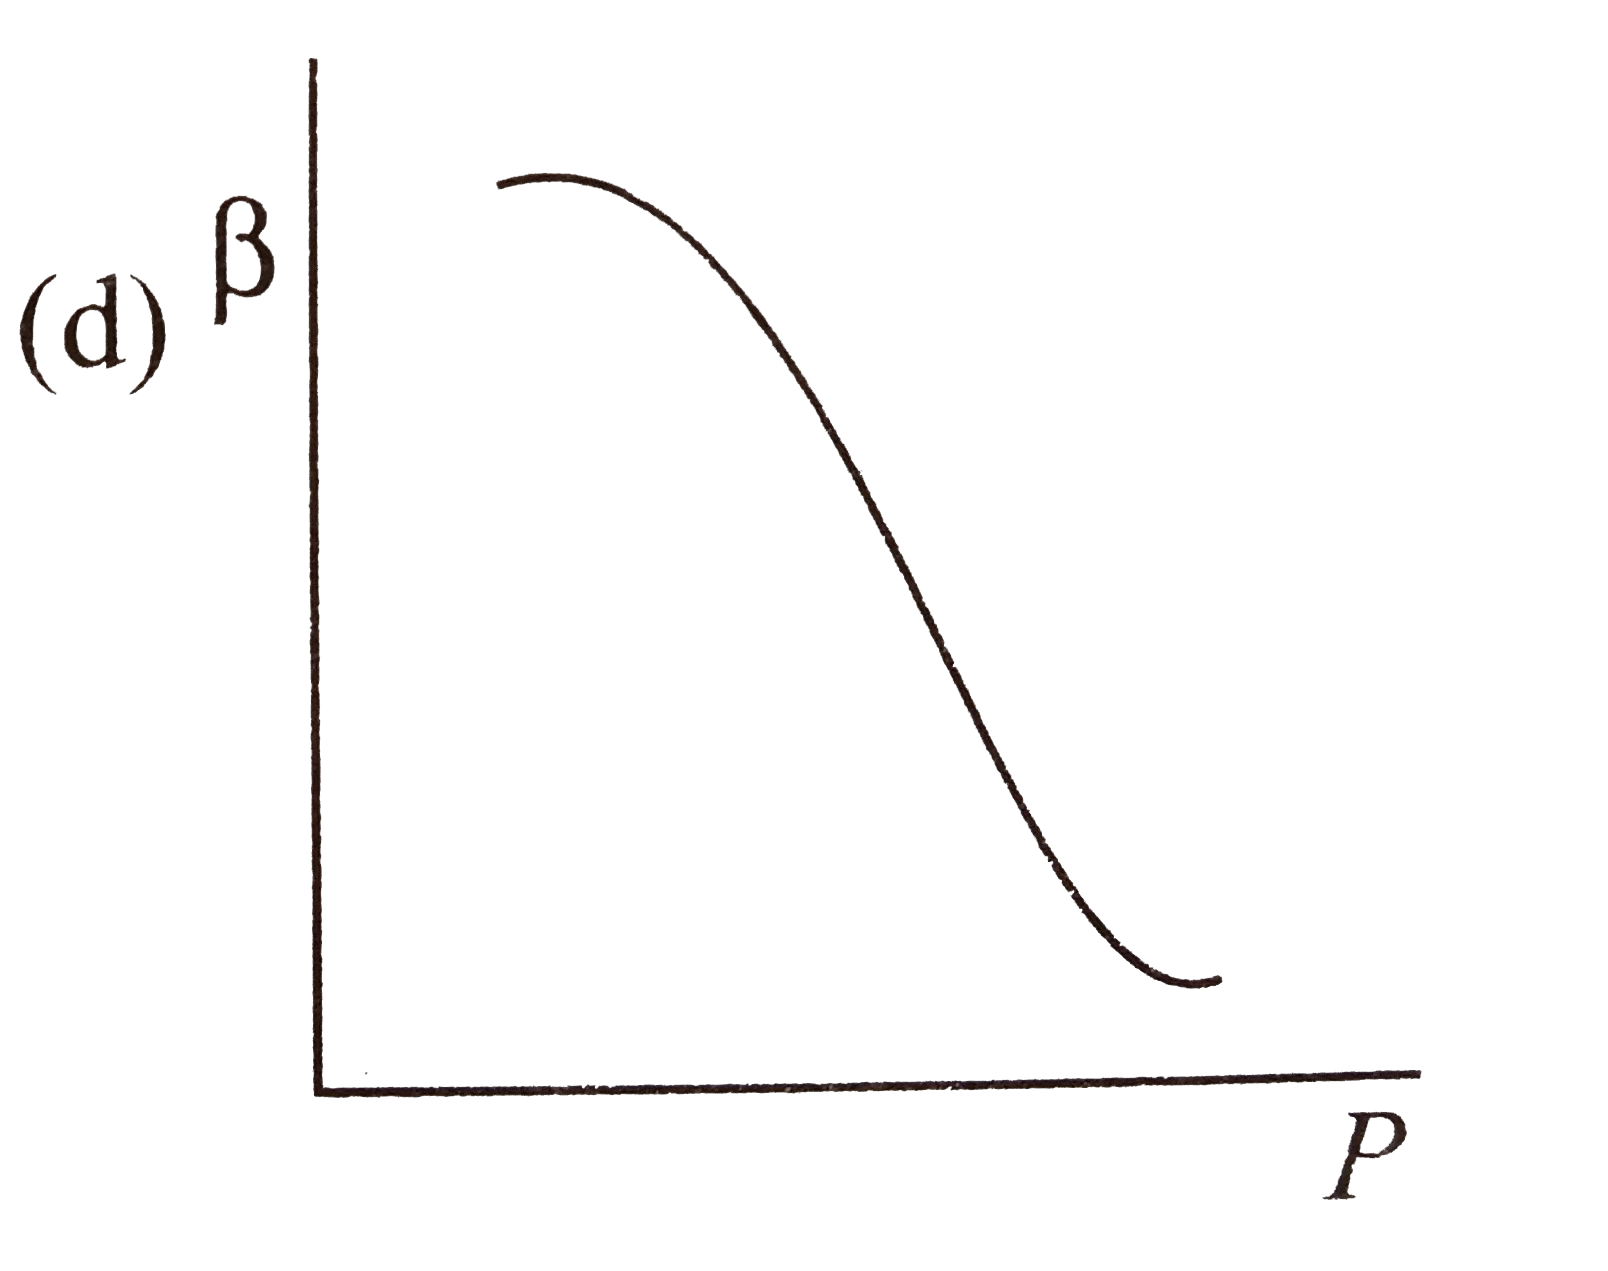
Which of the following graphs correctly represents the variation of β=−(dV/dP)/V with P for an ideal gas at constant temperature?
A B
B C
C D
D
Which of following graphs correctly represent variation of α=−(dV/dP)TV with P for fixed amount of an ideal gas at constant temperature ?
View SolutionWhich of the following graphs represent the behaviour of an ideal gas ?
View SolutionWhich one of the following graphs correctly gives the ideal gas behaviour ?
View SolutionAt a constant pressure, of the following graphs that one which represents the variation of the density of an ideal gas with the absolute temperature T, is
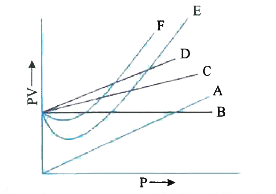
View SolutionWhich curve in the following graph represents the curve of ideal gas ?
View Solution
