Which of the following volume-temperature (V−I) plots represents the behaviour of 1mole of an ideal gas at the atmospheric pressure?
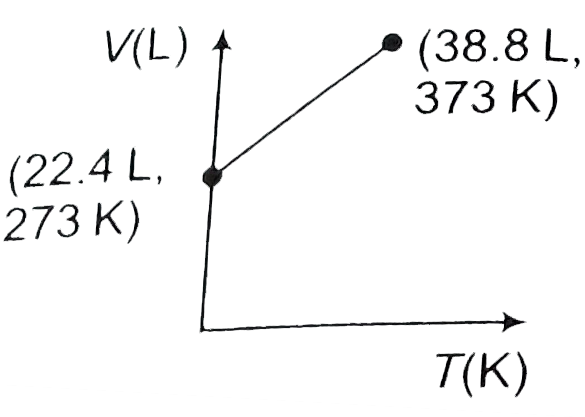
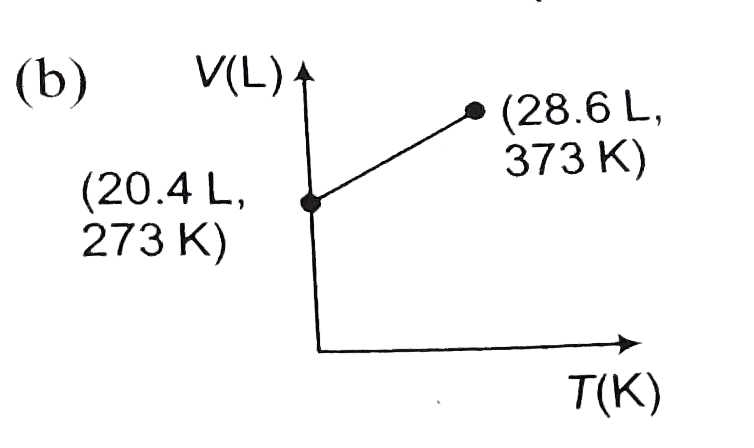
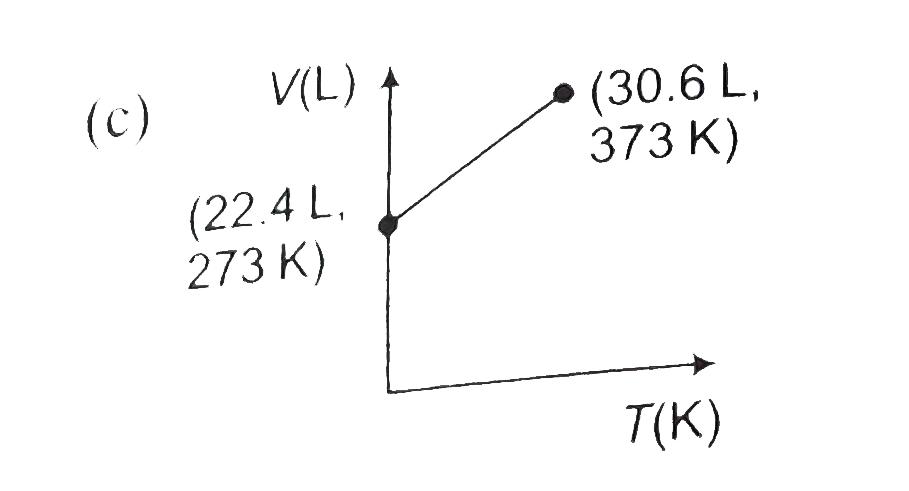
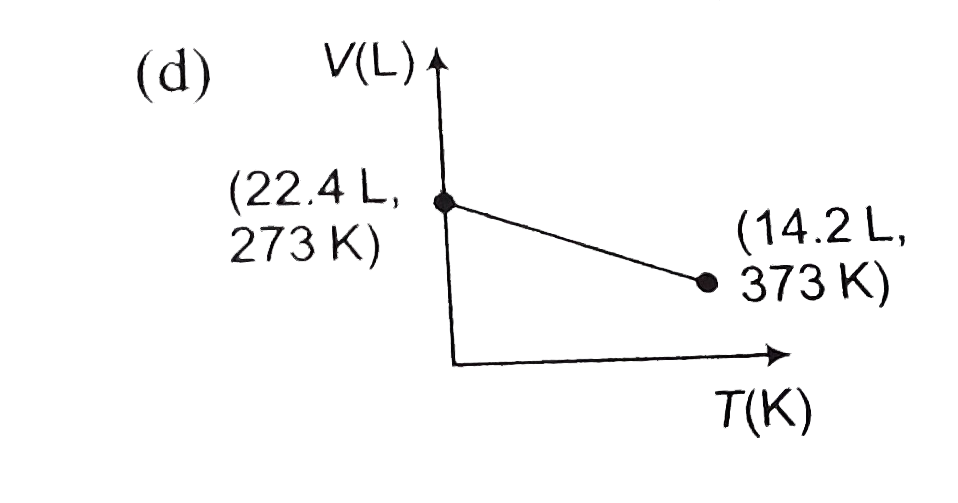
The correct Answer is:C
Step by step video, text & image solution for Which of the following volume-temperature (V-I) plots represents the behaviour of 1 "mole" of an ideal gas at the atmospheric pressure? by Chemistry experts to help you in doubts & scoring excellent marks in Class 12 exams.
Updated on:21/07/2023Topper's Solved these Questions
- STATES OF MATTERBOOK - IIT-JEE PREVIOUS YEAR (CHEMISTRY)CHAPTER - STATES OF MATTEREXERCISE - OBJECTIVE_TYPE
9 Videos
- STATES OF MATTERBOOK - IIT-JEE PREVIOUS YEAR (CHEMISTRY)CHAPTER - STATES OF MATTEREXERCISE - MATCH THE COLUMN
1 Videos
- SOME BASIC CONCEPTS OF CHEMISTRYBOOK - IIT-JEE PREVIOUS YEAR (CHEMISTRY)CHAPTER - SOME BASIC CONCEPTS OF CHEMISTRYEXERCISE - Subjective Questions
2 Videos
- SURFACE CHEMISTRYBOOK - IIT-JEE PREVIOUS YEAR (CHEMISTRY)CHAPTER - SURFACE CHEMISTRYEXERCISE - JEE Main And Advanced
17 Videos
Similar Questions
Which of the following volume (V) - temperature (T) plots represents the behaviour of one mole of an ideal gas at one atmospheric pressure?
View SolutionWhich of the following volume (V)-temperature (T) plots represents the behaviour of one mole of an ideal gas at one atmoshperic pressure?
View Solution
Knowledge Check
Which of the following volume (V) - temperature (T) plots represents the behaviour of one mole of an ideal gas at one atmospheric pressure?
A B
B C
C D
D
Which one of the following volume (V)- temperature (T) plots represents the behaviour of one mole of an ideal gas at one atmosphere?
A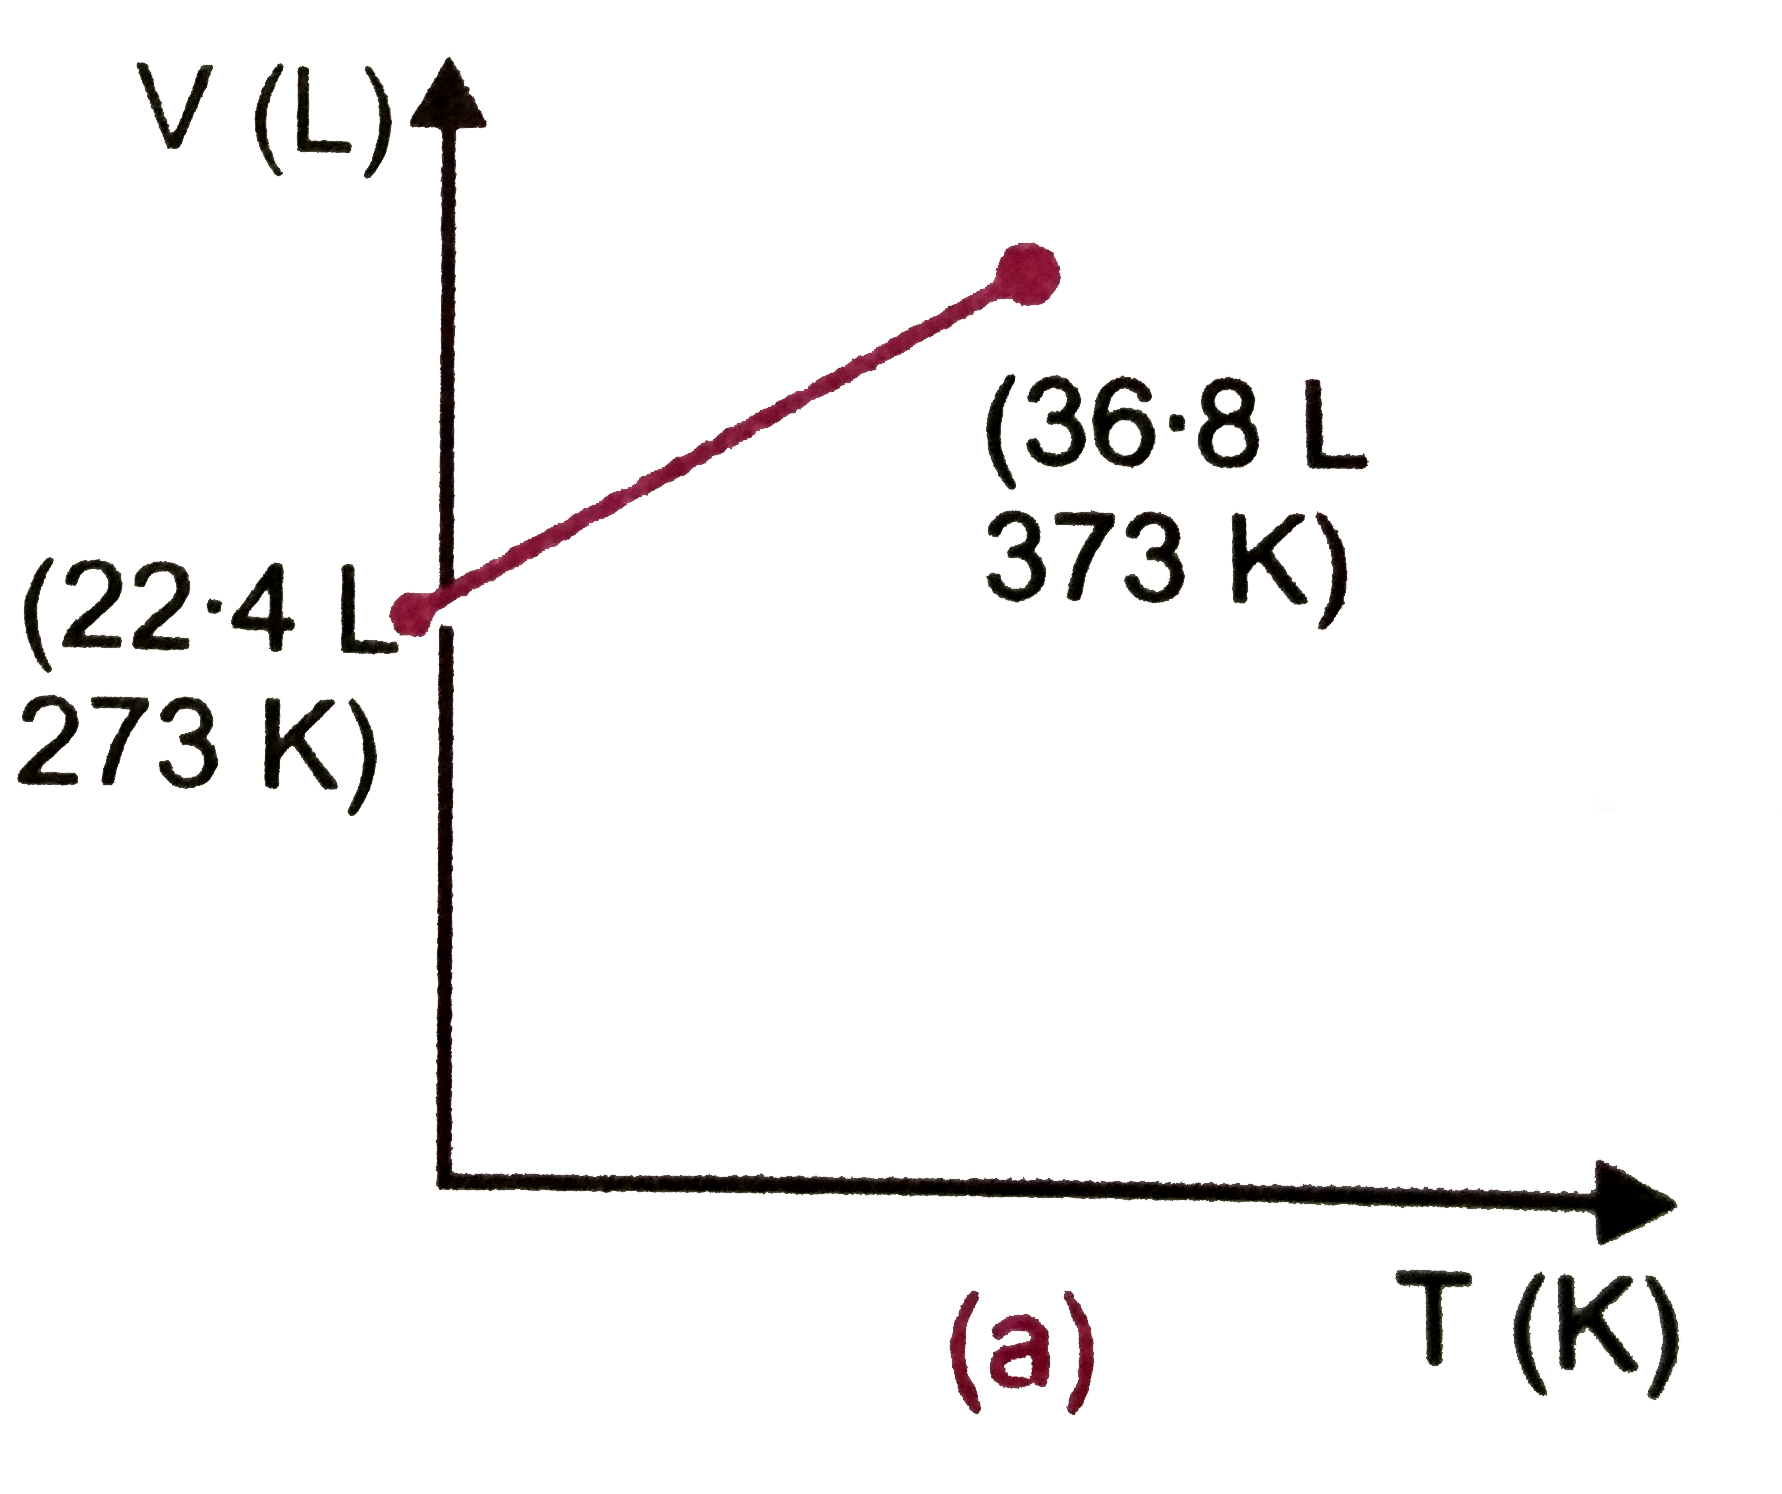 B
B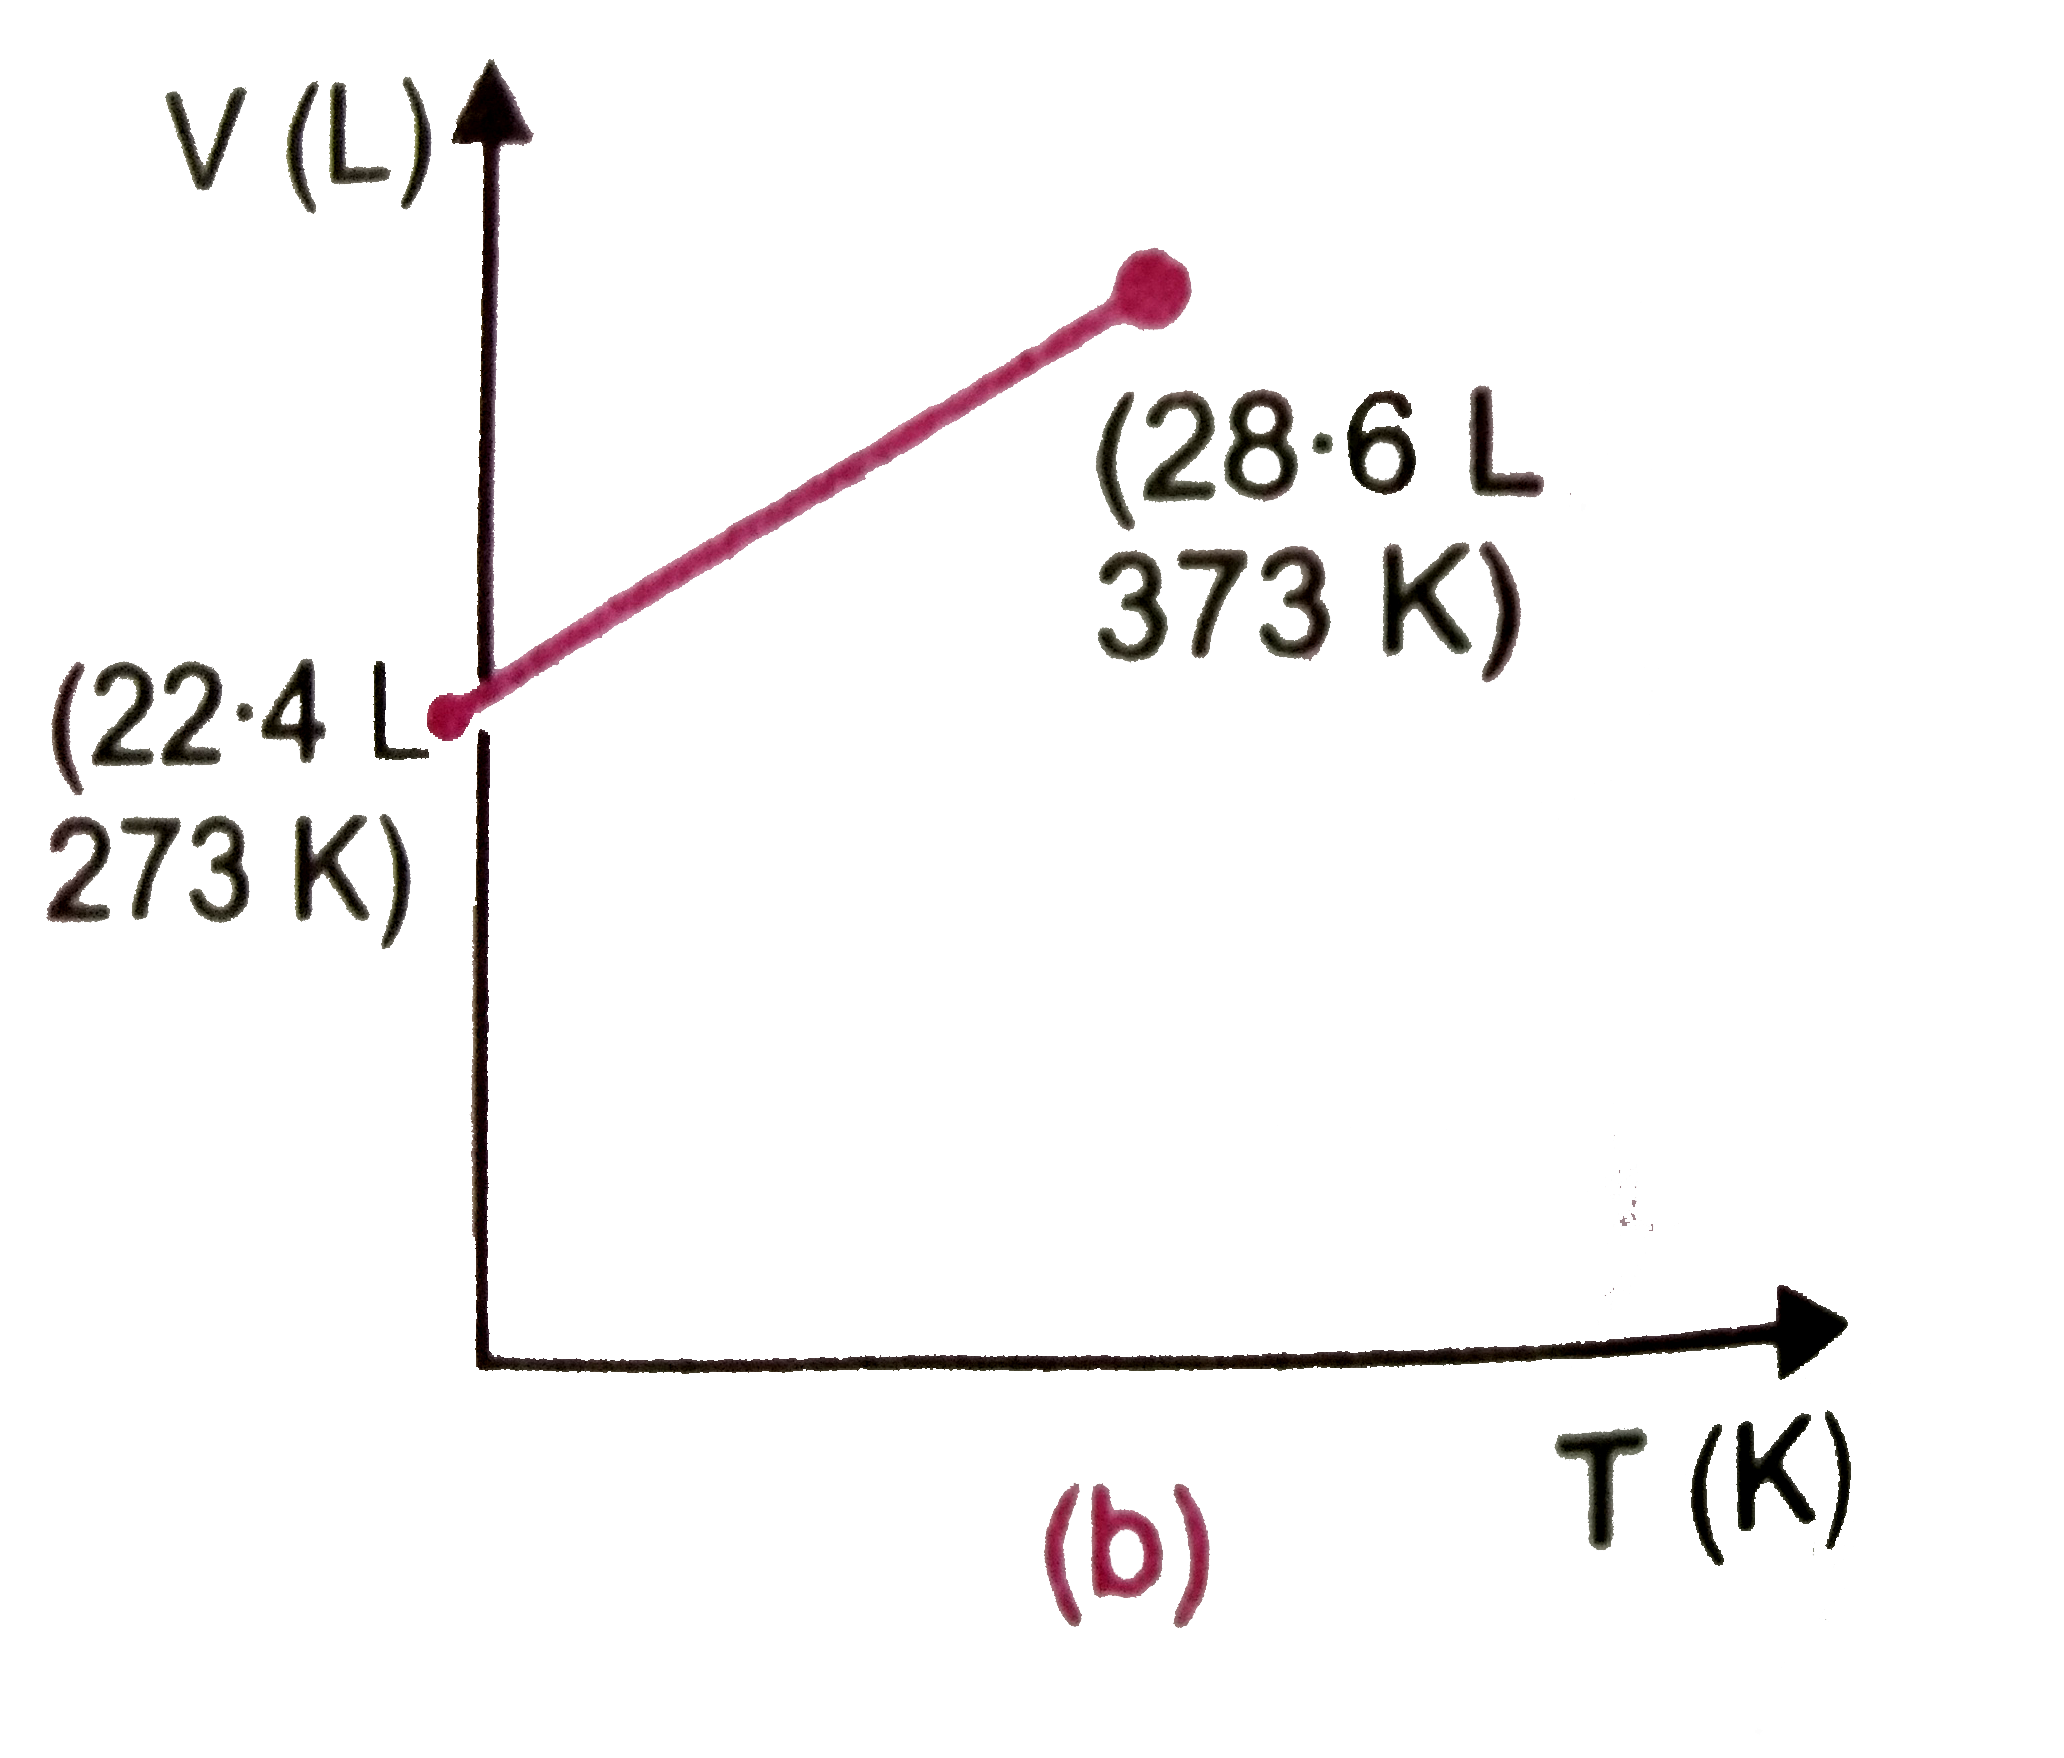 C
C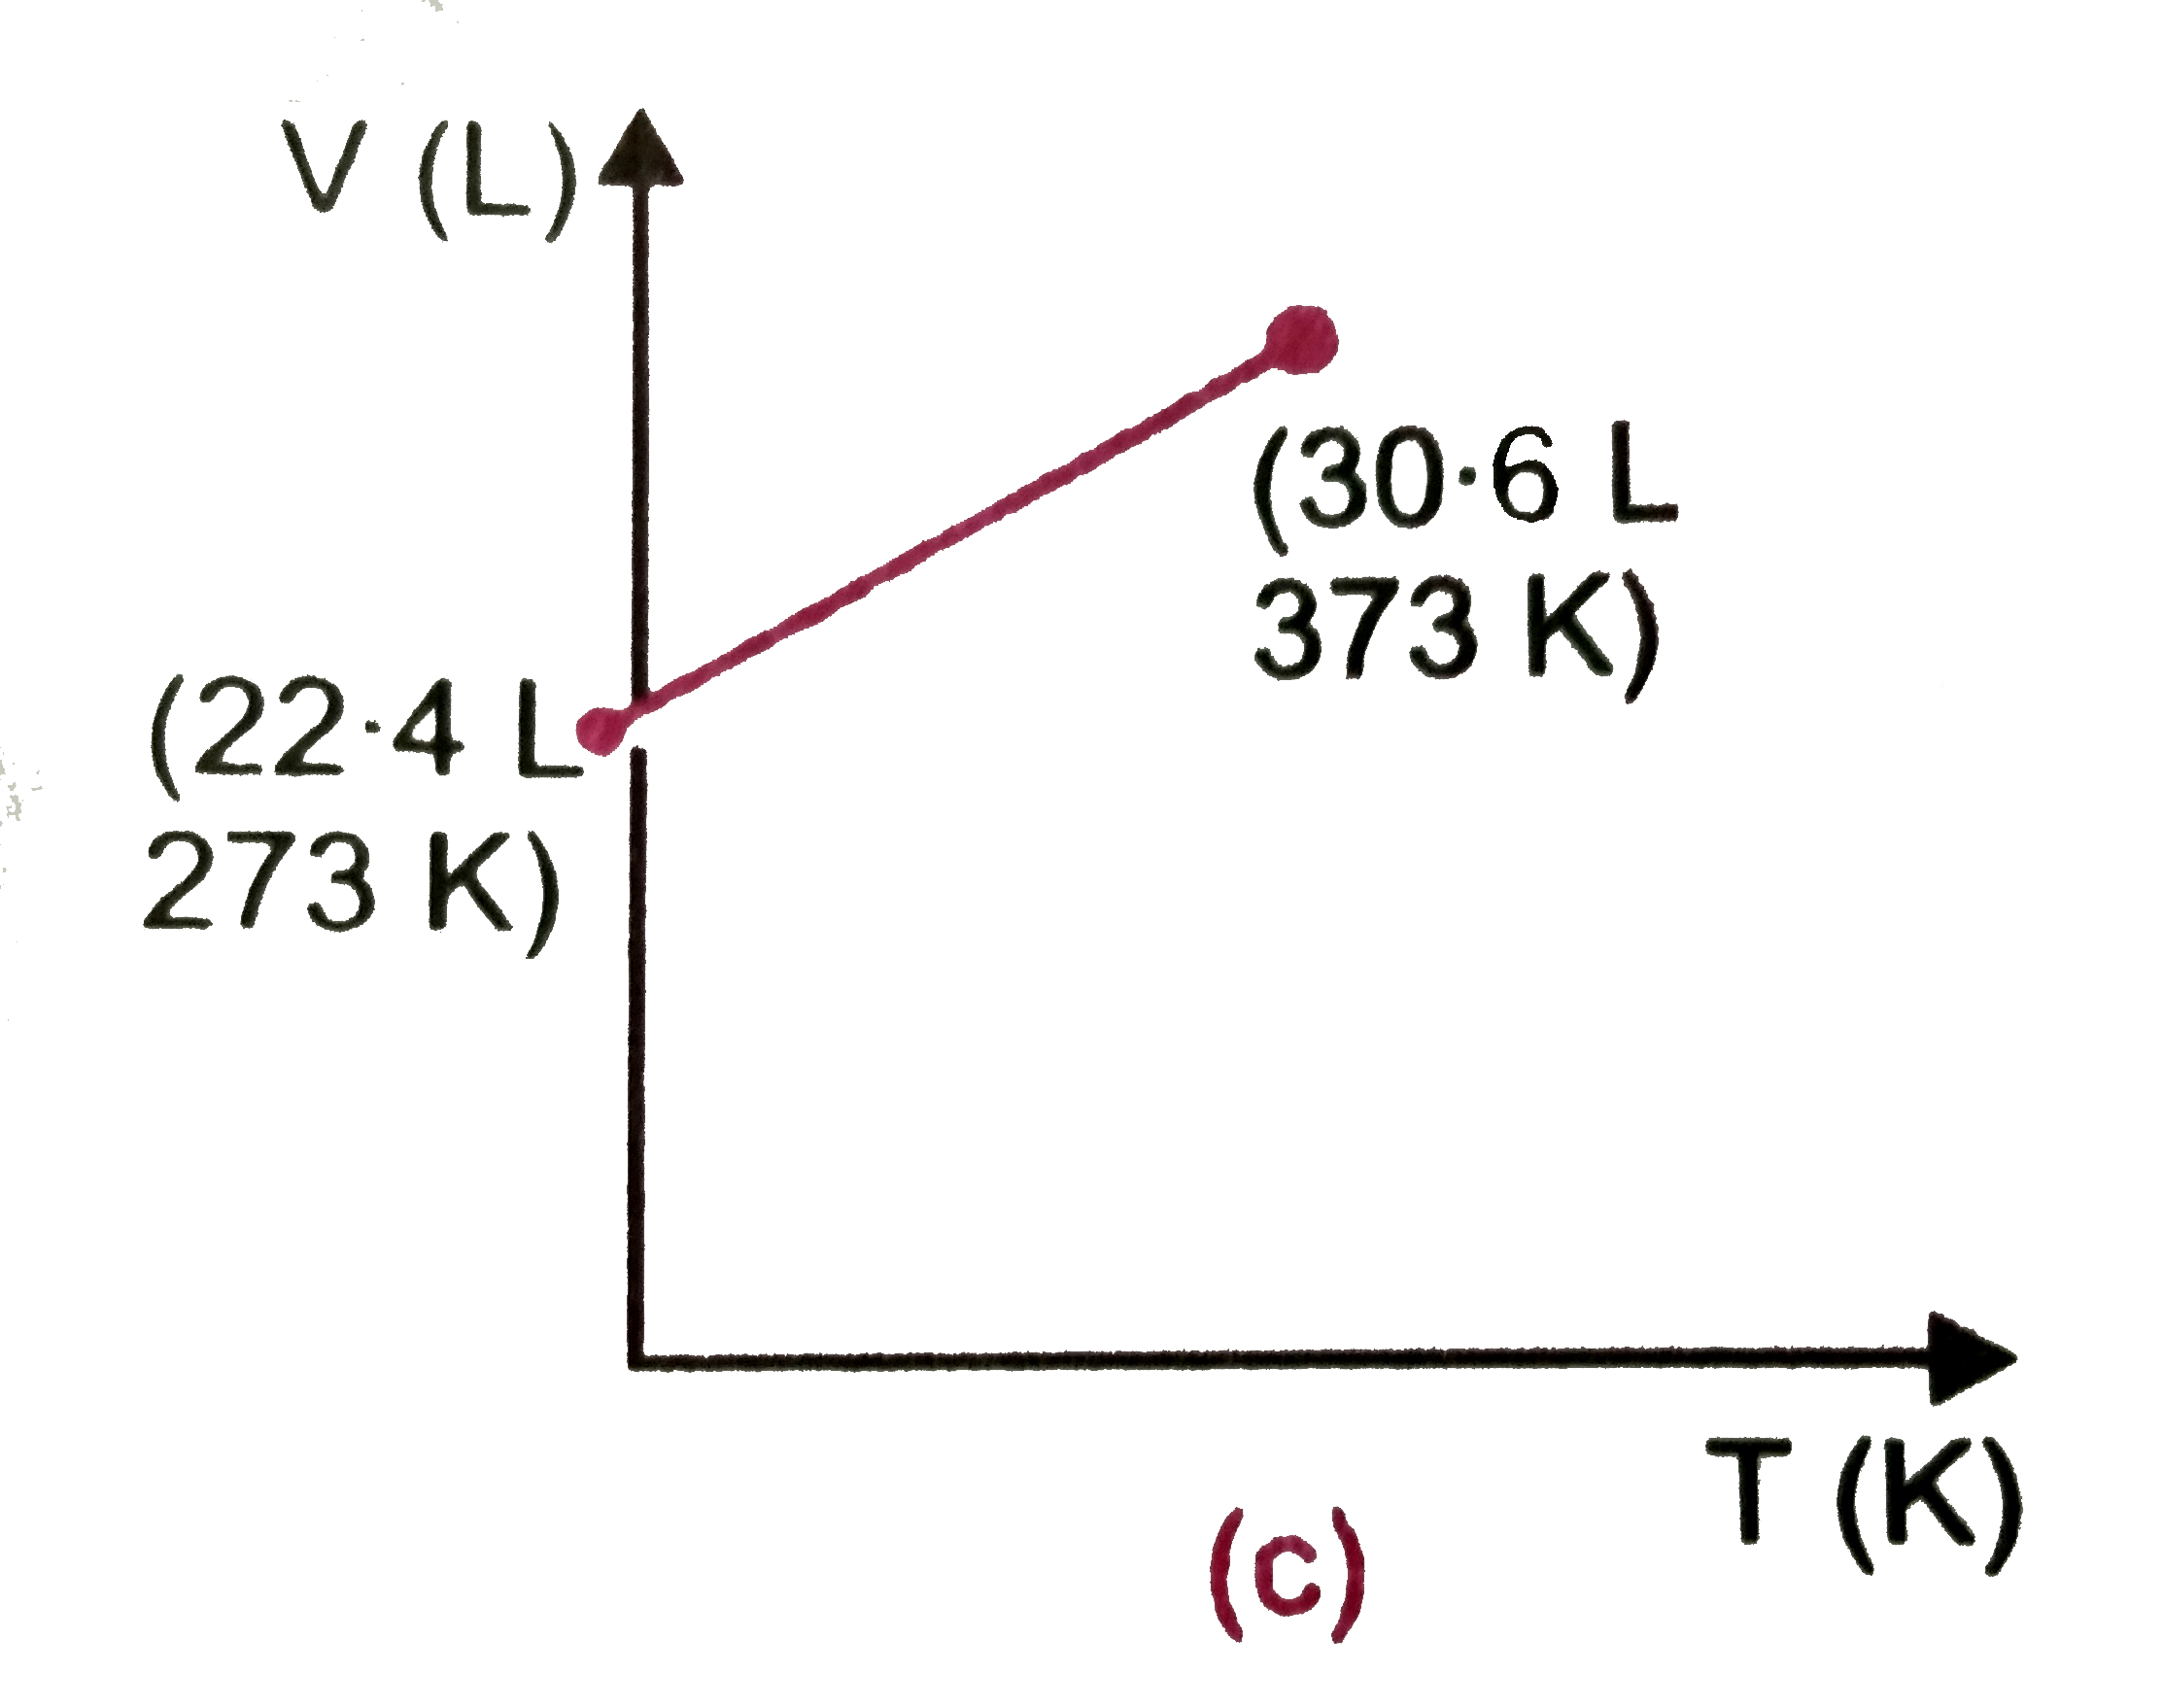 D
D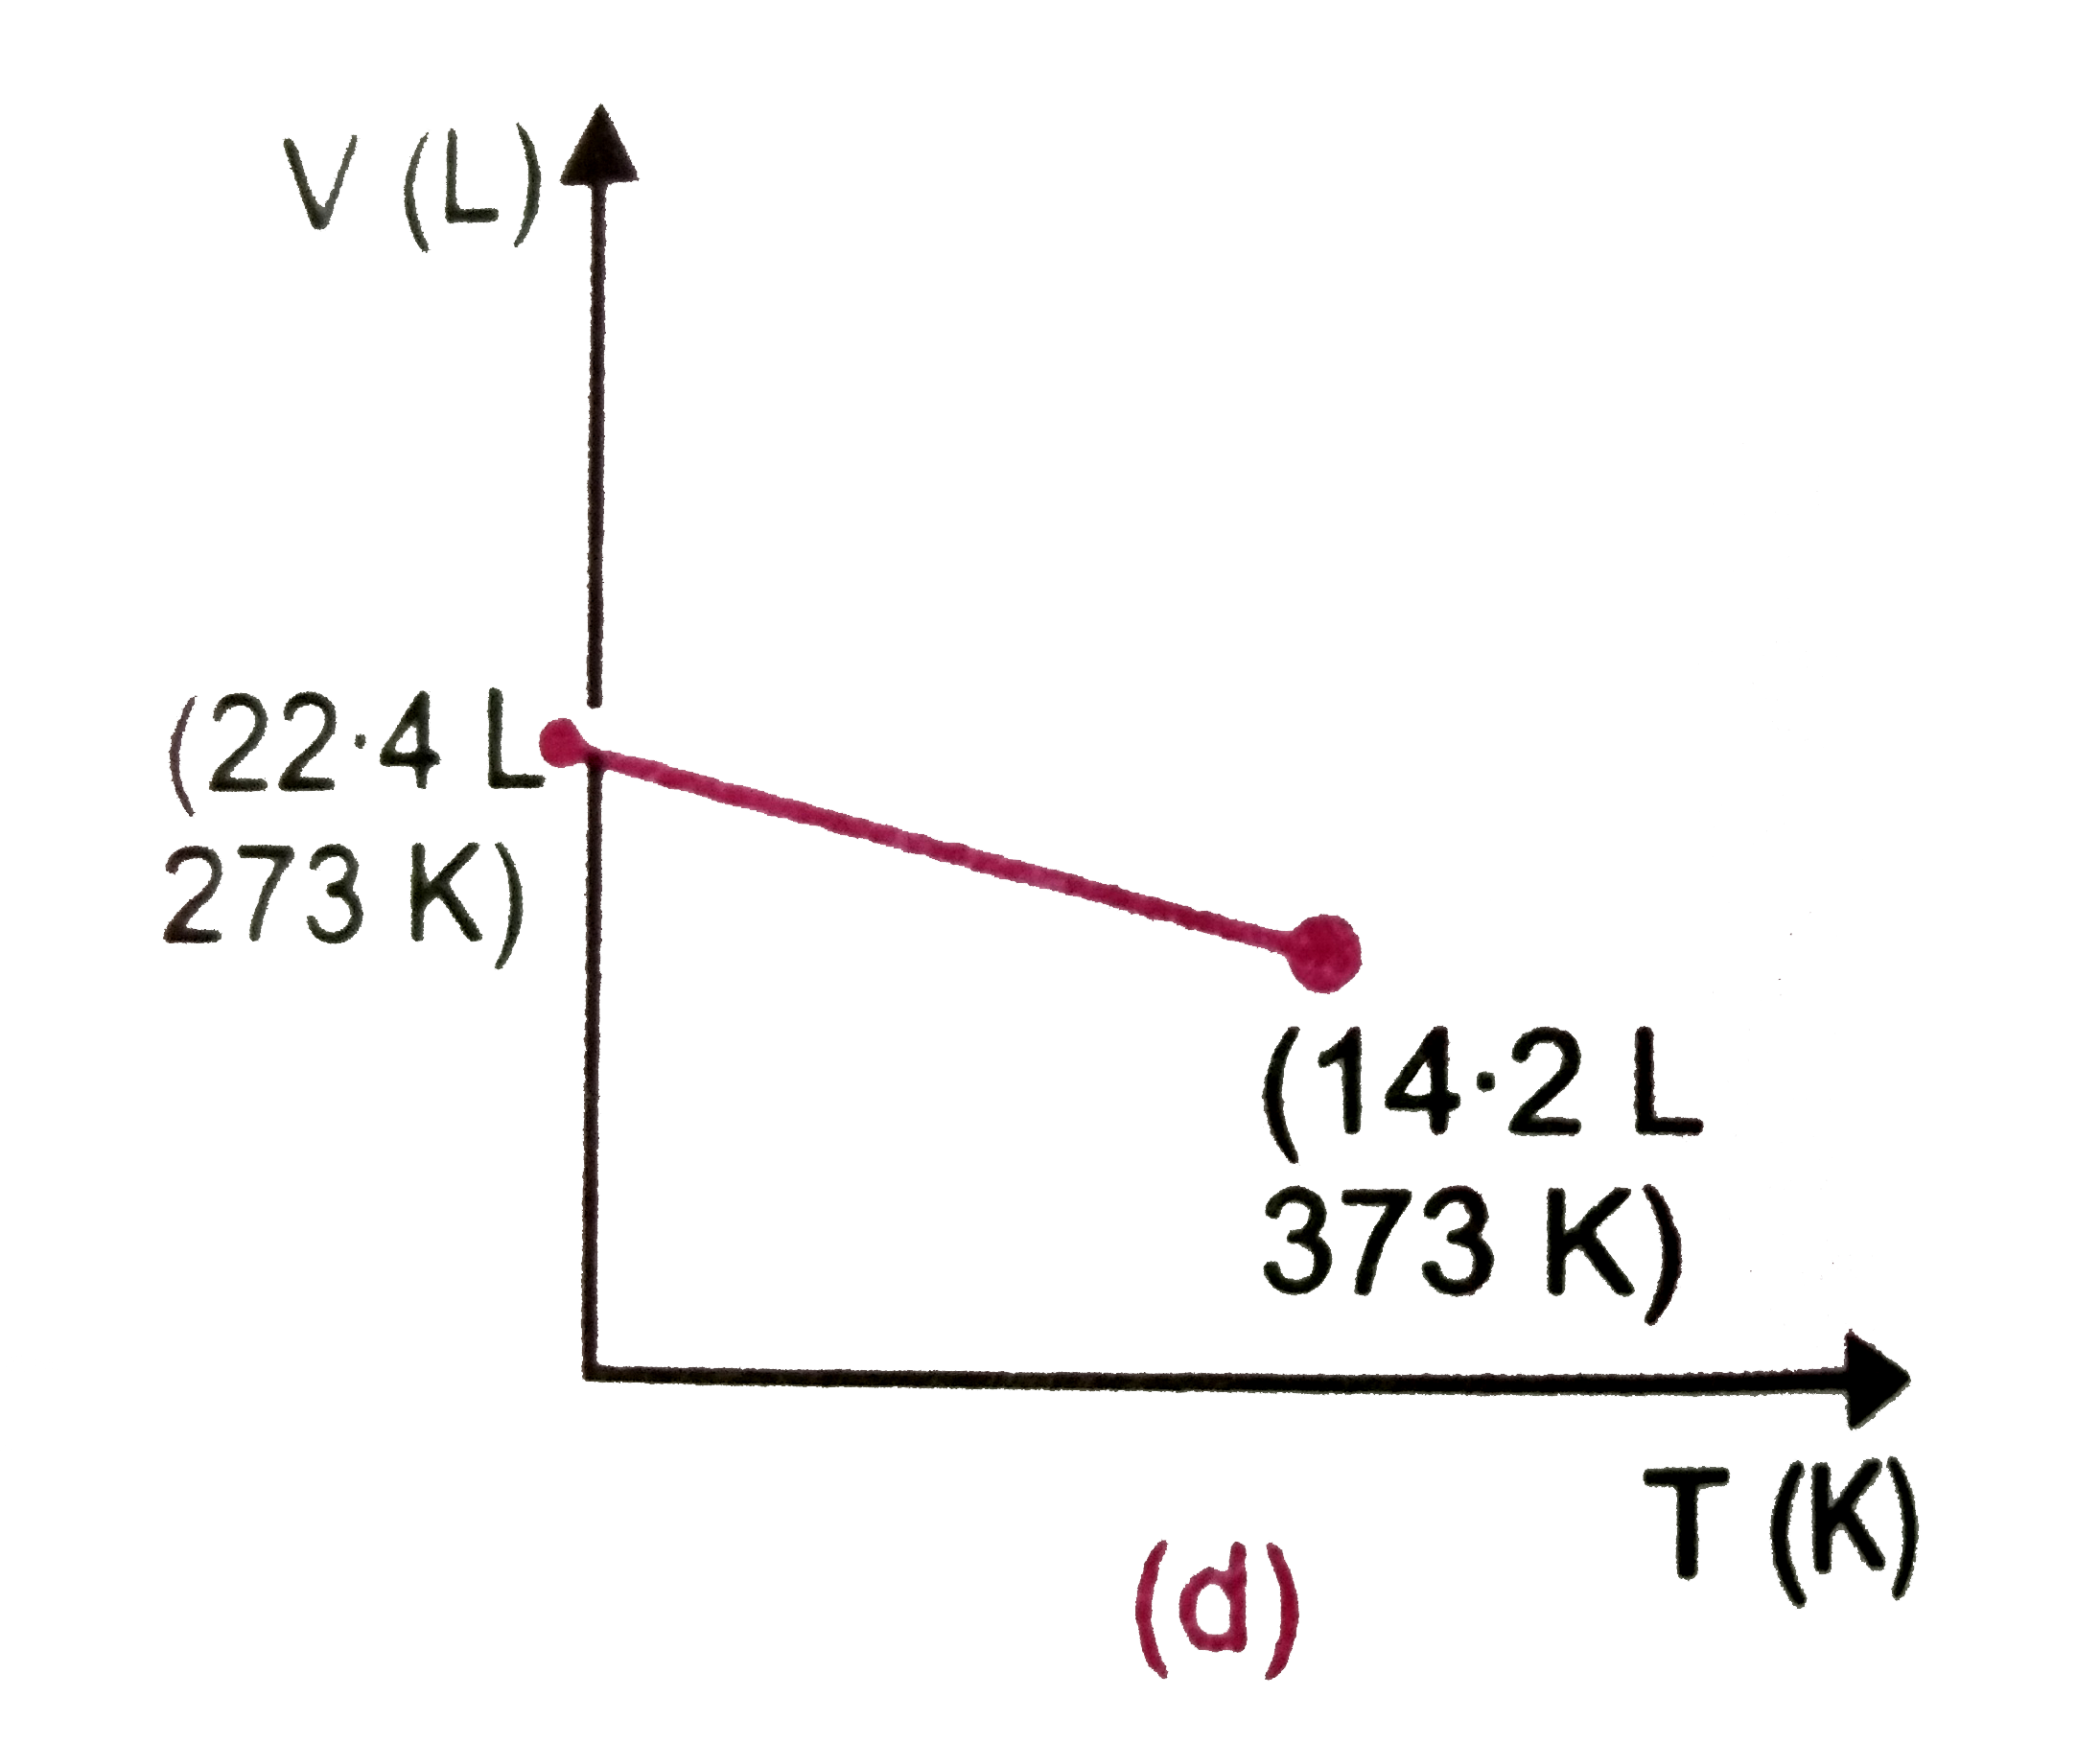
Which of the following volume (V) temperature (T) plots represents the behaviour of one mole of an ideal gas at one atmospheric pressure:
A B
B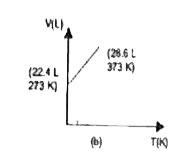 C
C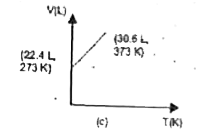 D
D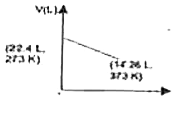
Which of the following volume-temperature (V−I) plots represents the behaviour of 1mole of an ideal gas at the atmospheric pressure?
View SolutionWhich one of the following volume (V)- temperature (T) plots represents the behaviour of one mole of an ideal gas at one atmosphere?
View SolutionWhich of the following graphs represent the behaviour of an ideal gas ?
View SolutionWhich of the following plots represents the behavior of an ideal binary liquid solution ?
View SolutionWhich of the following plots does not represent the behaviour of an ideal binary liquid solution?
View Solution
