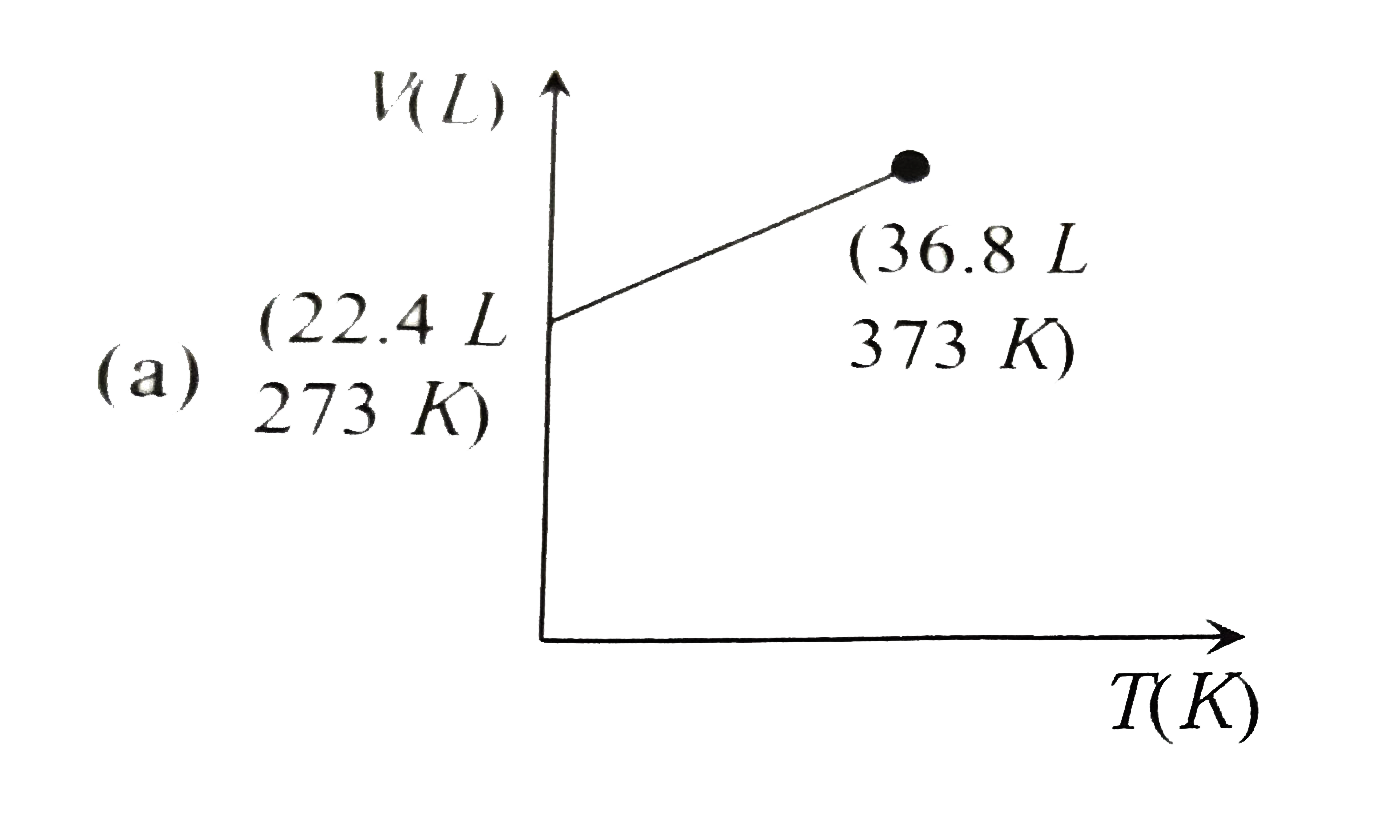
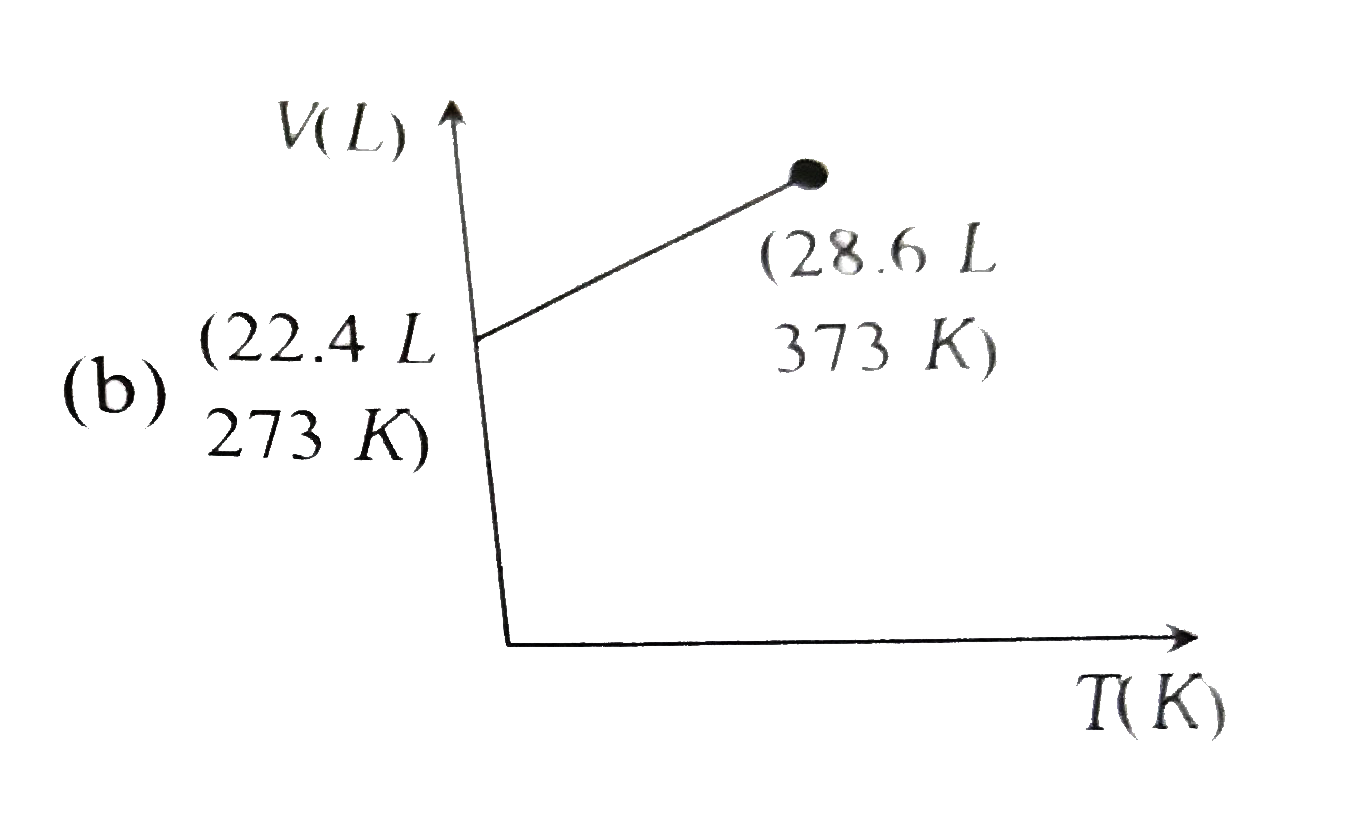
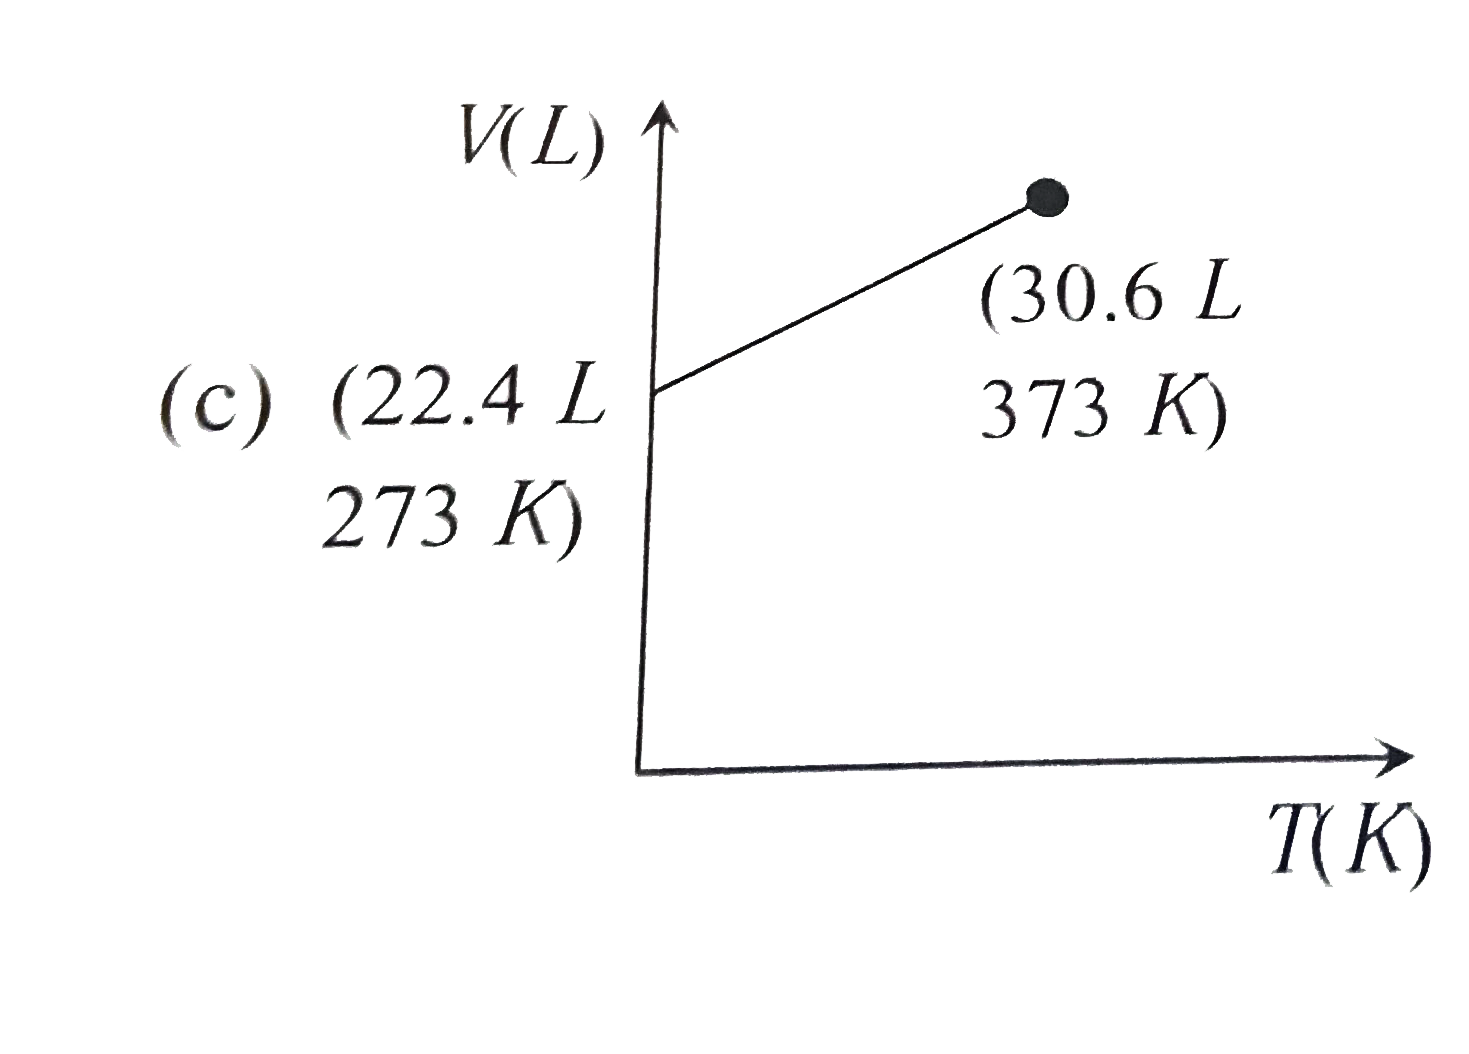
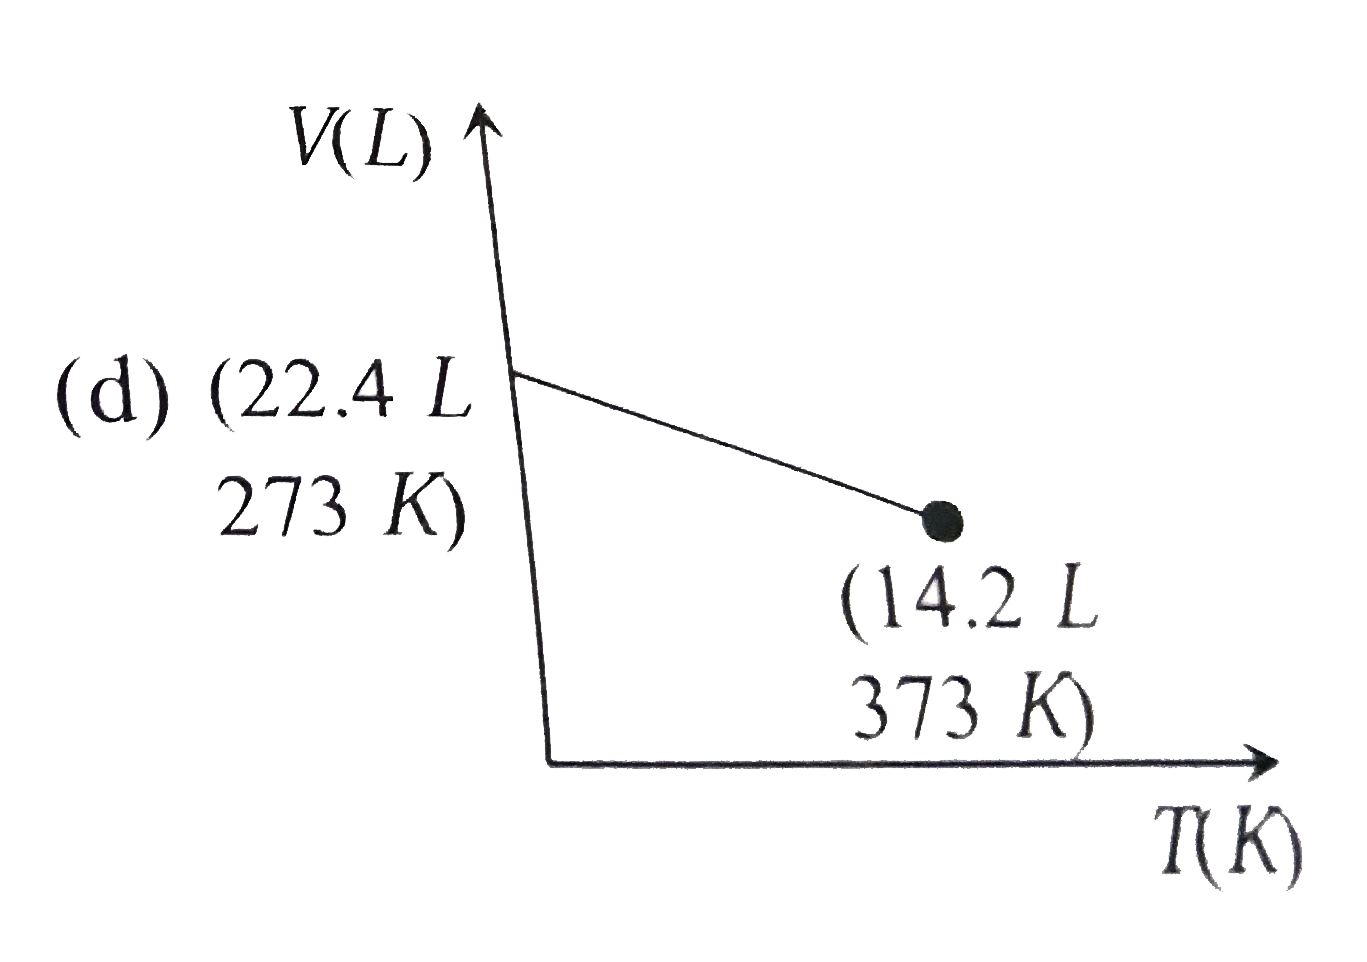
Which of the following volume-temperature (V−I) plots represents the behaviour of 1mole of an ideal gas at the atmospheric pressure?
The correct Answer is:C
Volume of 1 mole of an ideal gas at 273 K and 1 atm is 22.4 L and that at 373 K and 1 atm pressure is calculated as,
V=RTP=0.0821×3731=30.58L
Topper's Solved these Questions
- GASEOUS STATE BOOK - ERRORLESS CHAPTER - GASEOUS STATE EXERCISE - JEE SECTION (More than one choice correct answer)
7 Videos
- GASEOUS STATE BOOK - ERRORLESS CHAPTER - GASEOUS STATE EXERCISE - JEE SECTION (Reasoning type questions)
3 Videos
- GASEOUS STATE BOOK - ERRORLESS CHAPTER - GASEOUS STATE EXERCISE - Critical Thinking Objective Questions
19 Videos
- ENVIRONMENTAL CHEMISTRYBOOK - ERRORLESS CHAPTER - ENVIRONMENTAL CHEMISTRYEXERCISE - CRITICAL THINKING (Objective question )
16 Videos
- GENERAL ORGANIC CHEMISTRYBOOK - ERRORLESS CHAPTER - GENERAL ORGANIC CHEMISTRYEXERCISE - Matrix Match type questions
4 Videos
Similar Questions
Which of the following volume (V) - temperature (T) plots represents the behaviour of one mole of an ideal gas at one atmospheric pressure?
View SolutionWhich of the following volume (V)-temperature (T) plots represents the behaviour of one mole of an ideal gas at one atmoshperic pressure?
View Solution
Knowledge Check
Which of the following volume (V) - temperature (T) plots represents the behaviour of one mole of an ideal gas at one atmospheric pressure?
A B
B C
C D
D
Which one of the following volume (V)- temperature (T) plots represents the behaviour of one mole of an ideal gas at one atmosphere?
A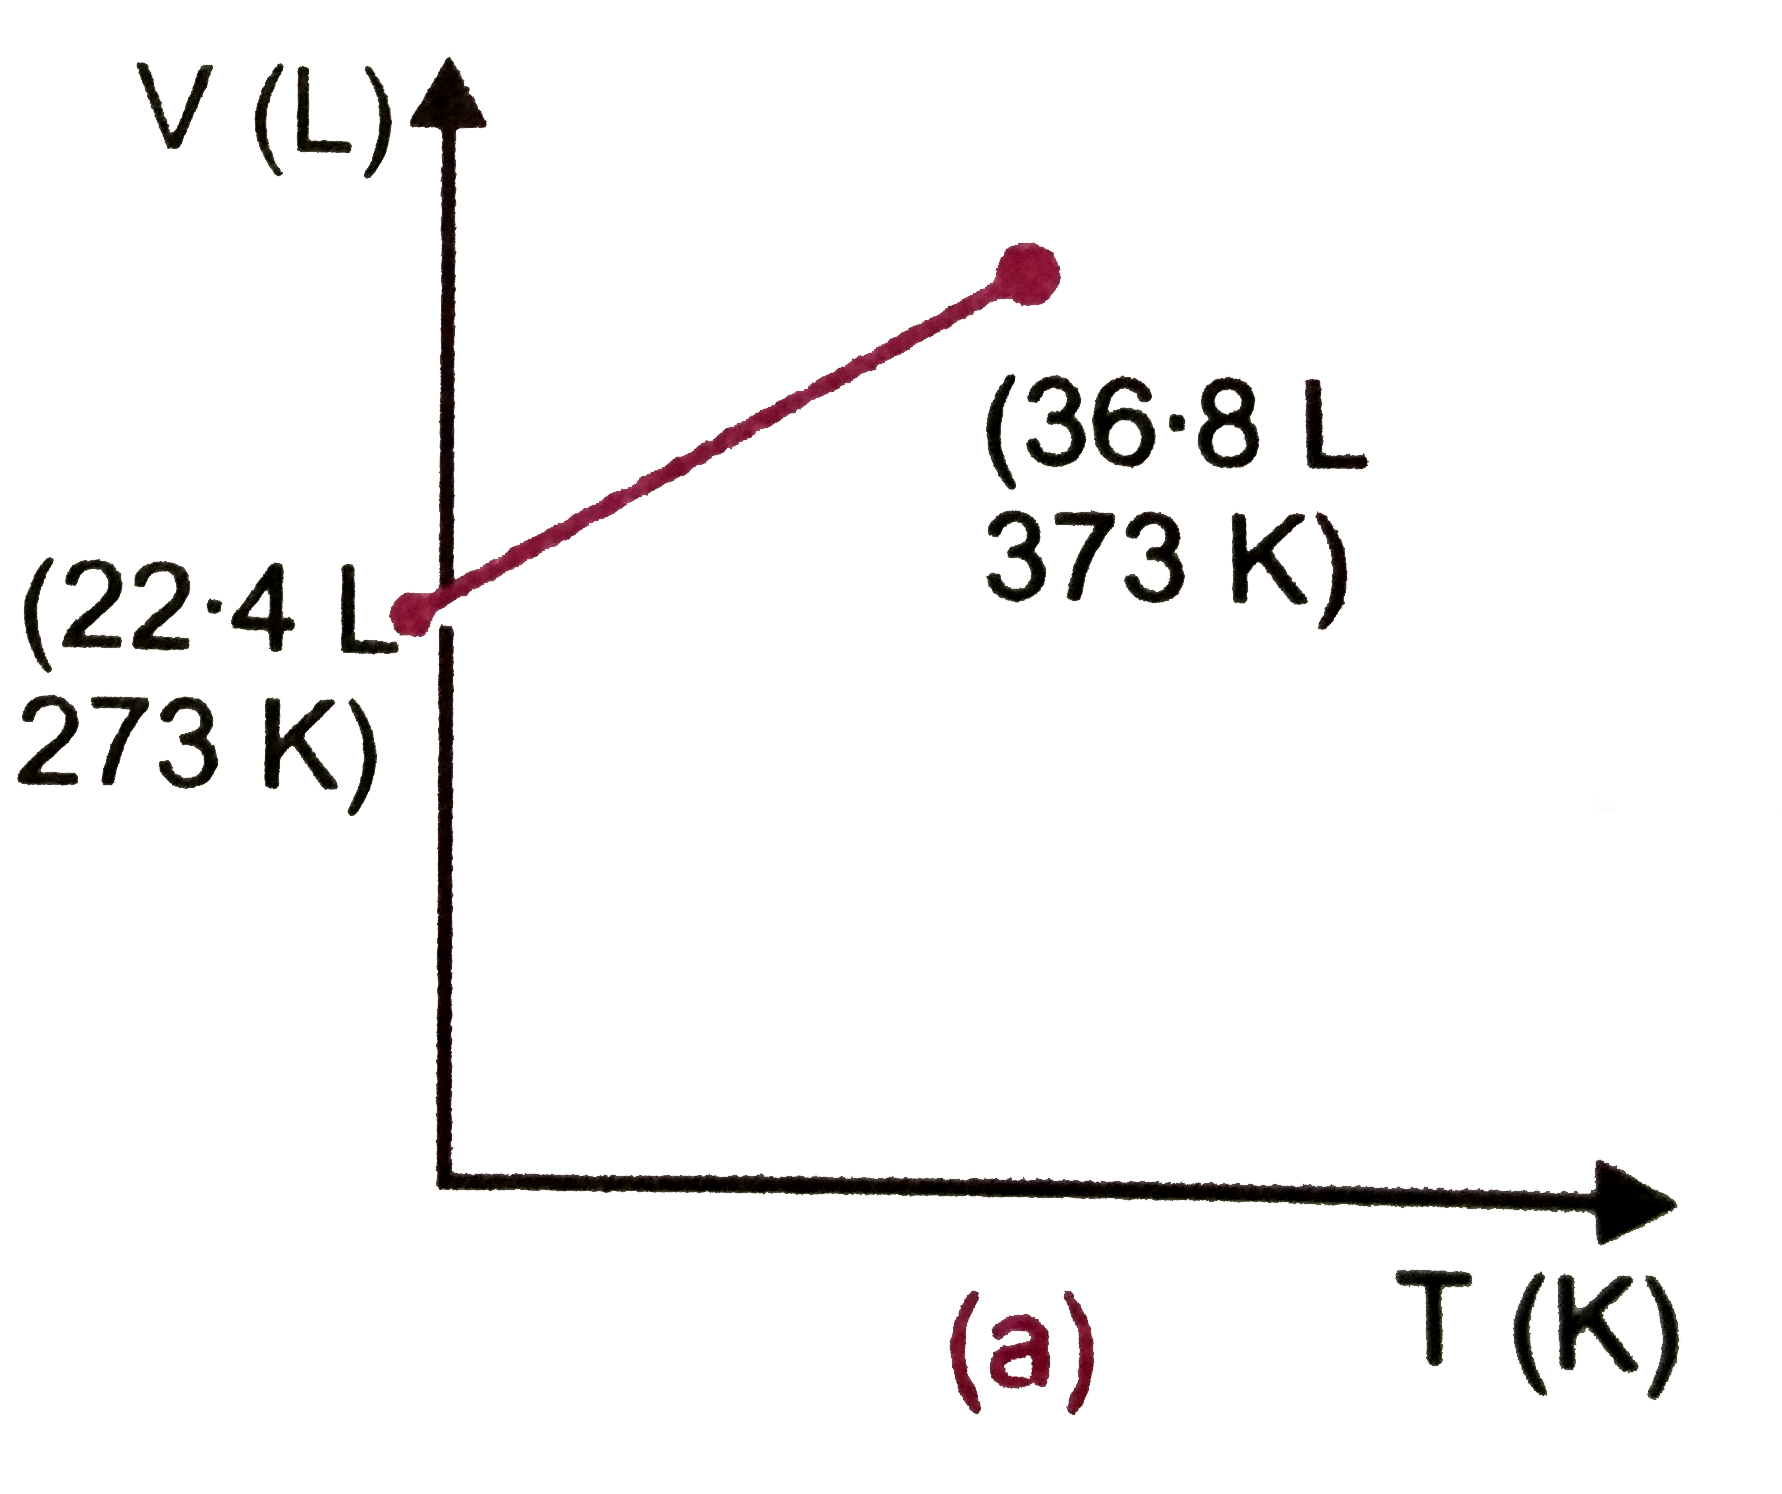 B
B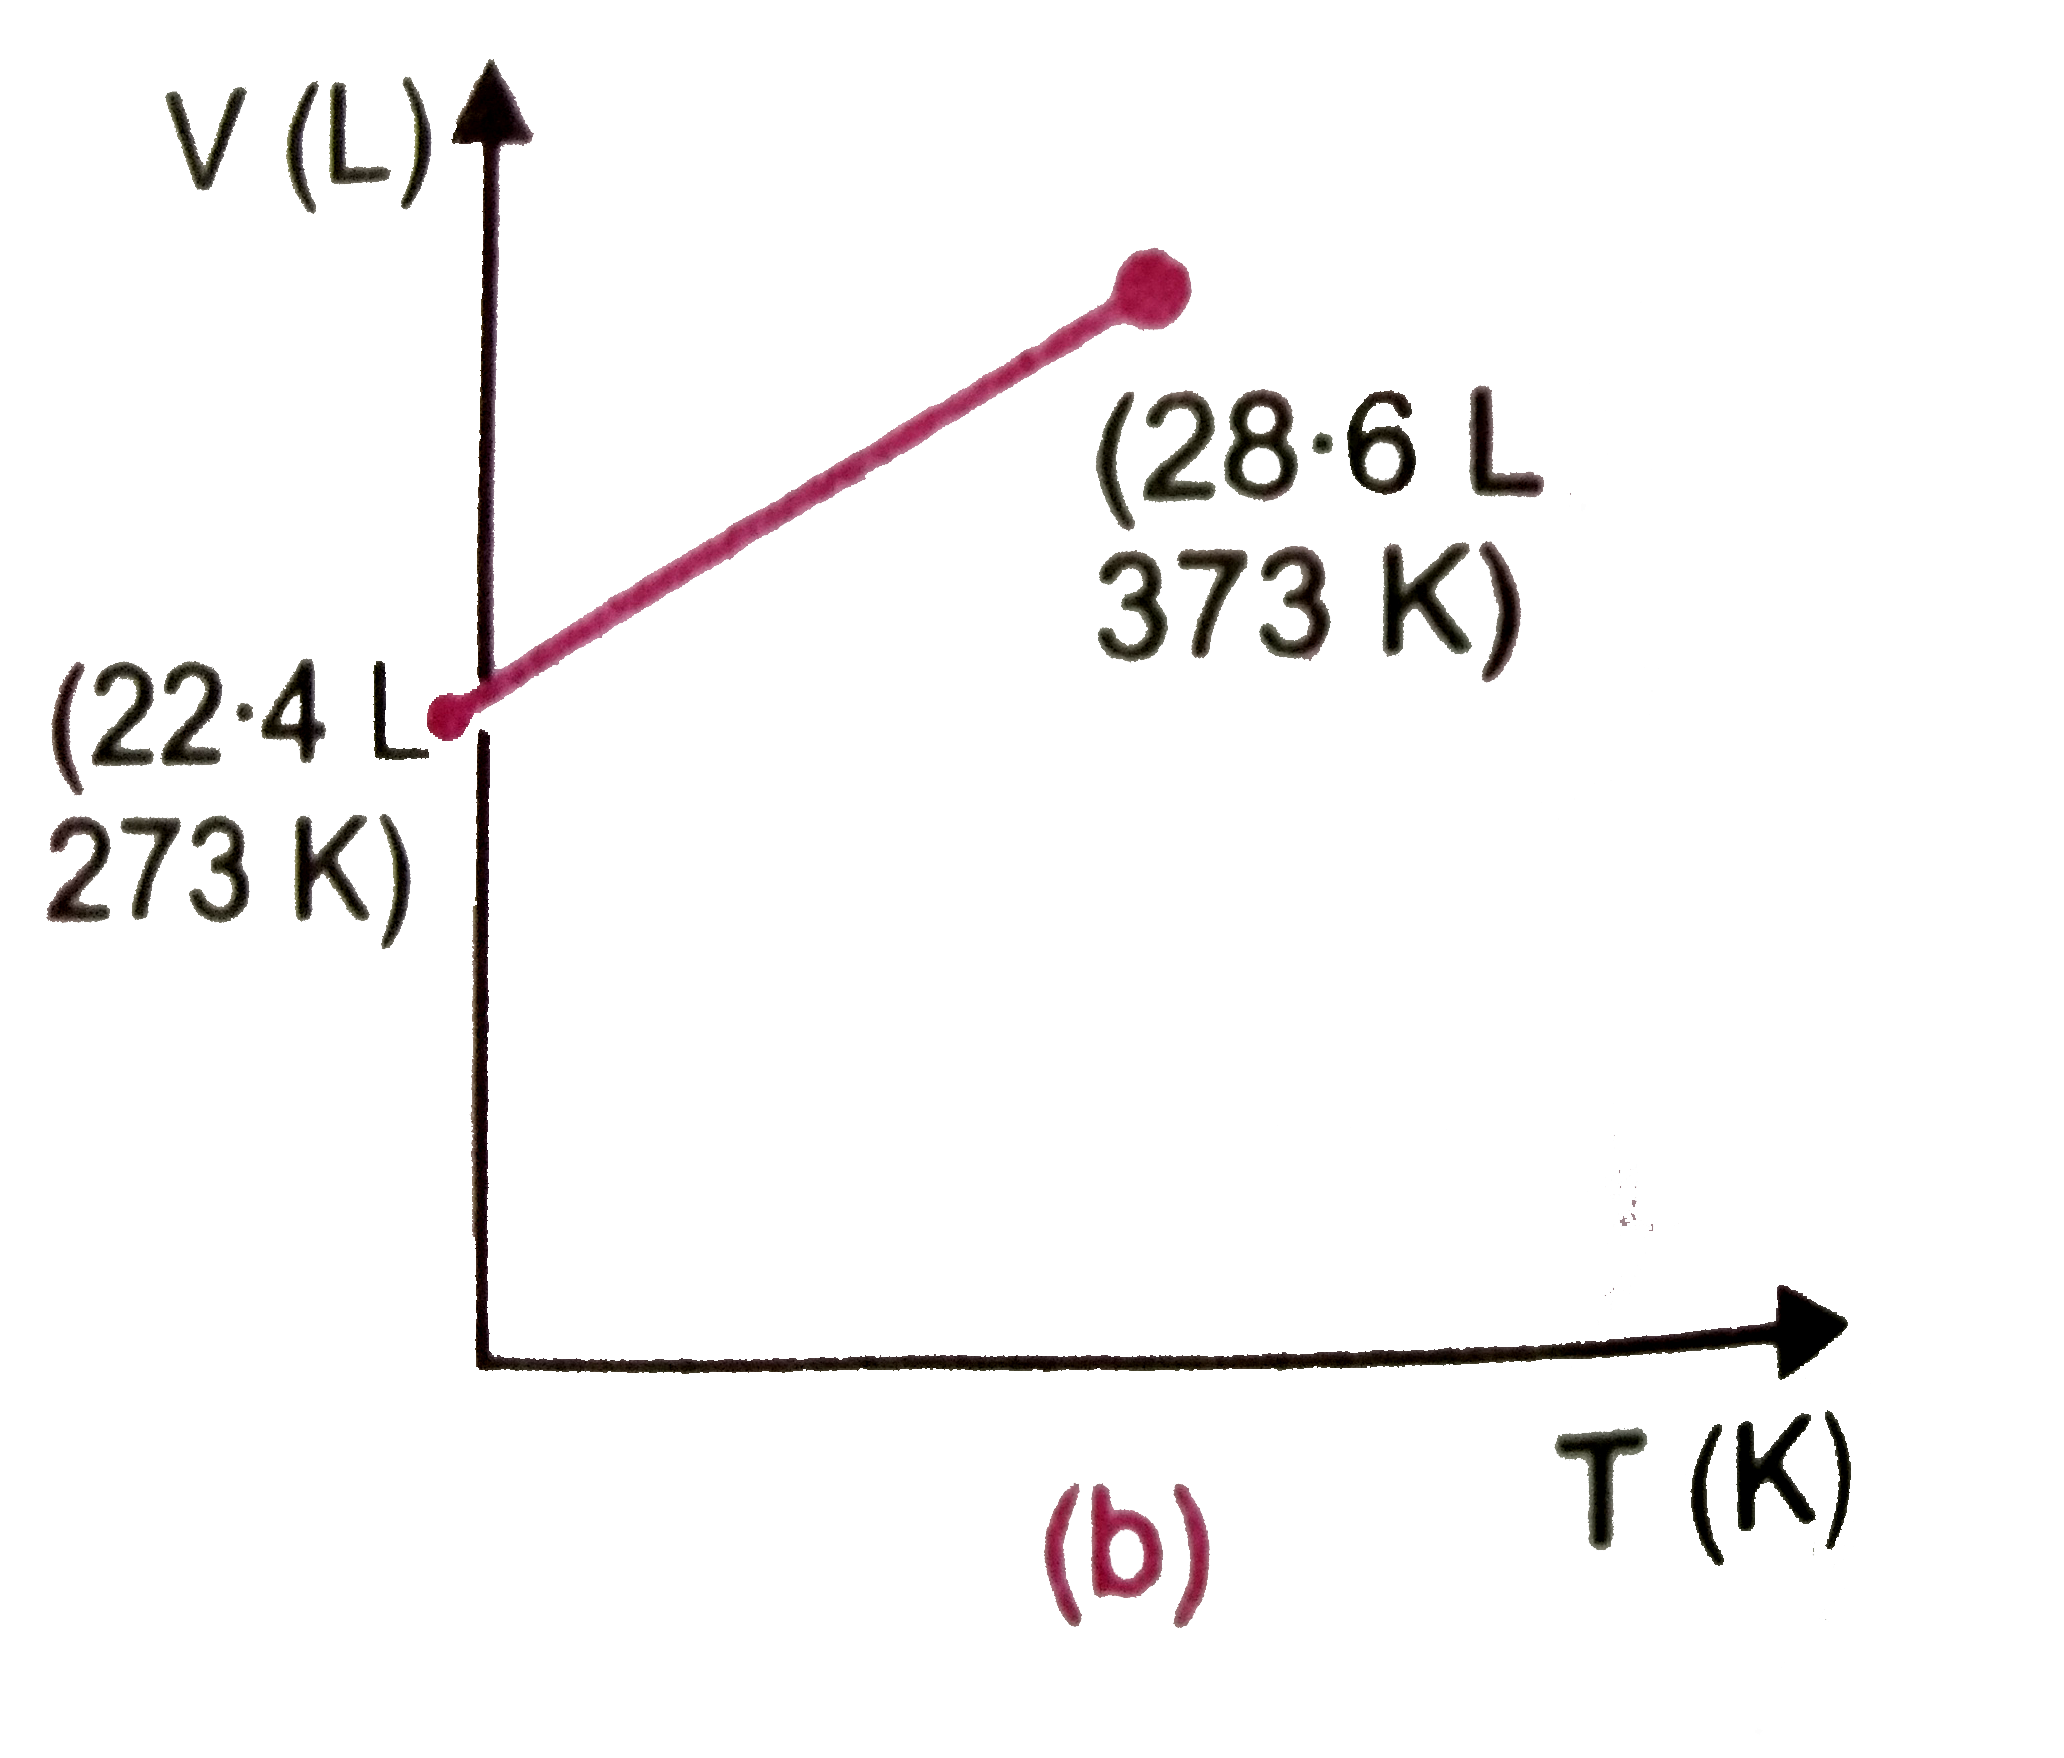 C
C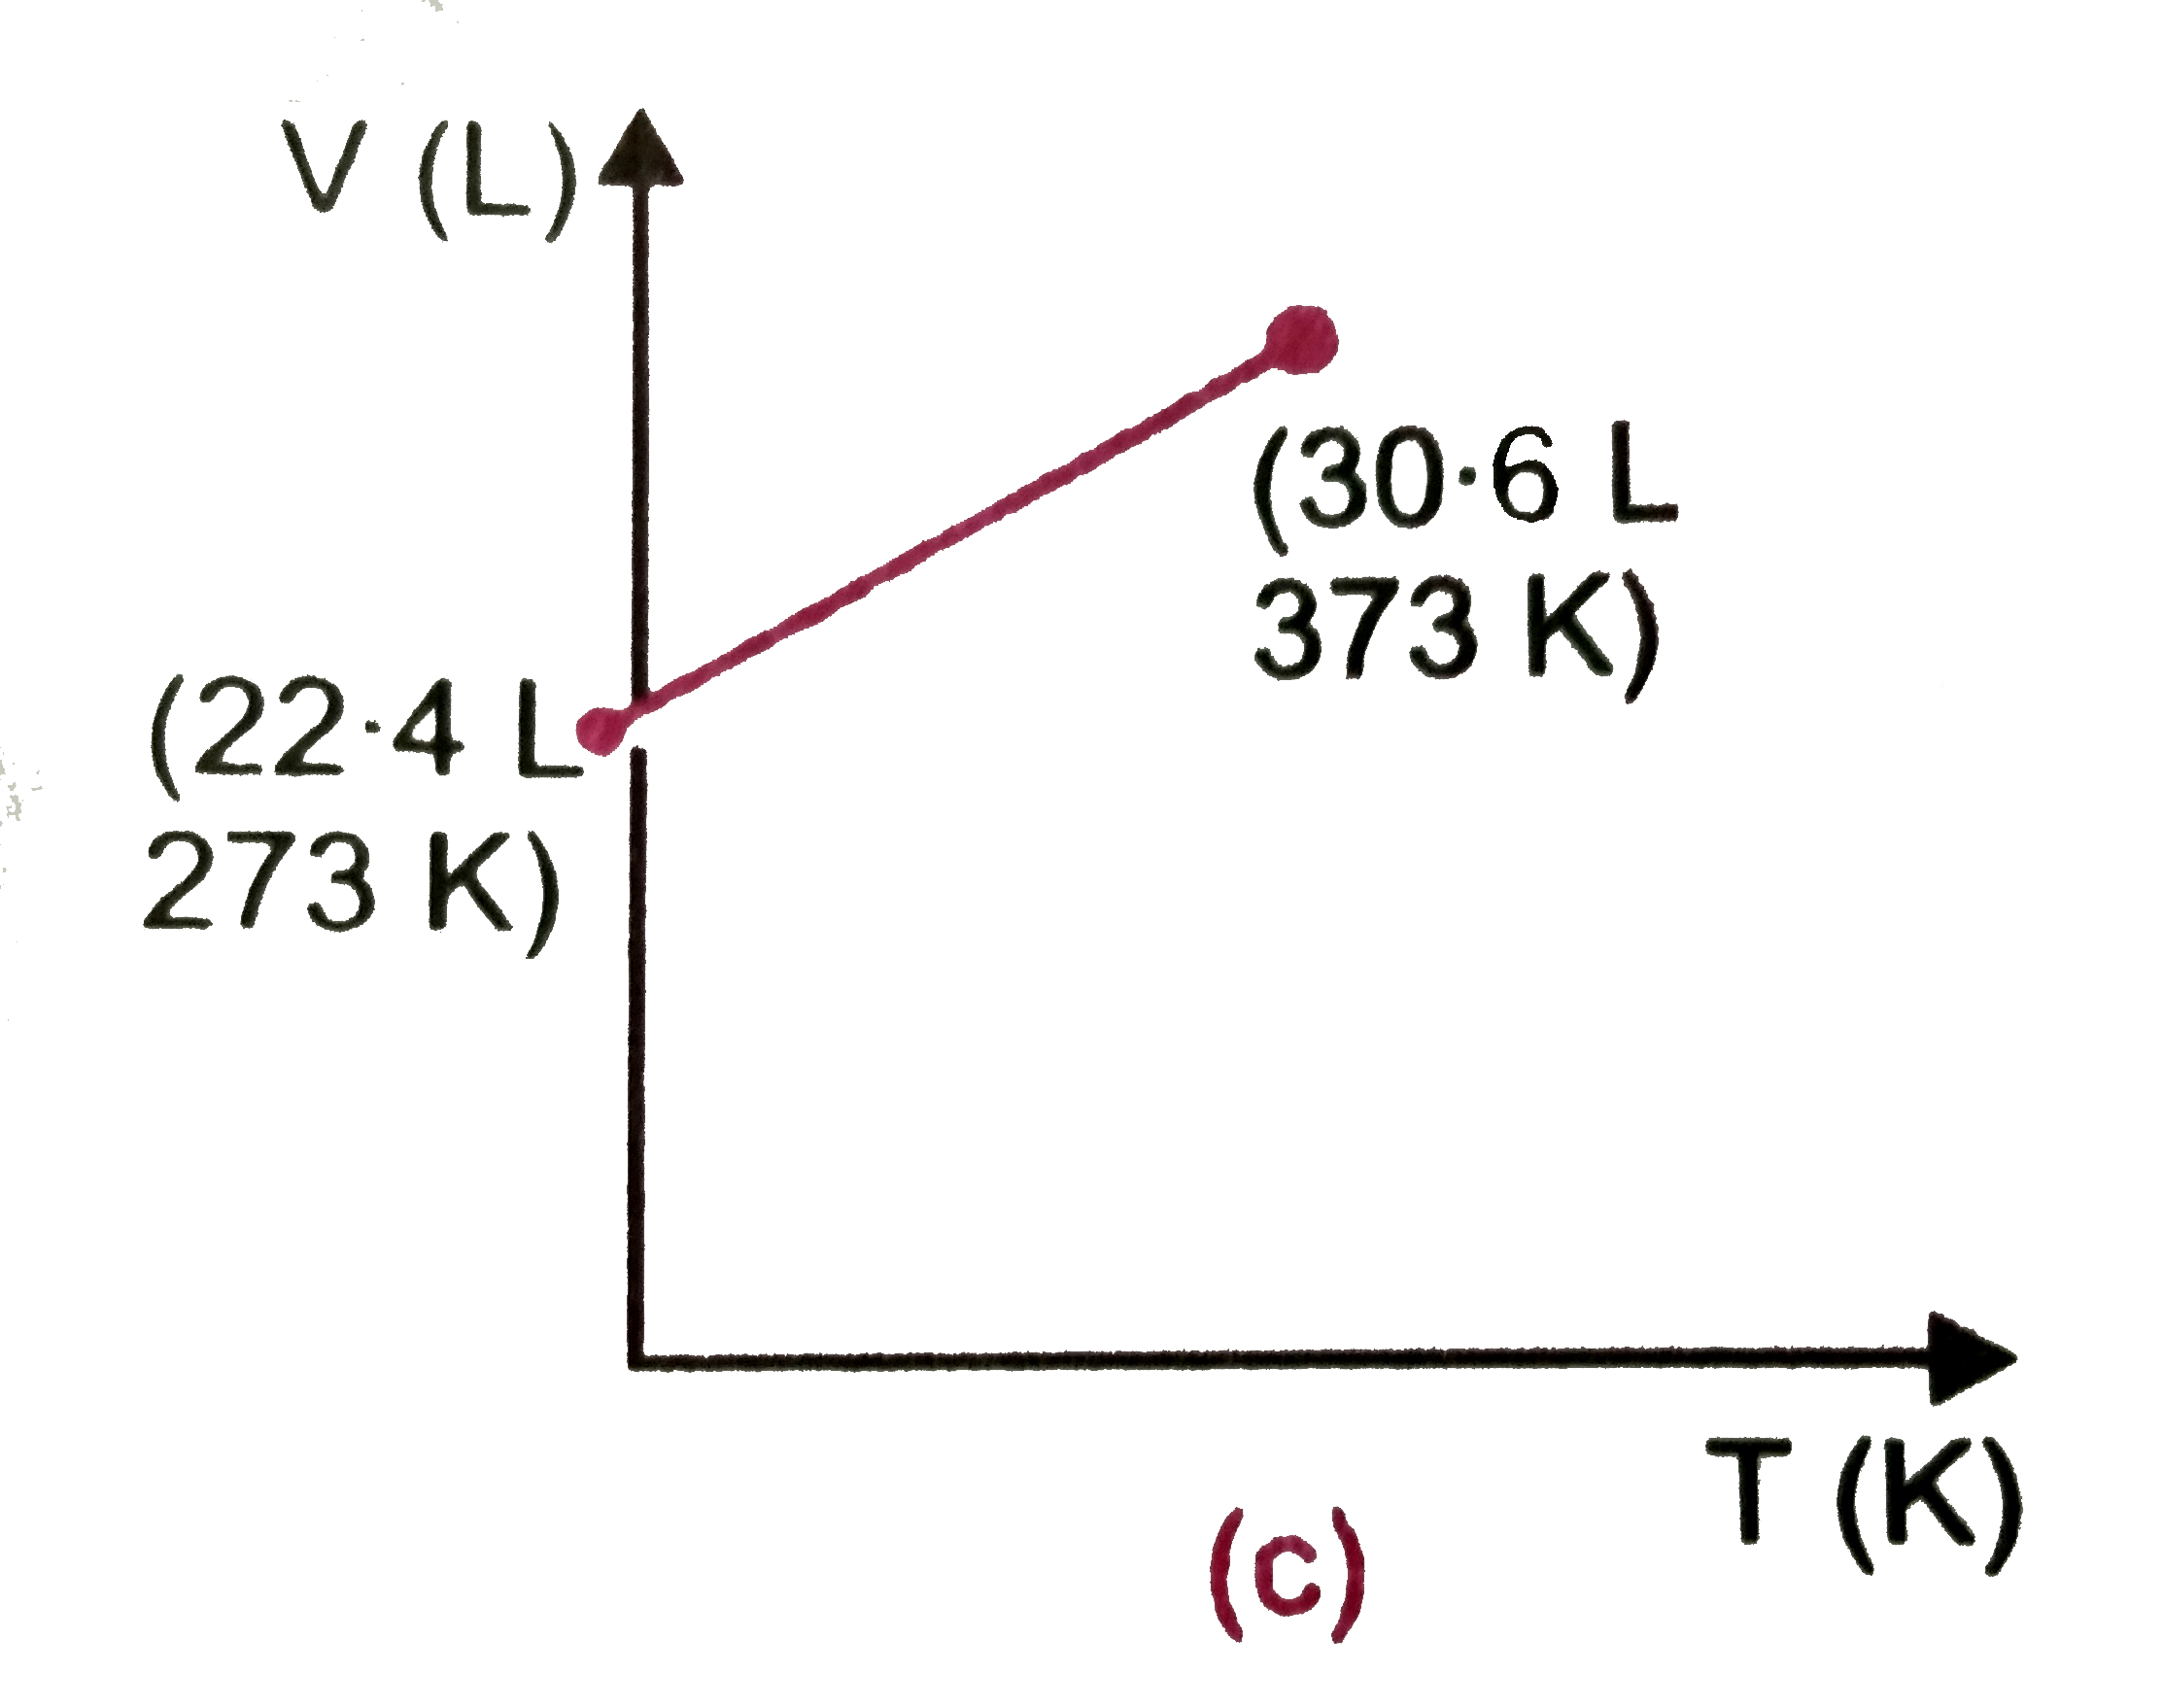 D
D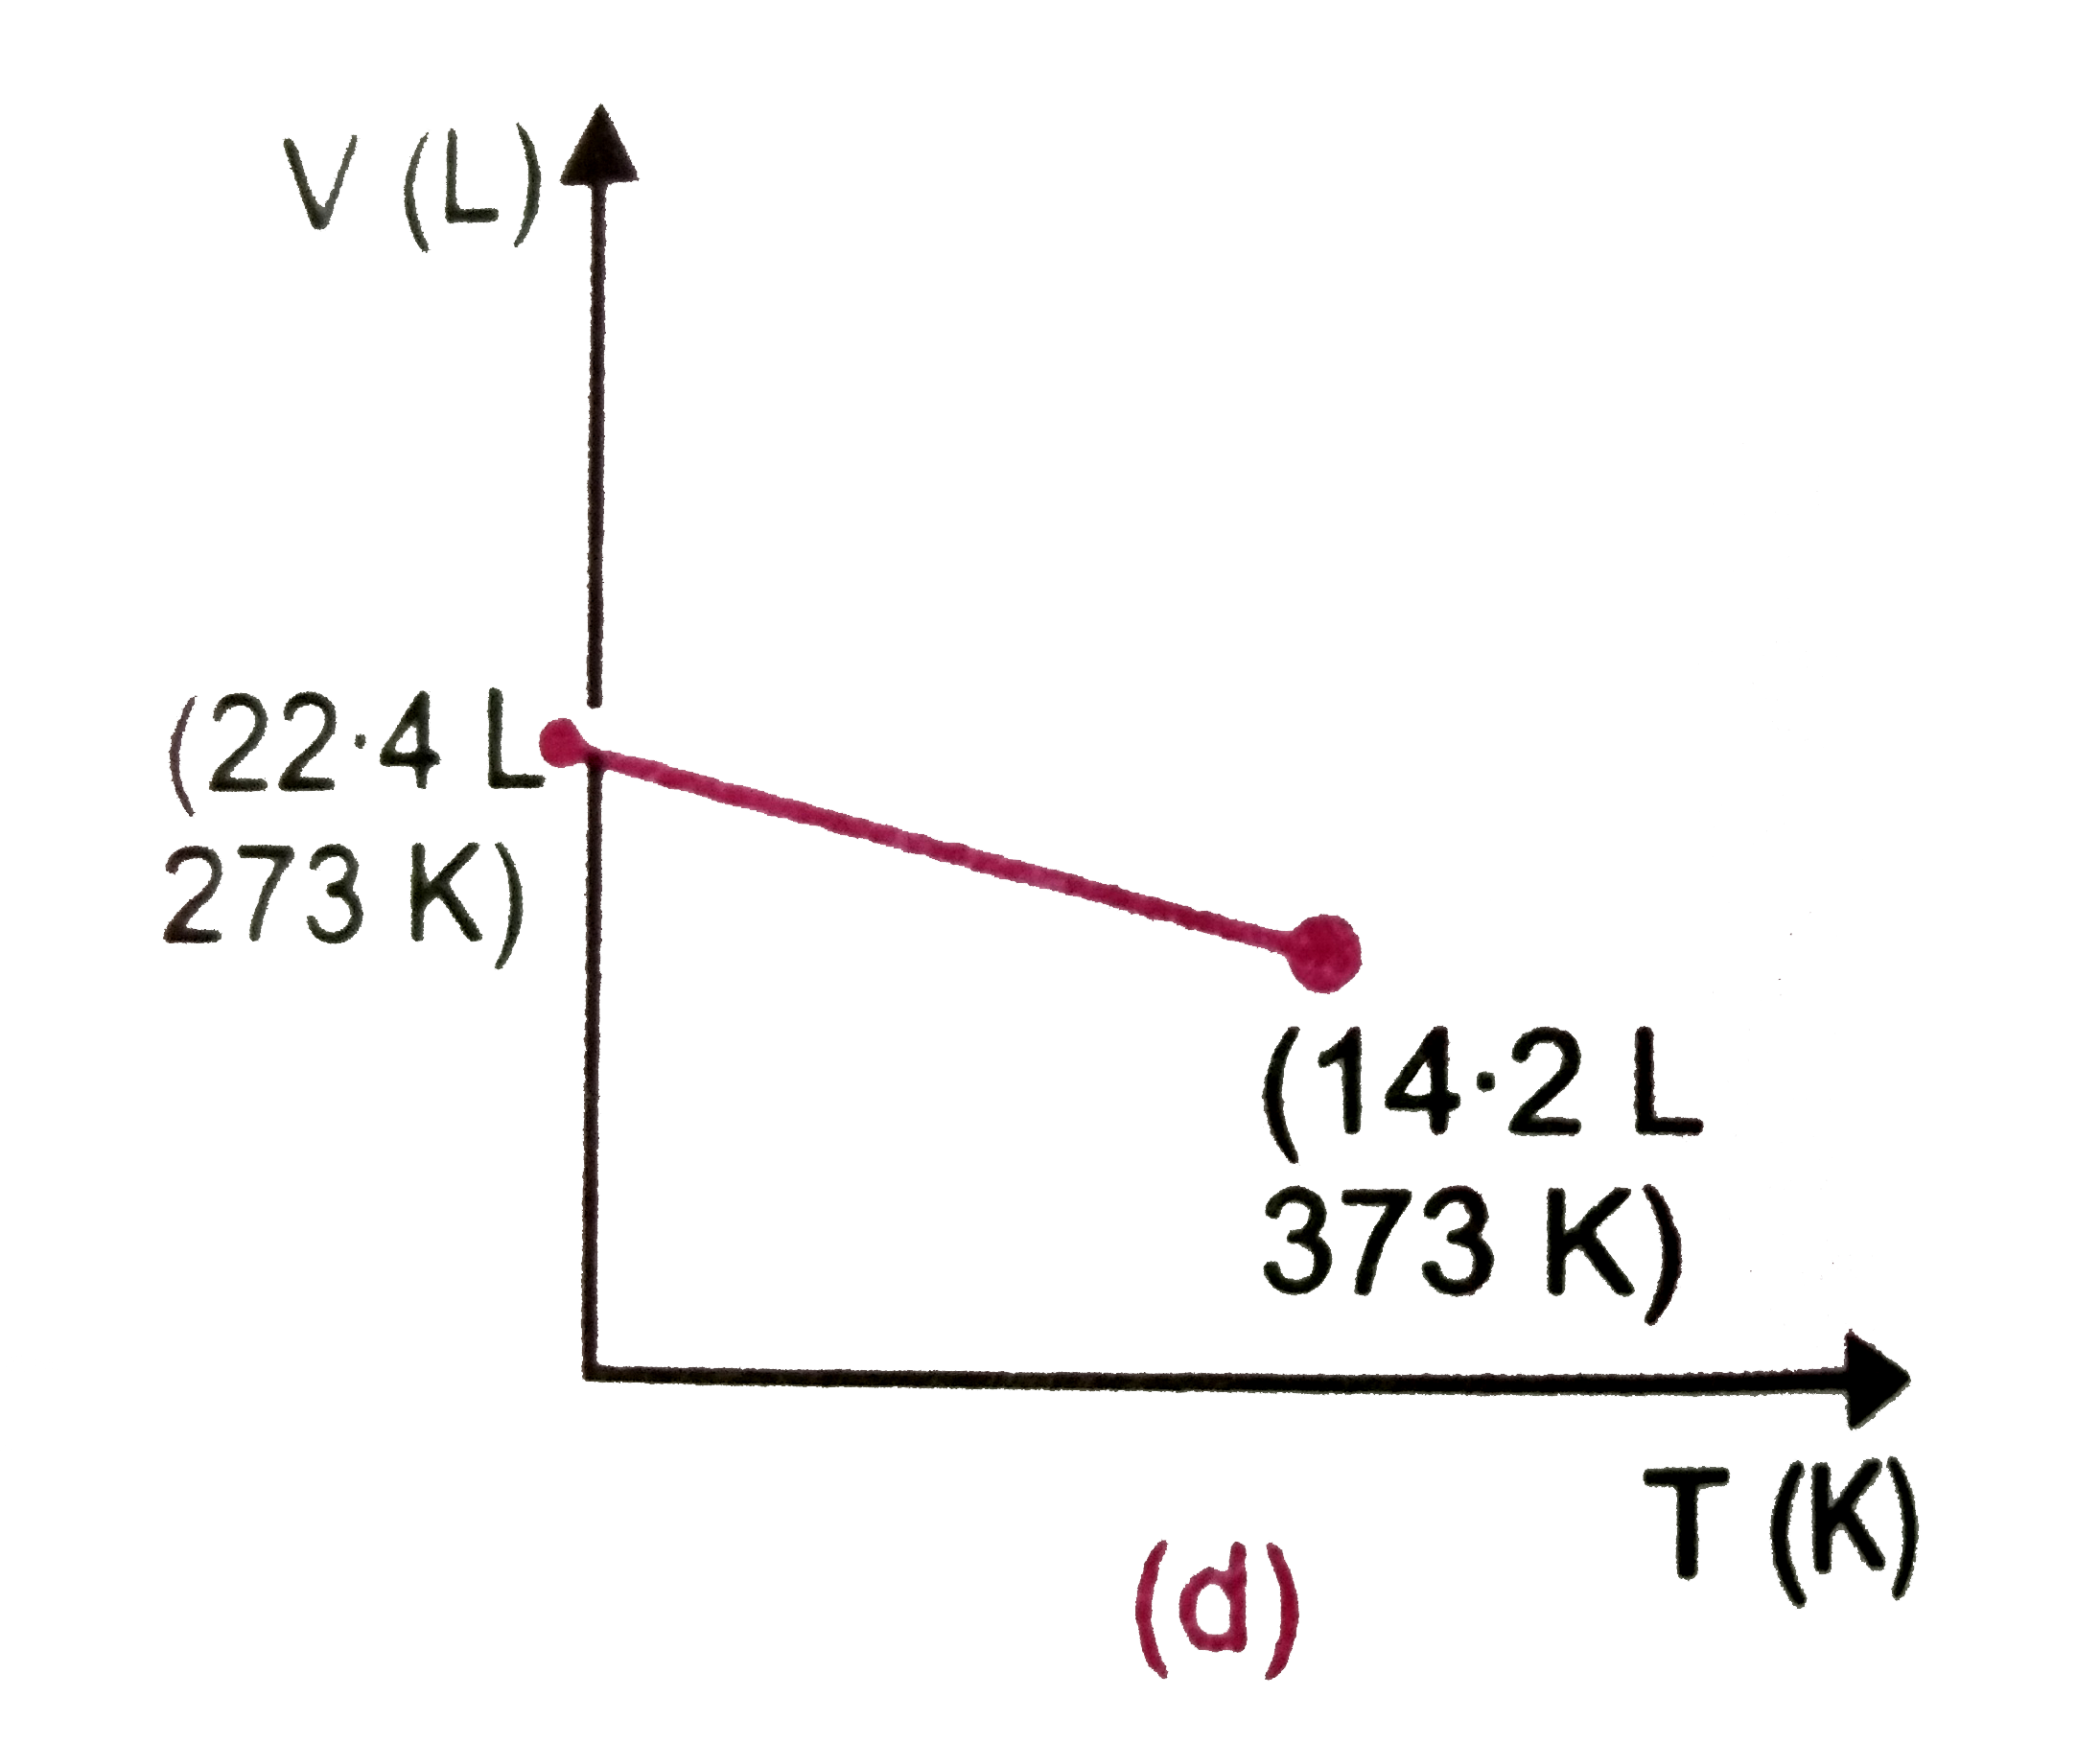
Which of the following volume (V) temperature (T) plots represents the behaviour of one mole of an ideal gas at one atmospheric pressure:
A B
B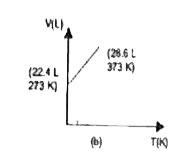 C
C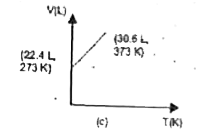 D
D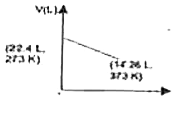
Which of the following volume-temperature (V−I) plots represents the behaviour of 1mole of an ideal gas at the atmospheric pressure?
View SolutionWhich one of the following volume (V)- temperature (T) plots represents the behaviour of one mole of an ideal gas at one atmosphere?
View SolutionThe graph that does represent the behaviour of an ideal gas is :
View SolutionWhich of the following graphs represent the behaviour of an ideal gas ?
View SolutionWhich of the following plots represents the behavior of an ideal binary liquid solution ?
View Solution
