A block of ice at −8∘C is slowly heated and converted to steam at 100∘C. Which of the following curves represents the phenomena qualitatively?
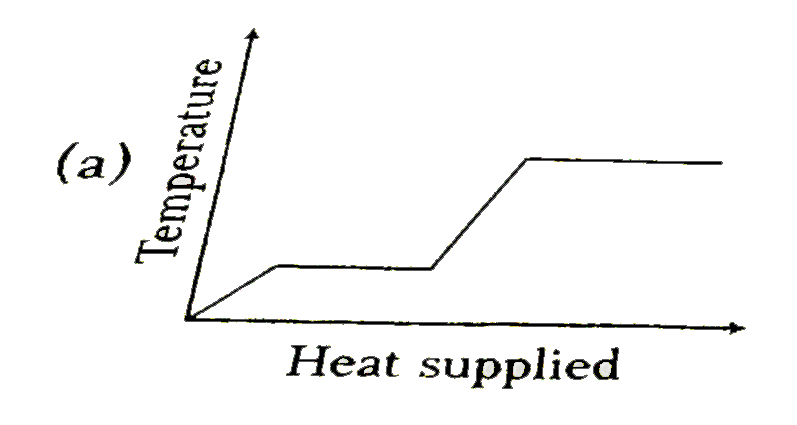


The correct Answer is:A
Temperature first increases from −10∘C to 0∘C. Then remains constant at 0∘C till whole ice is melted. Then it increases from 0∘C to 100p∘C. Again it remains constant at 100∘C till whole water converts into steam.
Topper's Solved these Questions
- CALORIMETRY AND HEAT TRANSFERBOOK - DC PANDEY ENGLISHCHAPTER - CALORIMETRY AND HEAT TRANSFEREXERCISE - Assertion and reason
17 Videos
- CALORIMETRY AND HEAT TRANSFERBOOK - DC PANDEY ENGLISHCHAPTER - CALORIMETRY AND HEAT TRANSFEREXERCISE - Match the columns
4 Videos
- CALORIMETRY AND HEAT TRANSFERBOOK - DC PANDEY ENGLISHCHAPTER - CALORIMETRY AND HEAT TRANSFEREXERCISE - Check points 16.4
29 Videos
- CALORIMETRY & HEAT TRANSFERBOOK - DC PANDEY ENGLISHCHAPTER - CALORIMETRY & HEAT TRANSFEREXERCISE - Level 2 Subjective
14 Videos
- CENTRE OF MASSBOOK - DC PANDEY ENGLISHCHAPTER - CENTRE OF MASSEXERCISE - Medical entrances gallery
27 Videos
Similar Questions
Knowledge Check
A block of ice at −10∘C is slowly heated and converted to steam at 100∘C. Which of the following curves represents the phenomenon qualitatively?
A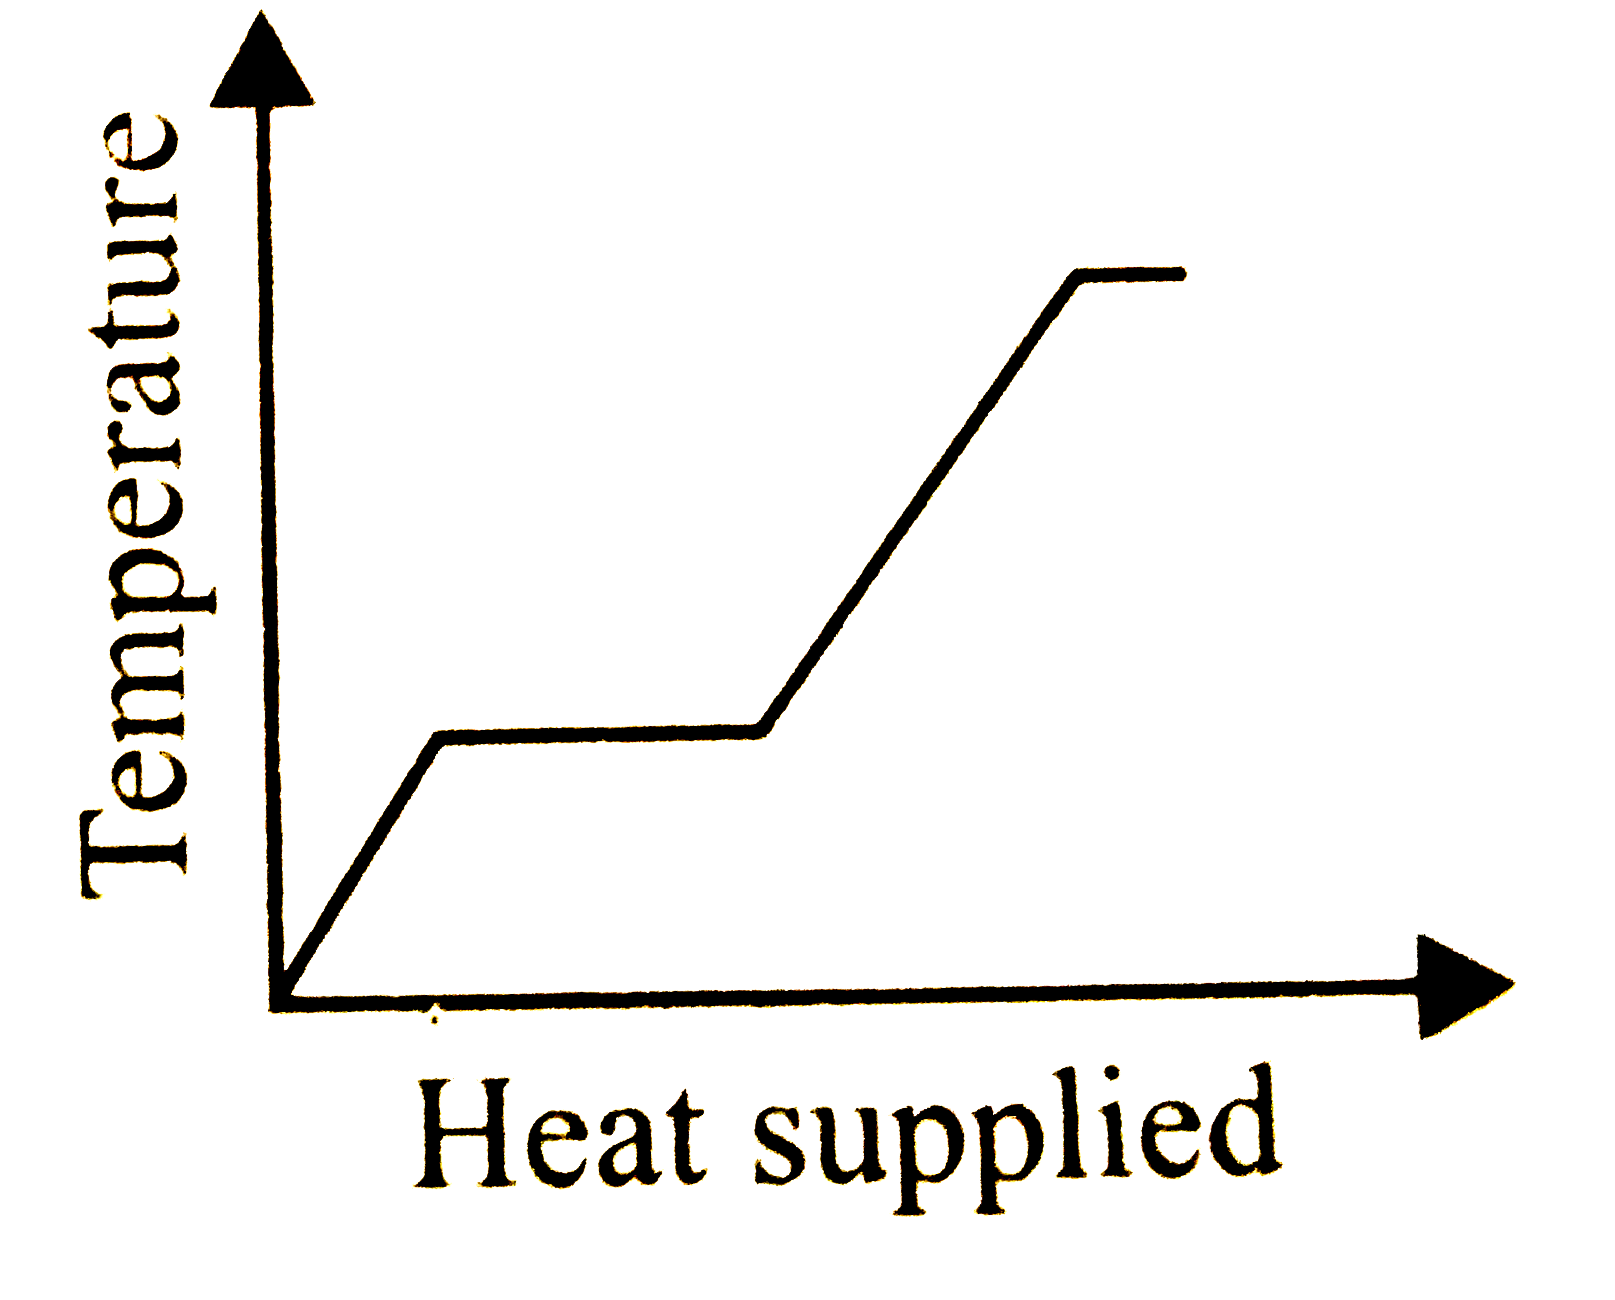 B
B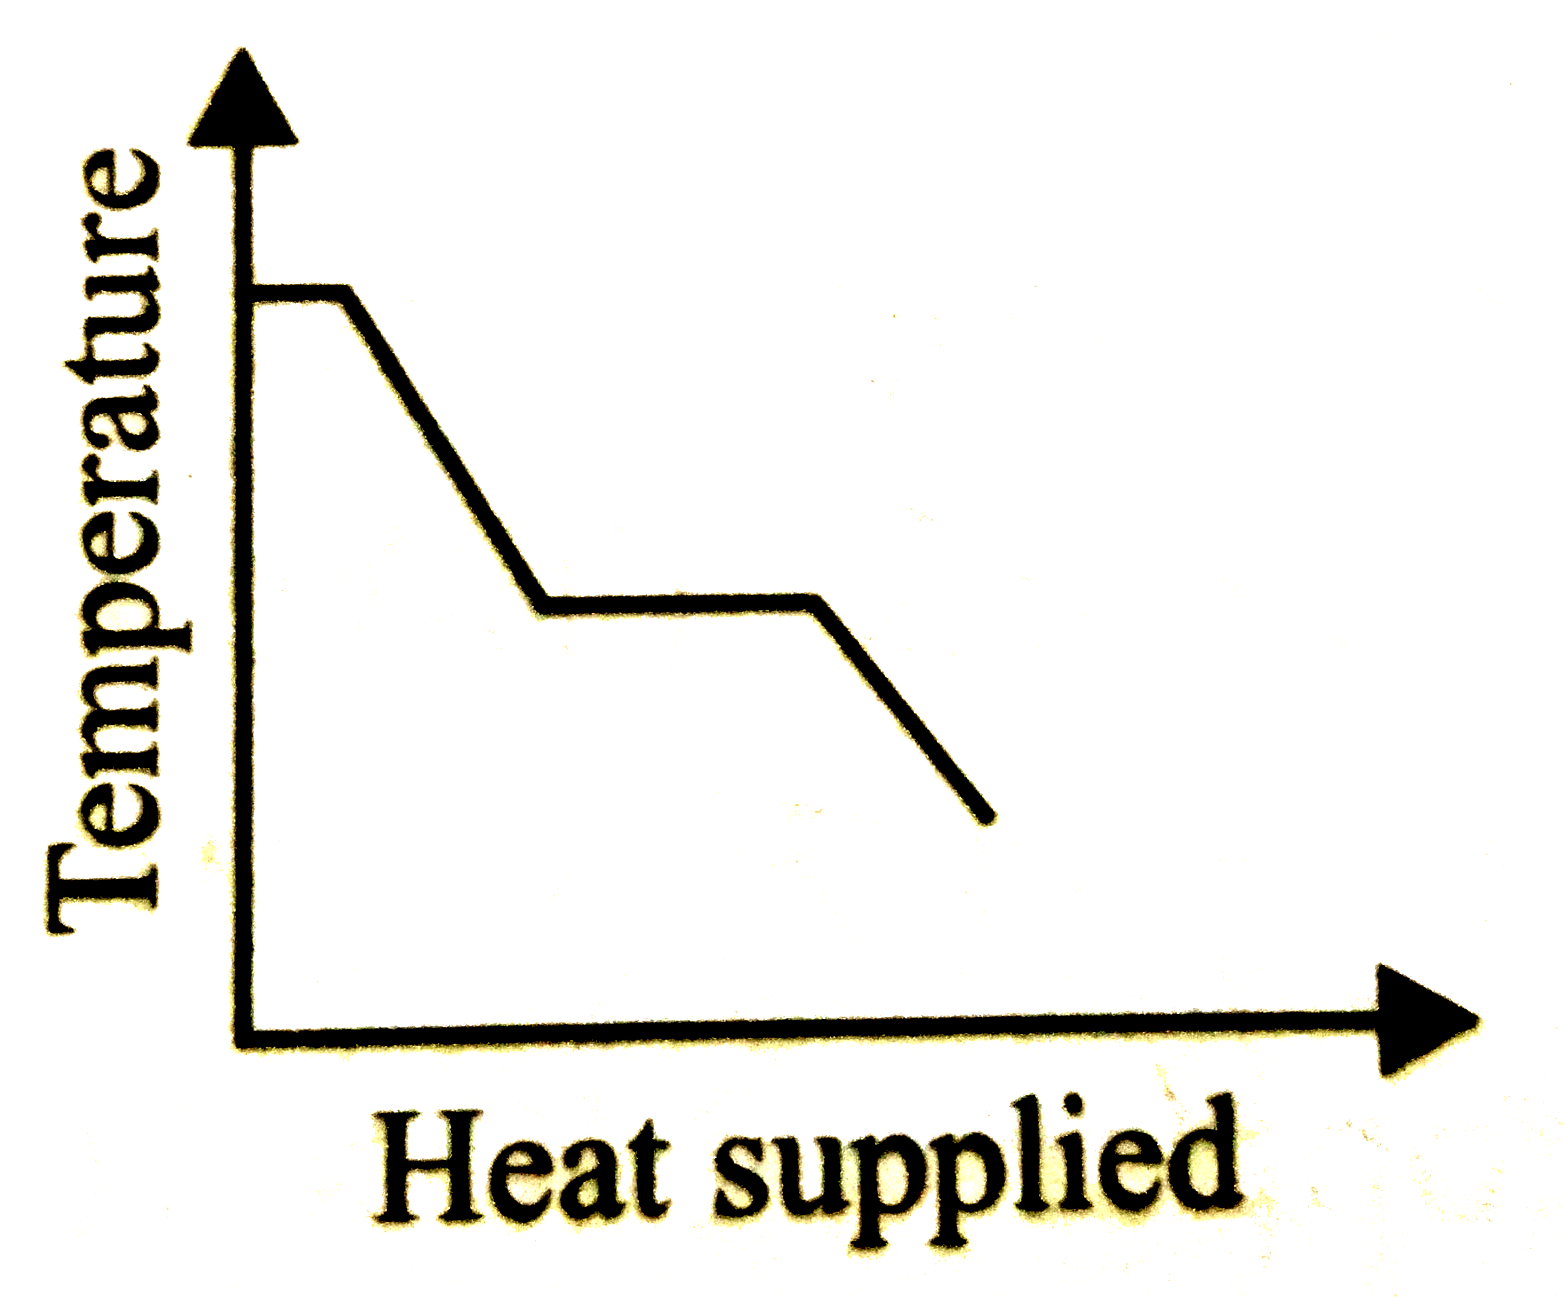 C
C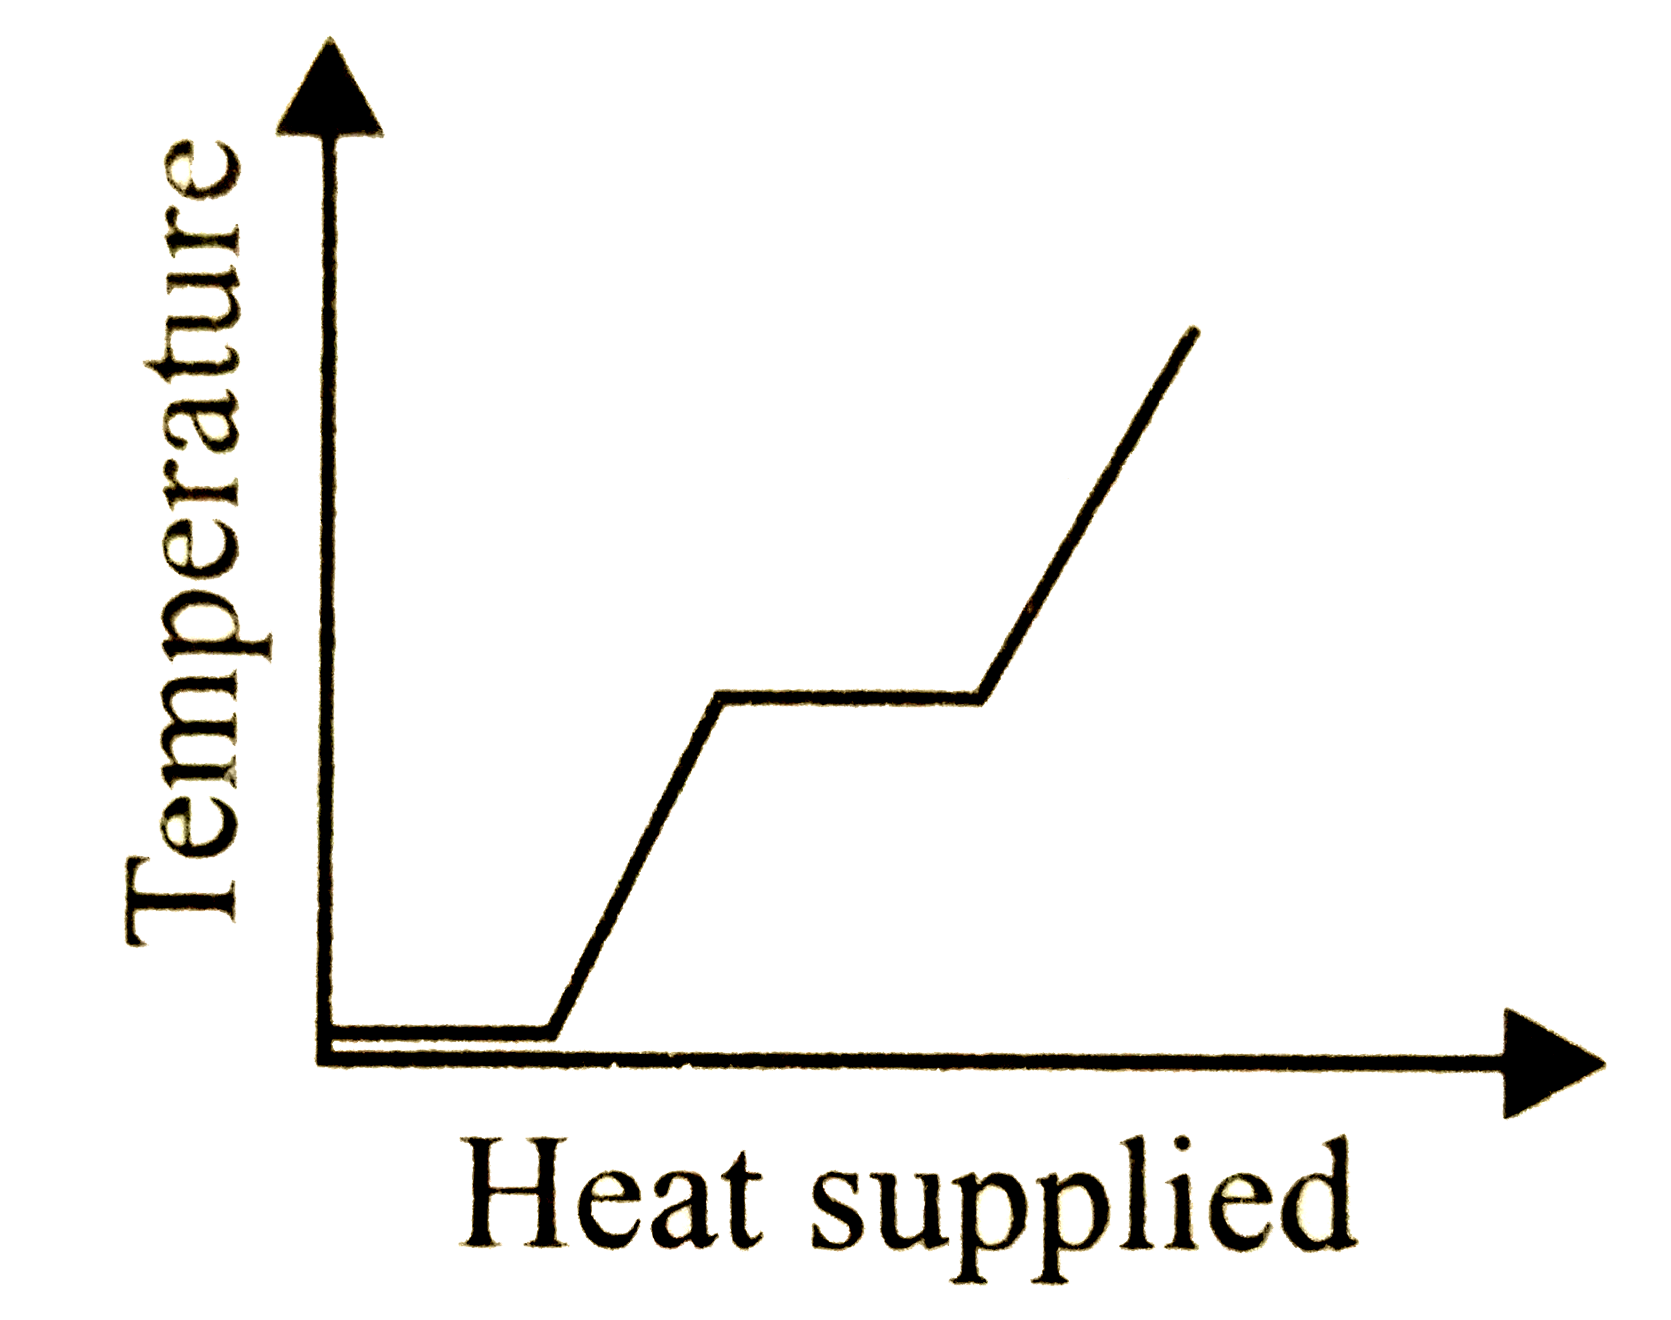 D
D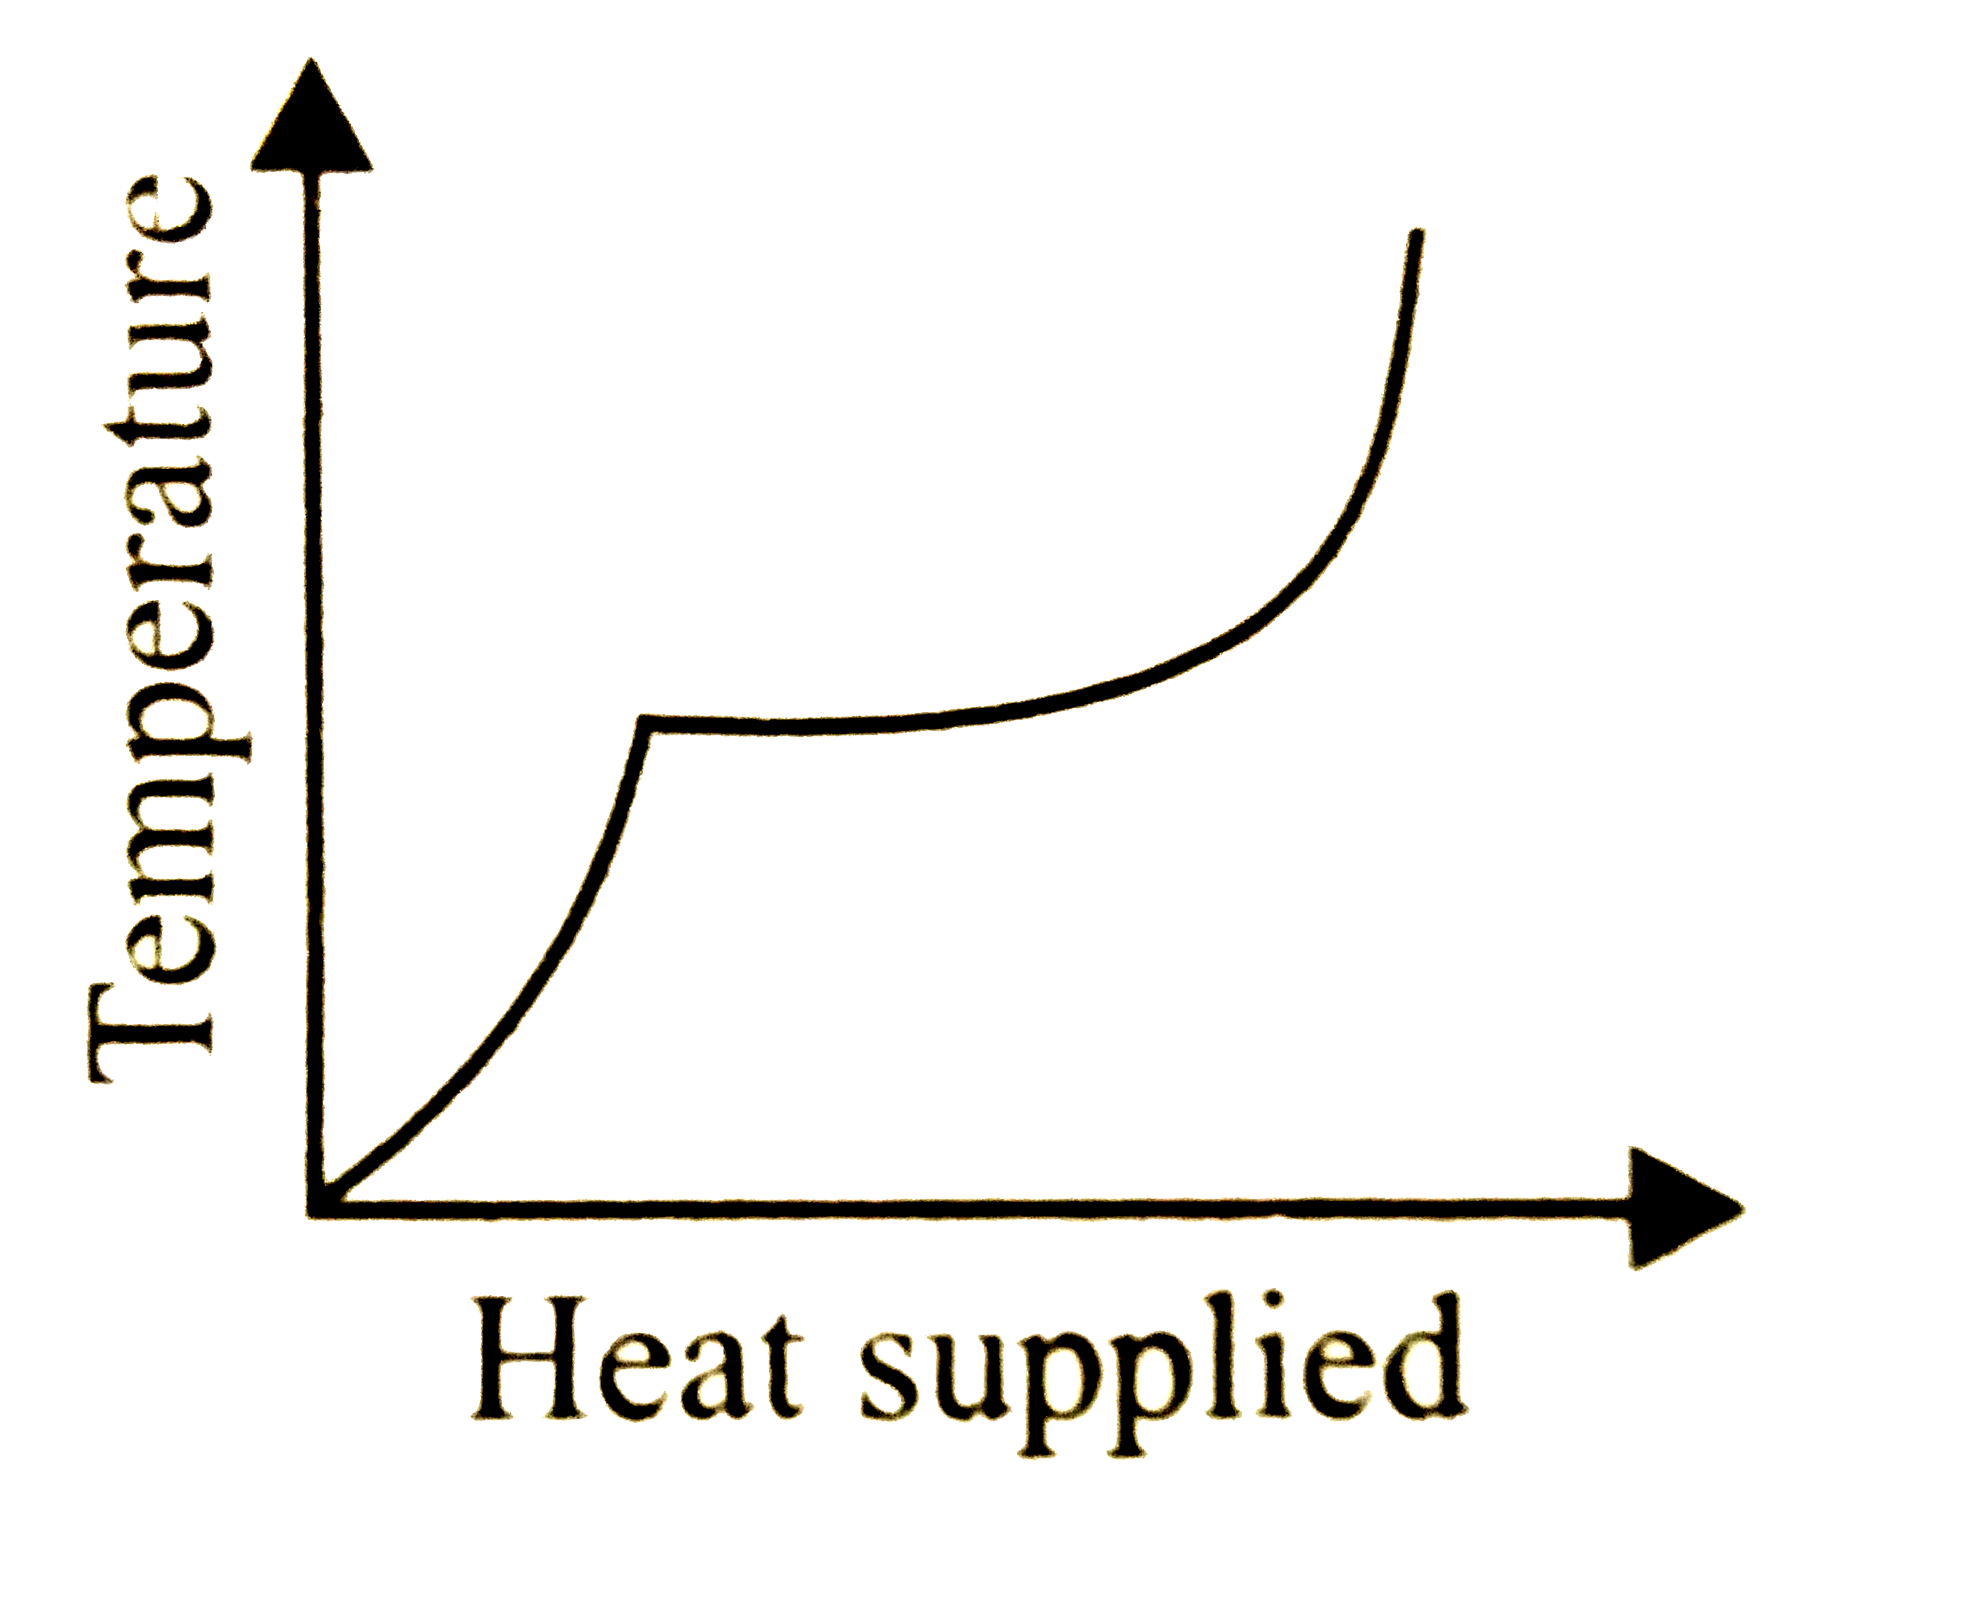
A block of ice, initially at −20∘C, is heated a steady rate until the temperature of the sample reaches 120∘C. Which of the following graphs best illustrates the temperature of the sample as a function of time?
A B
B C
C D
D
Heat required to convert 1 g of ice at 0∘C into steam at 100∘C is
View Solution1 g of water at 100∘C is completely converted into steam at 100∘C. 1g of steam occupies a volume of 1650cc. (Neglect the volume of 1g of water at 100∘C). At the pressure of 105N/m2, latent heat of steam is 540 cal/g (1 Calorie=4.2 joules). The increase in the internal energy in joules is
View Solution30 g ice at 0∘C is mixed with 25 g steam at 100∘C. Find the final temperature and composition
View SolutionA certain mass of ice at 0∘C is converted to steam at 100∘C by constant heating, Draw temperature-time graph showing the change in phases.
View SolutionA certain mass of ice at 0∘C is converted to steam at 100∘C by constant heating, Draw temperature-time graph showing the change in phases.
View SolutionWork done in converting 1 g of ice at −10∘C into steam at 100∘C is
View Solution
