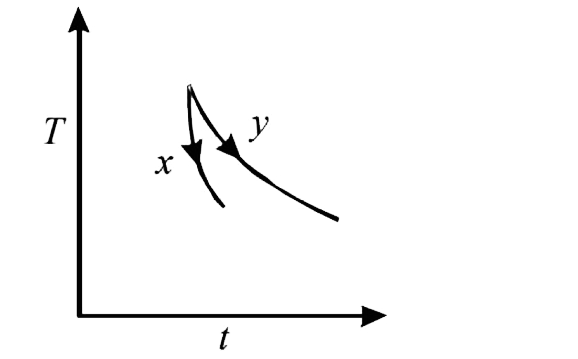
The graph, shown in the adjacent diagram, represents the variation of temperature (T) of two bodies, x and y having same surface area, with time (t) due to the emission of radiation. Find the correct relation between the emissivity and absorptivity power of the two bodies

The correct Answer is:C
Ratio of cooling emissivity(e)
From graph,
Further emissivity absorptive power (a)
therefore good absorbers are good emitters)
Topper's Solved these Questions
- CALORIMETRY AND HEAT TRANSFERBOOK - DC PANDEY ENGLISHCHAPTER - CALORIMETRY AND HEAT TRANSFEREXERCISE - Assertion and reason
17 Videos
- CALORIMETRY AND HEAT TRANSFERBOOK - DC PANDEY ENGLISHCHAPTER - CALORIMETRY AND HEAT TRANSFEREXERCISE - Match the columns
4 Videos
- CALORIMETRY AND HEAT TRANSFERBOOK - DC PANDEY ENGLISHCHAPTER - CALORIMETRY AND HEAT TRANSFEREXERCISE - Check points 16.4
29 Videos
- CALORIMETRY & HEAT TRANSFERBOOK - DC PANDEY ENGLISHCHAPTER - CALORIMETRY & HEAT TRANSFEREXERCISE - Level 2 Subjective
14 Videos
- CENTRE OF MASSBOOK - DC PANDEY ENGLISHCHAPTER - CENTRE OF MASSEXERCISE - Medical entrances gallery
27 Videos
Similar Questions
Two bodies A and B having equal surface areas are maintained at temperatures 10∘C . And 20∘C . The thermal radiation emitted in a given time by A and B are in the ratio
View SolutionHeat energy at constant rate is given to two substances P and Q. If variation of temperature (T) of substances with time (t) is as shown in figure, then select the correct statement
View SolutionWhich of the following x-t graphs represents the distance-time variation of a body released from the top of a buiding?
View SolutionA body at a temperature of 727∘C and having surface area 5cm2, radiations 300J of energy each minute. The emissivity is(Given Boltzmann constant =5.67×10⁻⁸Wm−2K−4
View SolutionWhich of the following graphs correctly represents the relation between In (E) and In (T), where E is the amount of radiation emitted per unit time from a unit area of the body and T is the absolute temperature ?
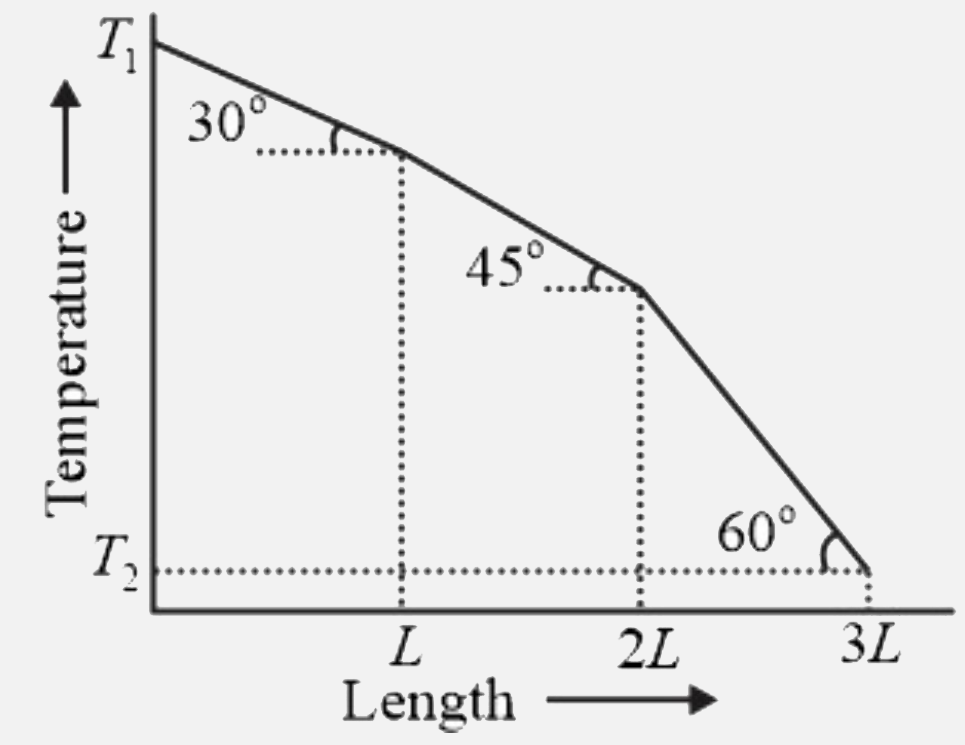
View SolutionThree rods of the same length and the same area of the cross-section are joined. The temperature of two ends one T1 and T2 as shown in the figure.
 As we move along the rod the variation of temperature are as shown in the following [Rods are insulated from the surrounding except at the faces]

View SolutionThe peak emission from a black body at a certain temprature occurs at a wavelength of 9000Å. On increase its temperature , the total radiation emmited is increased its 81 times. At the intial temperature when the peak radiation from the black body is incident on a metal surface , it does not cause any photoemission from the surface . After the increase of temperature, the peak from the black body caused photoemission. To bring these photoelectrons to rest , a potential equivalent to the excitation energy between n=2andn=3 bohr levels of hydrogen atoms is required. Find the work function of the metal.
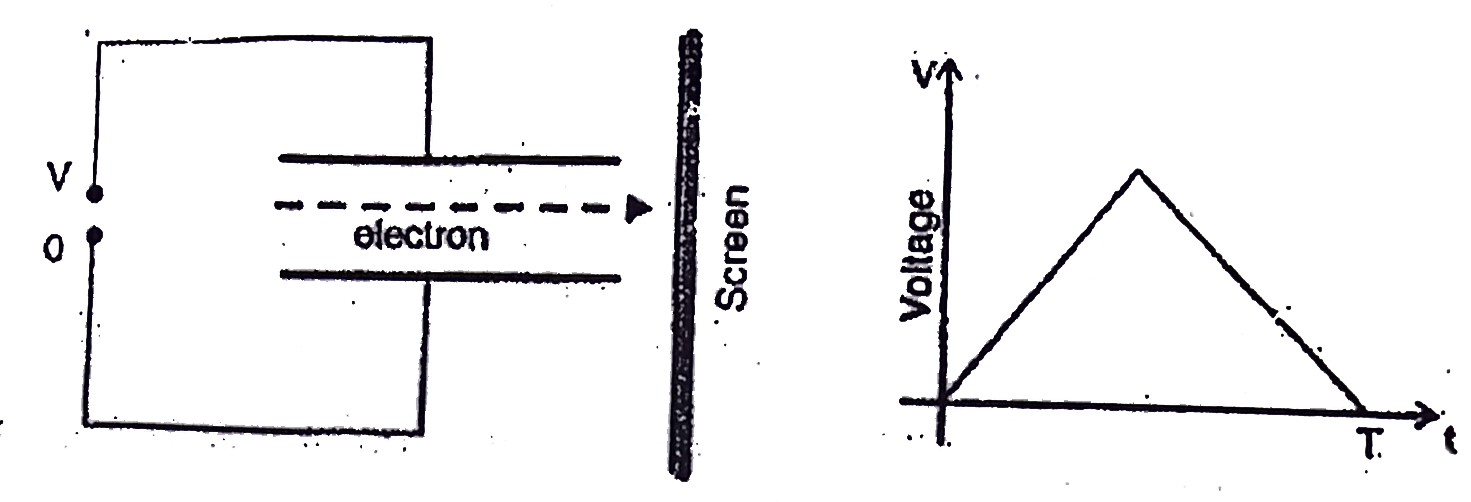
View SolutionAn electron passes between two parallel plate of a capacitor as shown in the diagram. The electron enters the plate at t=0 and it comes out of the plates at time t=T. The electron hits the screen at A, as shown. Now a time varying potential difference V is applied between the plates, as shown in the graph. (Neglect the gravity). The point where the electron now will strike (as compared to point A) will be

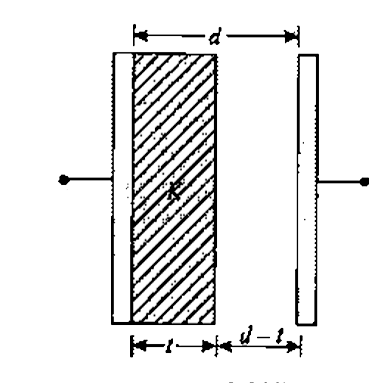
View SolutionA parallel plate capacitor consists of two metal plates of area A and separation d. A slab of thickness t and electric constant K is inserted between the plates with its faces parallel to the plates and having the same surface area as that of the plates. Find the capacitance of the system.
IF K=2, for what value of t/d will the capacitance of the system be 3/2 times that of the air capacitor? Calculate the energy in the two cases and account for the energy change.

View SolutionTwo bodies A and B of equal masses, area and emissivity cooling under Newton's law of cooling from same temperature are represented by the graph: If θ is the instantaneous temperature of the body and θ0, is the temperature of surroundings, then relationship between their specific heats is
View Solution
