A body is performing simple harmonic motion with amplitude a and time period T variation of its acceleration (f) with time(t) is shown in figure If at time t velocity of the body is v which of the following graph is correct?

The correct Answer is:D
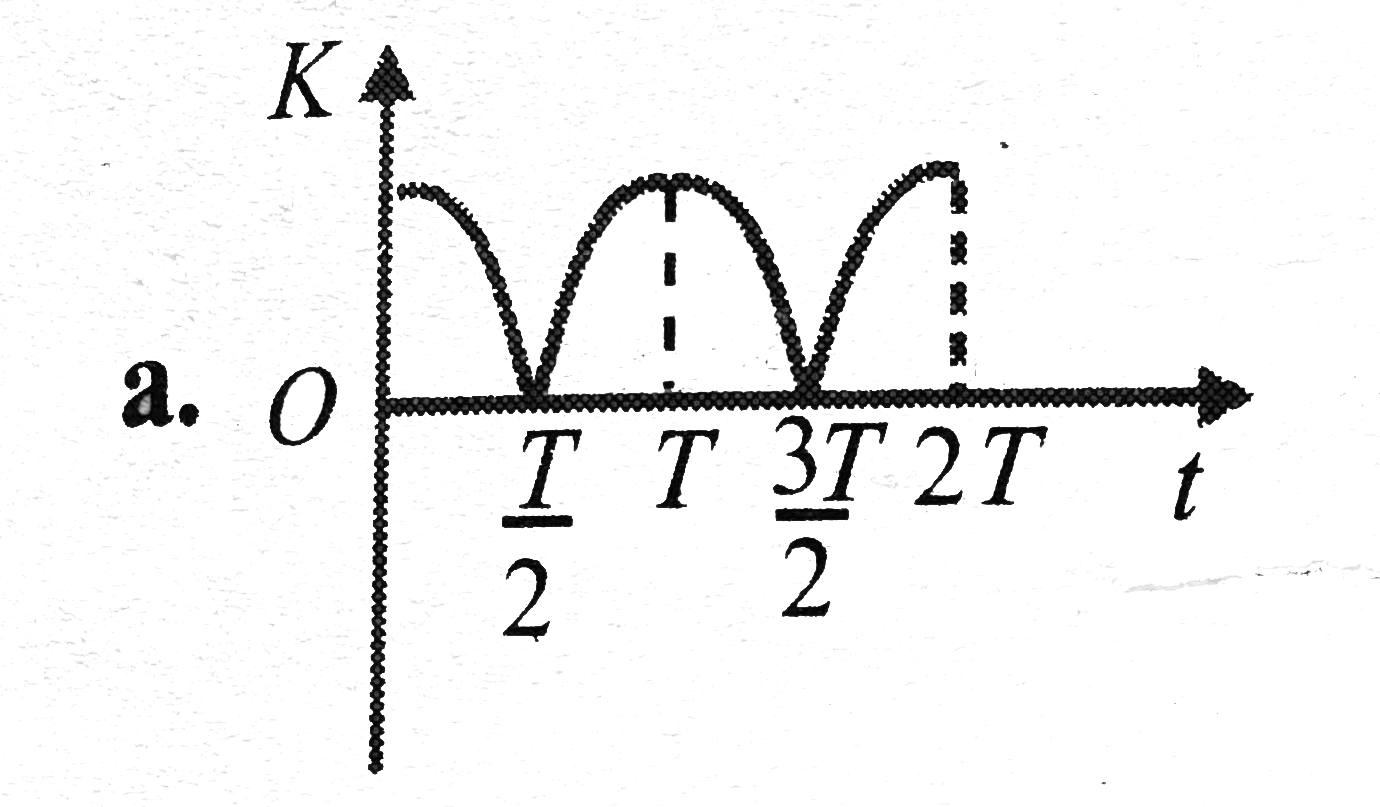
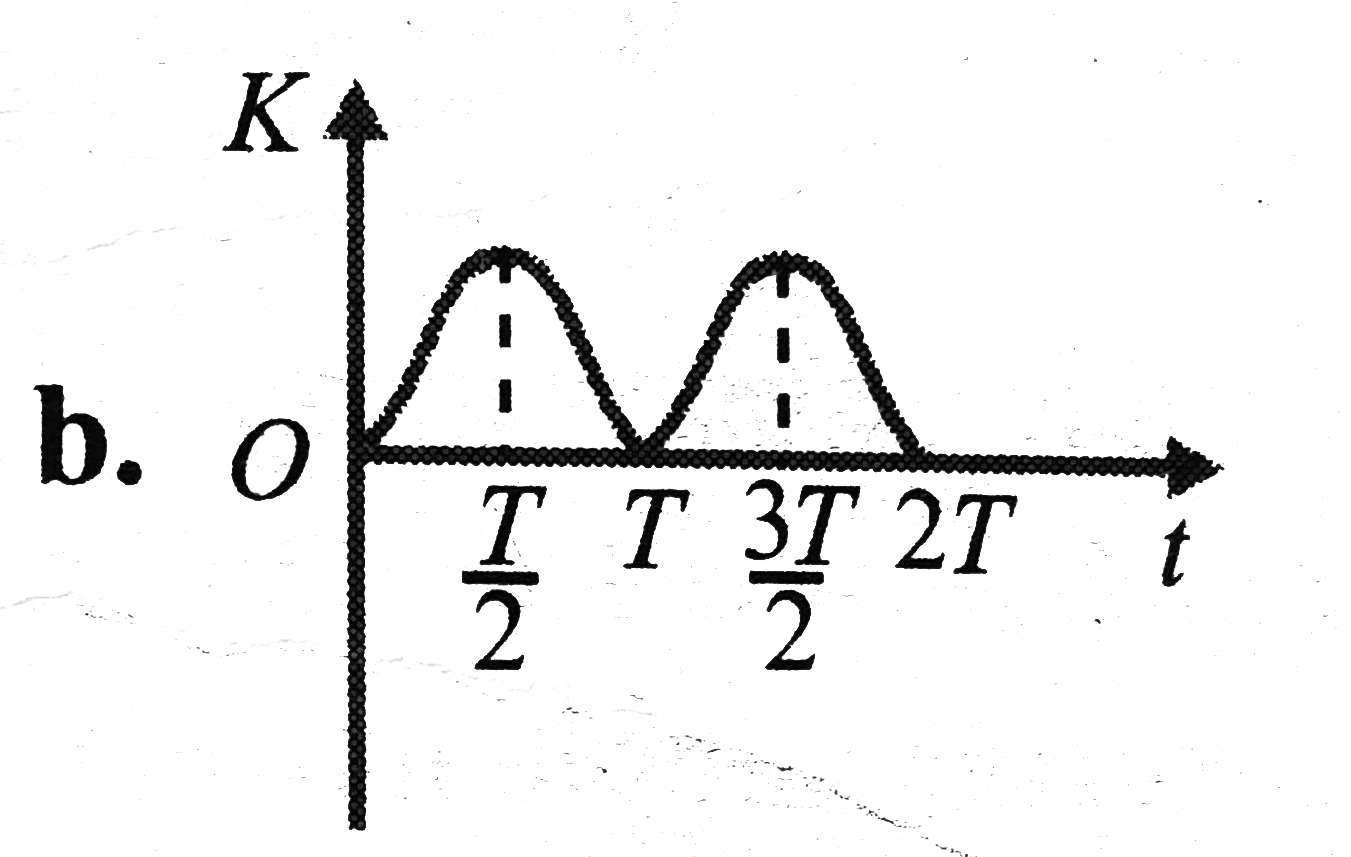
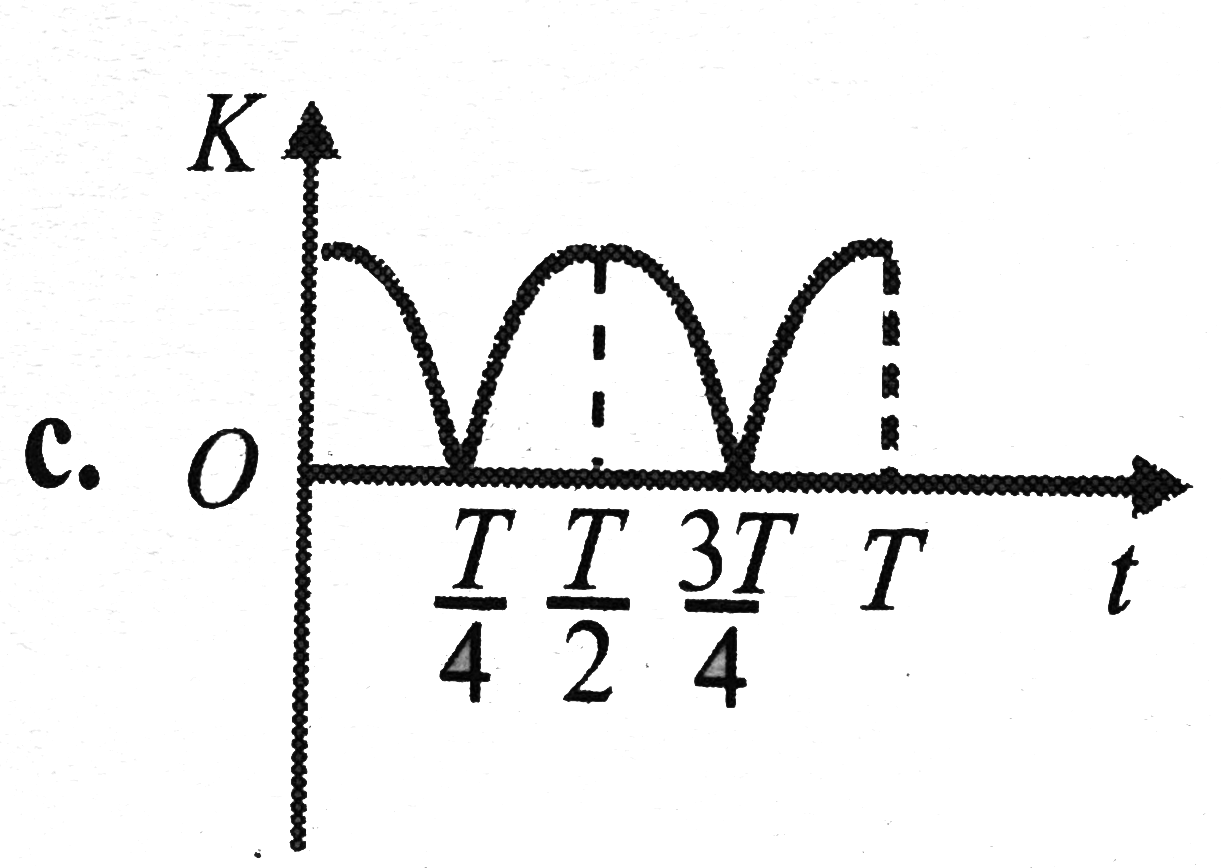
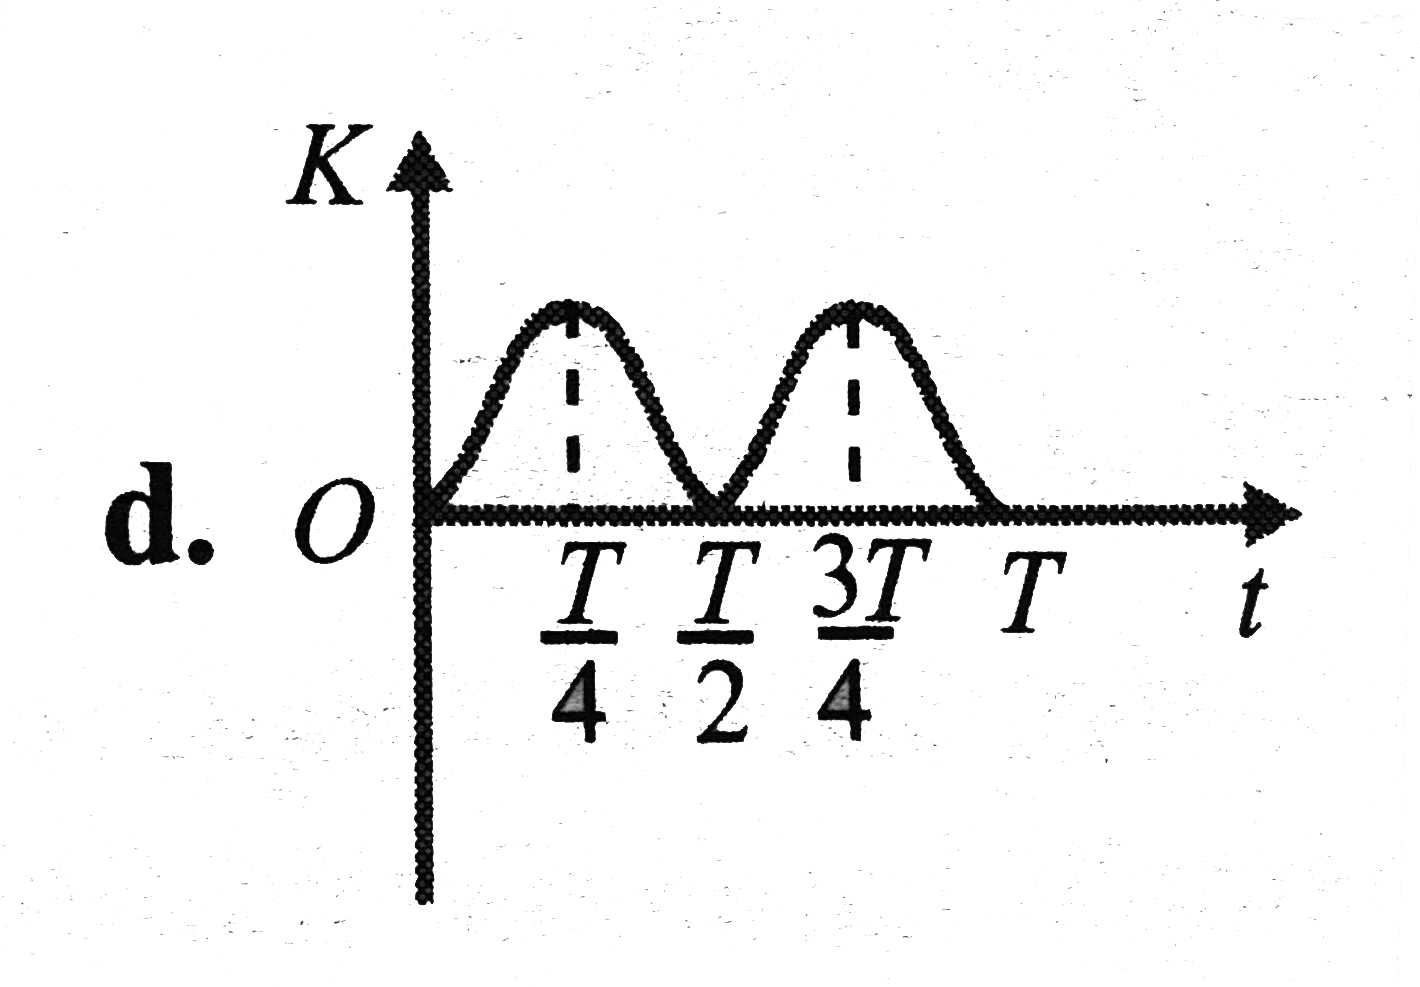
Since acceleration of the particle at initial moment is maximum possible and is negative, therefore, the particle is at right extreme position at this moment .
When the particle is released, it starts to move to the left. It means, velocity starts to increase from zero initial value to negative value and its magnitude becomes maximum possible at mean position (at t=T4). It means at t=T4, kinetic energy is equal to maximum possible.
At t=T2, the particle comes to instantaneous rest at left extreme position. It means at t=T2, v is equal to zero. Hence kinetic energy is equal to zero. At t=3T4, particle comes back to mean position and now moves to the right. Therefore, velocity is positive and has maximum possible magnitude. Therefore kinetic energy is maximum possible.
At t=T, particle comes back to initial position (extreme right position). Velocity and kinetic energy become equal to zero.
Topper's Solved these Questions
- LINEAR AND ANGULAR SIMPLE HARMONIC MOTIONBOOK - CENGAGE PHYSICS ENGLISHCHAPTER - LINEAR AND ANGULAR SIMPLE HARMONIC MOTIONEXERCISE - Multiple Correct
35 Videos
- LINEAR AND ANGULAR SIMPLE HARMONIC MOTIONBOOK - CENGAGE PHYSICS ENGLISHCHAPTER - LINEAR AND ANGULAR SIMPLE HARMONIC MOTIONEXERCISE - Assertion Reasoning
6 Videos
- LINEAR AND ANGULAR SIMPLE HARMONIC MOTIONBOOK - CENGAGE PHYSICS ENGLISHCHAPTER - LINEAR AND ANGULAR SIMPLE HARMONIC MOTIONEXERCISE - Subjective
21 Videos
- KINETIC THEORY OF GASES AND FIRST LAW OF THERMODYNAMICSBOOK - CENGAGE PHYSICS ENGLISHCHAPTER - KINETIC THEORY OF GASES AND FIRST LAW OF THERMODYNAMICSEXERCISE - Interger
11 Videos
- MISCELLANEOUS KINEMATICSBOOK - CENGAGE PHYSICS ENGLISHCHAPTER - MISCELLANEOUS KINEMATICSEXERCISE - Interger type
3 Videos
Similar Questions
A simple harmonic motino has amplitude A and time period T. The maxmum velocity will be
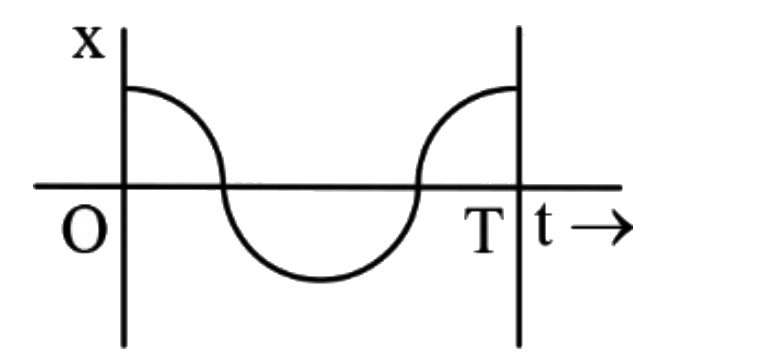
View SolutionA body is performing simple harmonic motion of amplitude A and time period T. The figure shown position-time graph of the body . At any time t, acceleration of the body is f, then which of the following graphs is/are appropriate?
View SolutionA particle performs simple harmonic motion about O with amolitude A and time period T. The magnitude of its acceleration at t=T8s after the particle reaches the extreme position would be
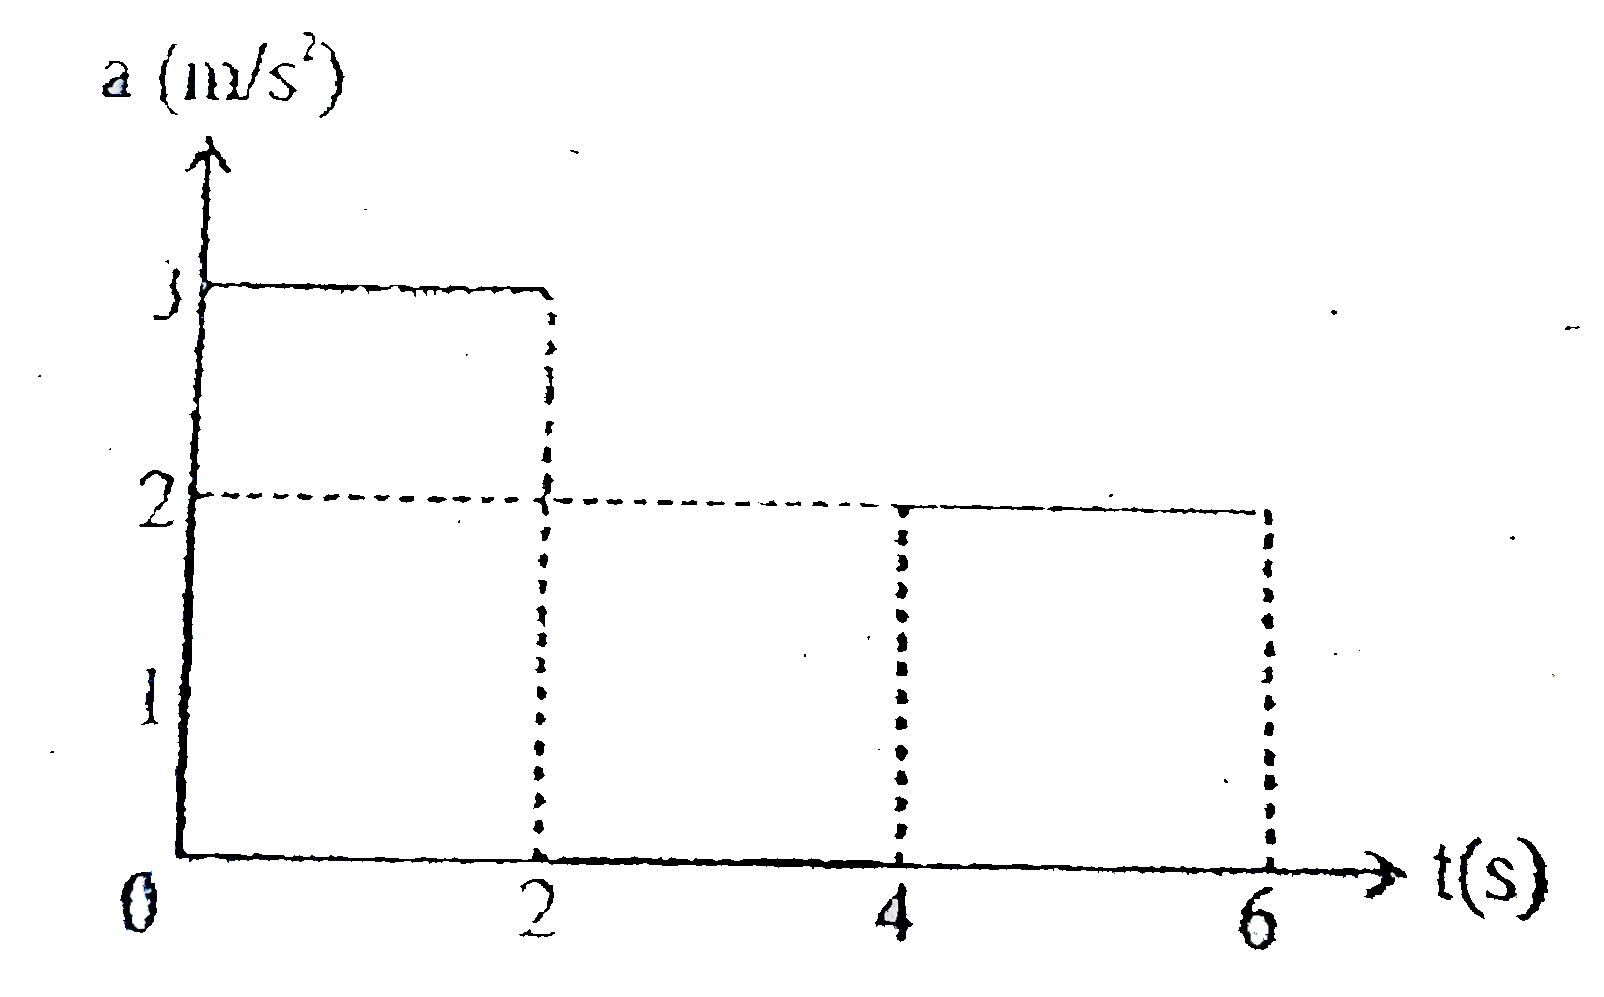
View SolutionThe dependence of the acceleration of a body with time is shown in Figure. At t=0, the velocity of the body is −3m/s and position is x=0m.
View SolutionA body is vibrating in simple harmonic motion with an amplitude of 0.06 m and frequency of 15 Hz . The velocity and acceleration of body is
View SolutionA particle is executing simple harmonic motion with an amplitude A and time period T. The displacement of the particles after 2T period from its initial position is
View SolutionA simple pendulum performs simple harmonic motion about x=0 with an amplitude a ans time period T. The speed of the pendulum at x=a2 will be
View SolutionIf particle is excuting simple harmonic motion with time period T, then the time period of its total mechanical energy is :-
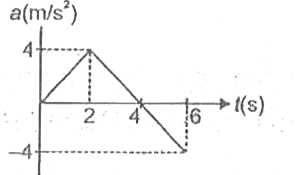
View SolutionFor the acceleration - time (a - t) graph shown in figure, the change in velocity of particle from t = 0 to t = 6 s is
View SolutionA simple harmonic oscillation has an amplitude A and time period T. The time required to travel from x=A to x=A2 is
View Solution
