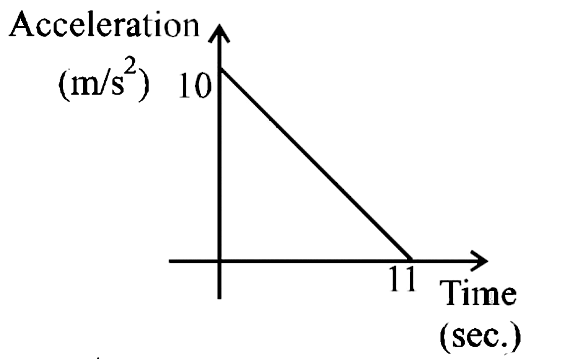
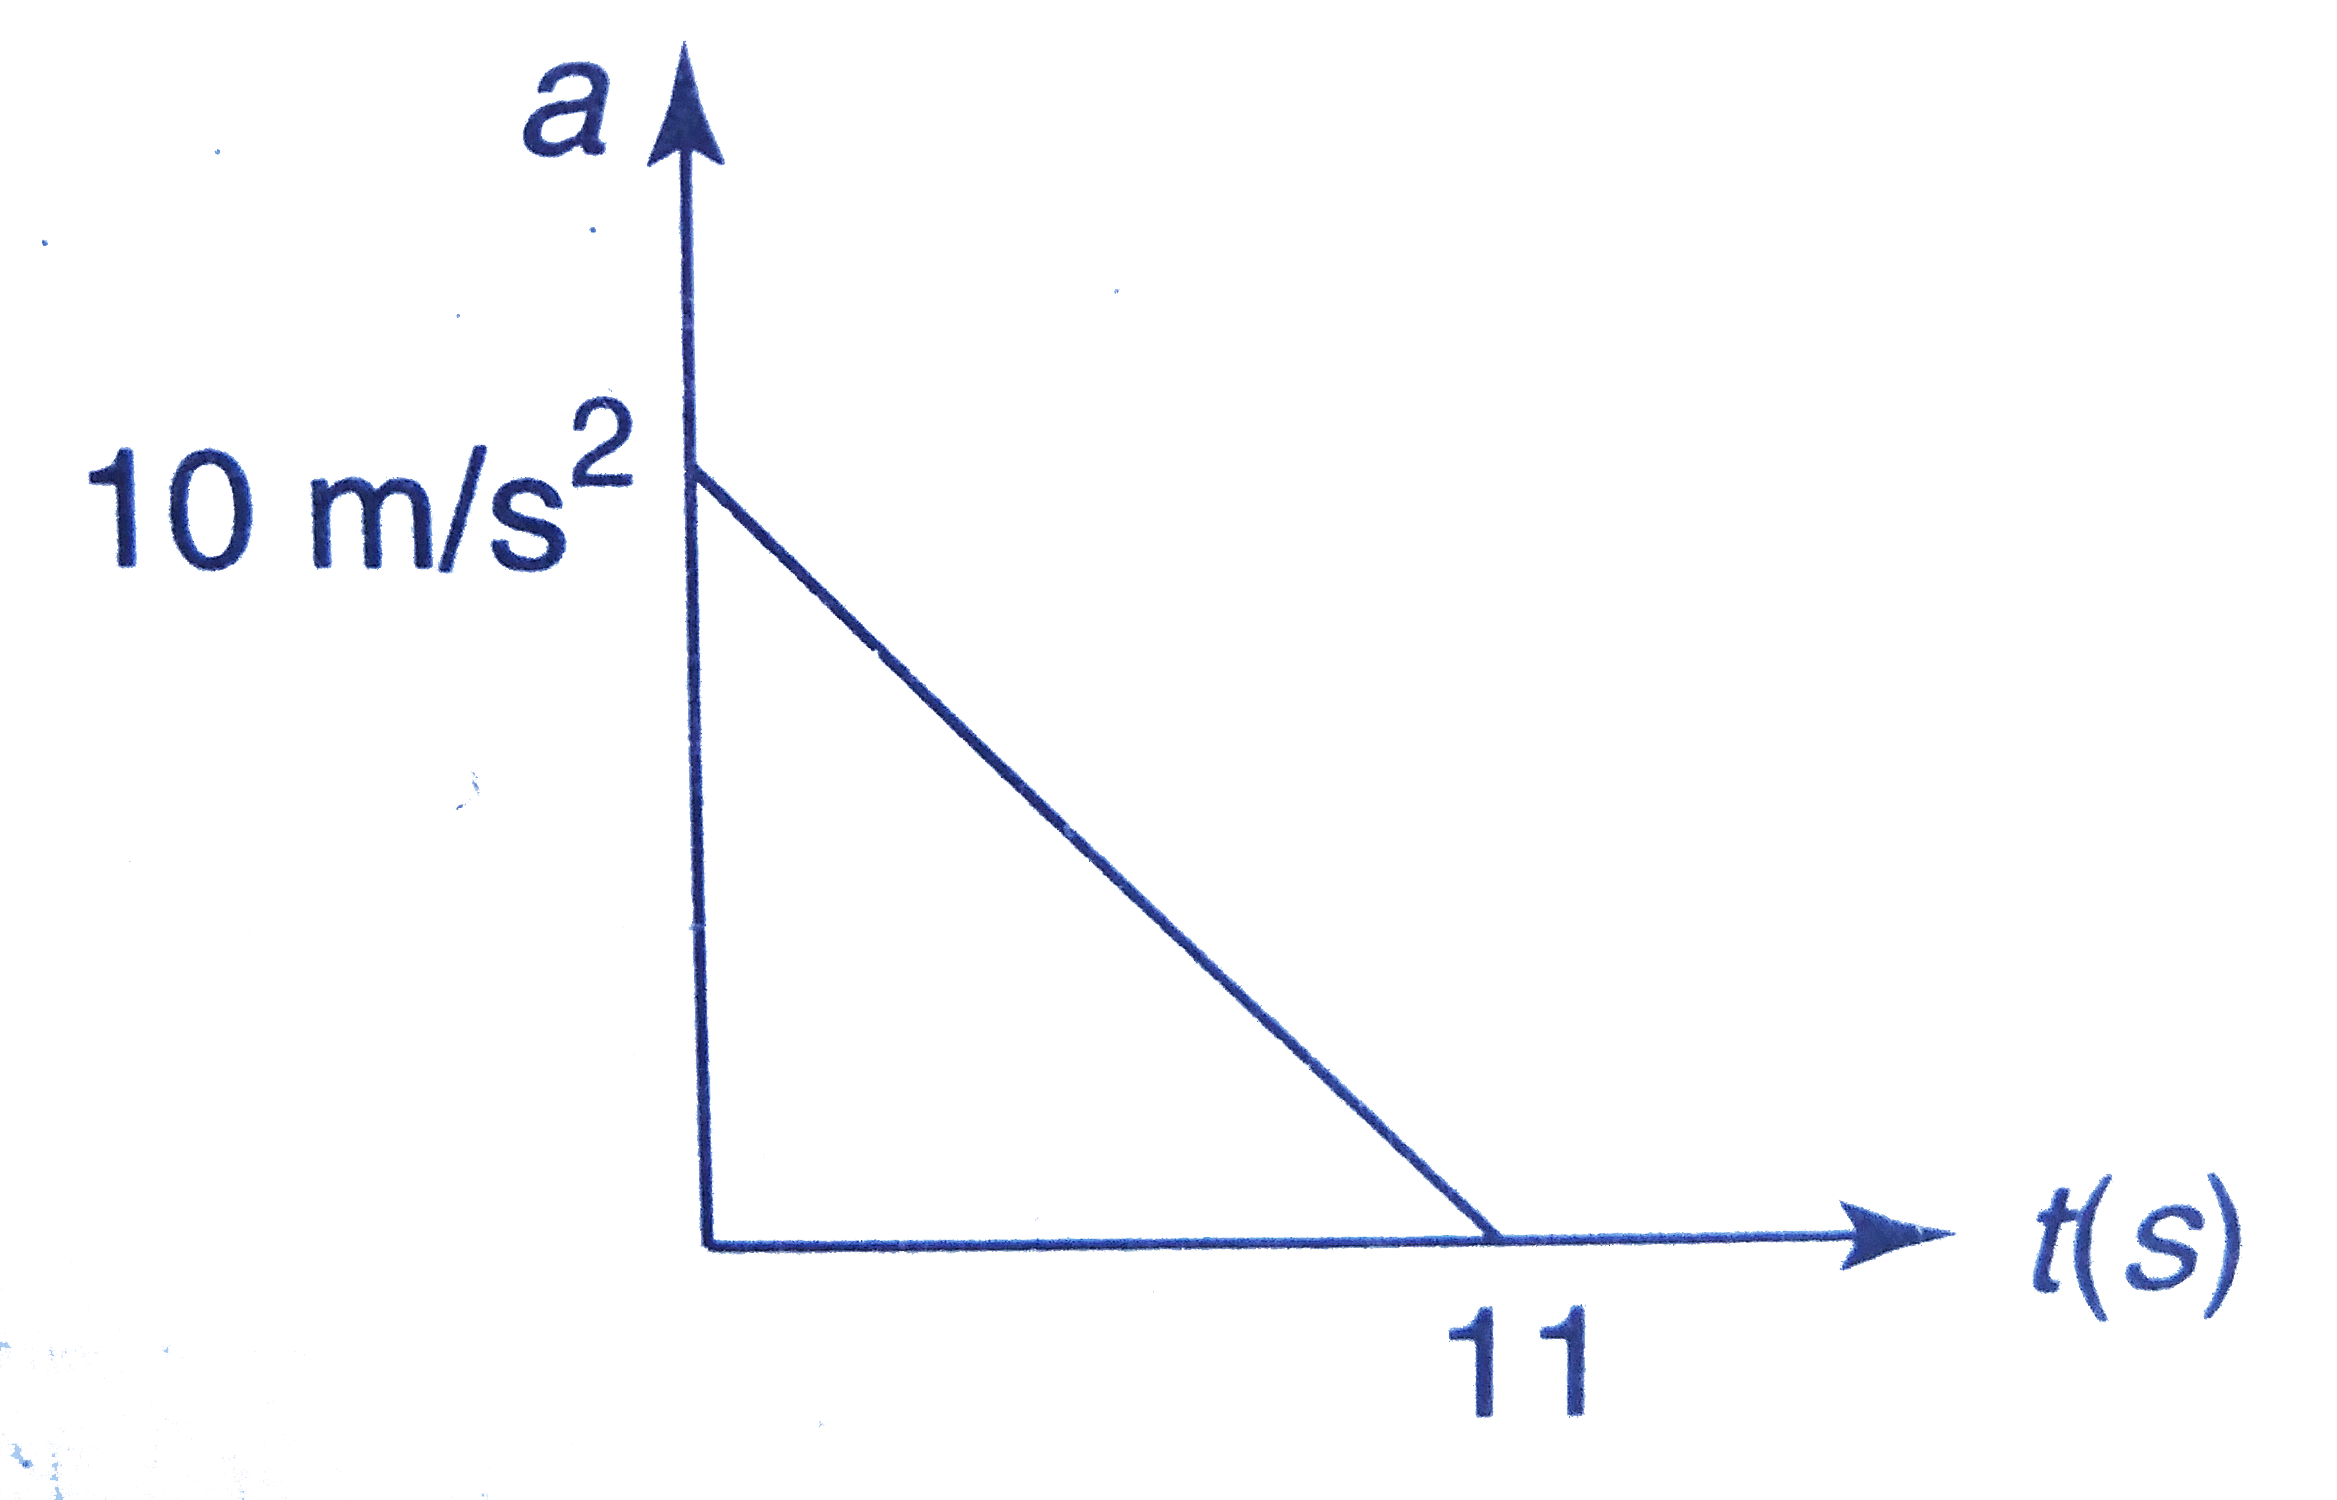
A body starts from rest at time t=0 , the acceleration time graph is shown in the figure . The maximum velocity attained by the body will be
110m/s
55m/s
650m/s(a)
550m/s
The correct Answer is:A
Change in velocity = area under the graph
12×10×11=55m/s
Since, initial velocity is zero , final velocity is 55m/s.
(##JMA_MOT_C02_012_S01.png" width="80%">
Topper's Solved these Questions
Similar Questions
A body starts from rest at time t=0 , the acceleration time graph is shown in the figure . The maximum velocity attained by the body will be

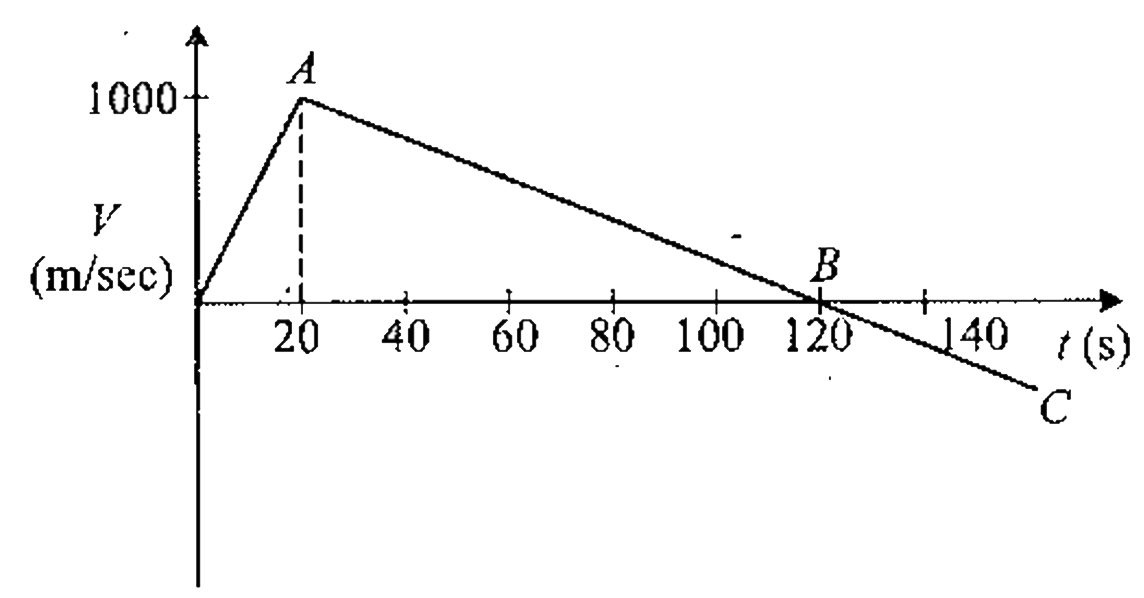
View SolutionA rocket is projected vertically upwards and its time velocity graph is shown in the figure-1.115. The maximum height attained by the rocket is :
View Solution
Knowledge Check
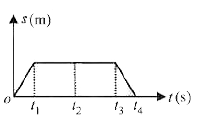
The displacement time graph of a body is shown in figure. The velocity-time graph of the motion of the body will be
 A
A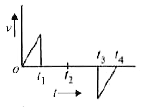 B
B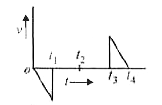 C
C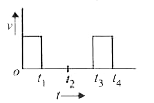 D
D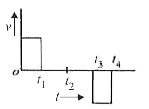

The acceleration time graph of a body is shown below the most probable velocity time graph of the body isA B
B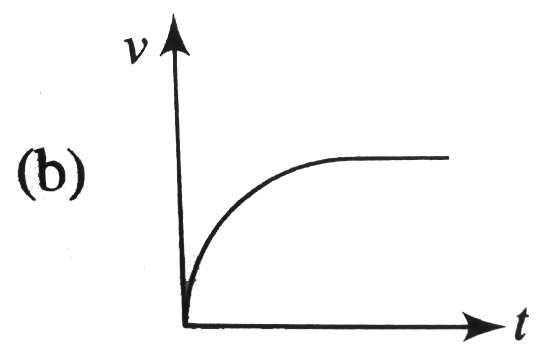 C
C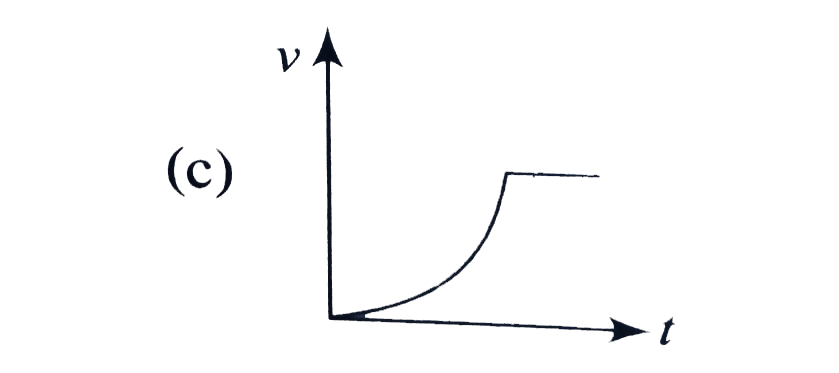 D
D
A particle starting from rest. Its acceleration (a) versus time (t) is as shown in the figure.
The maximum speed of the particle will be.
 A110m/sB55m/sC550m/sD660m/s
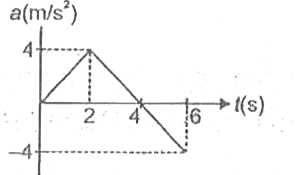
For the acceleration - time (a - t) graph shown in figure, the change in velocity of particle from t = 0 to t = 6 s is
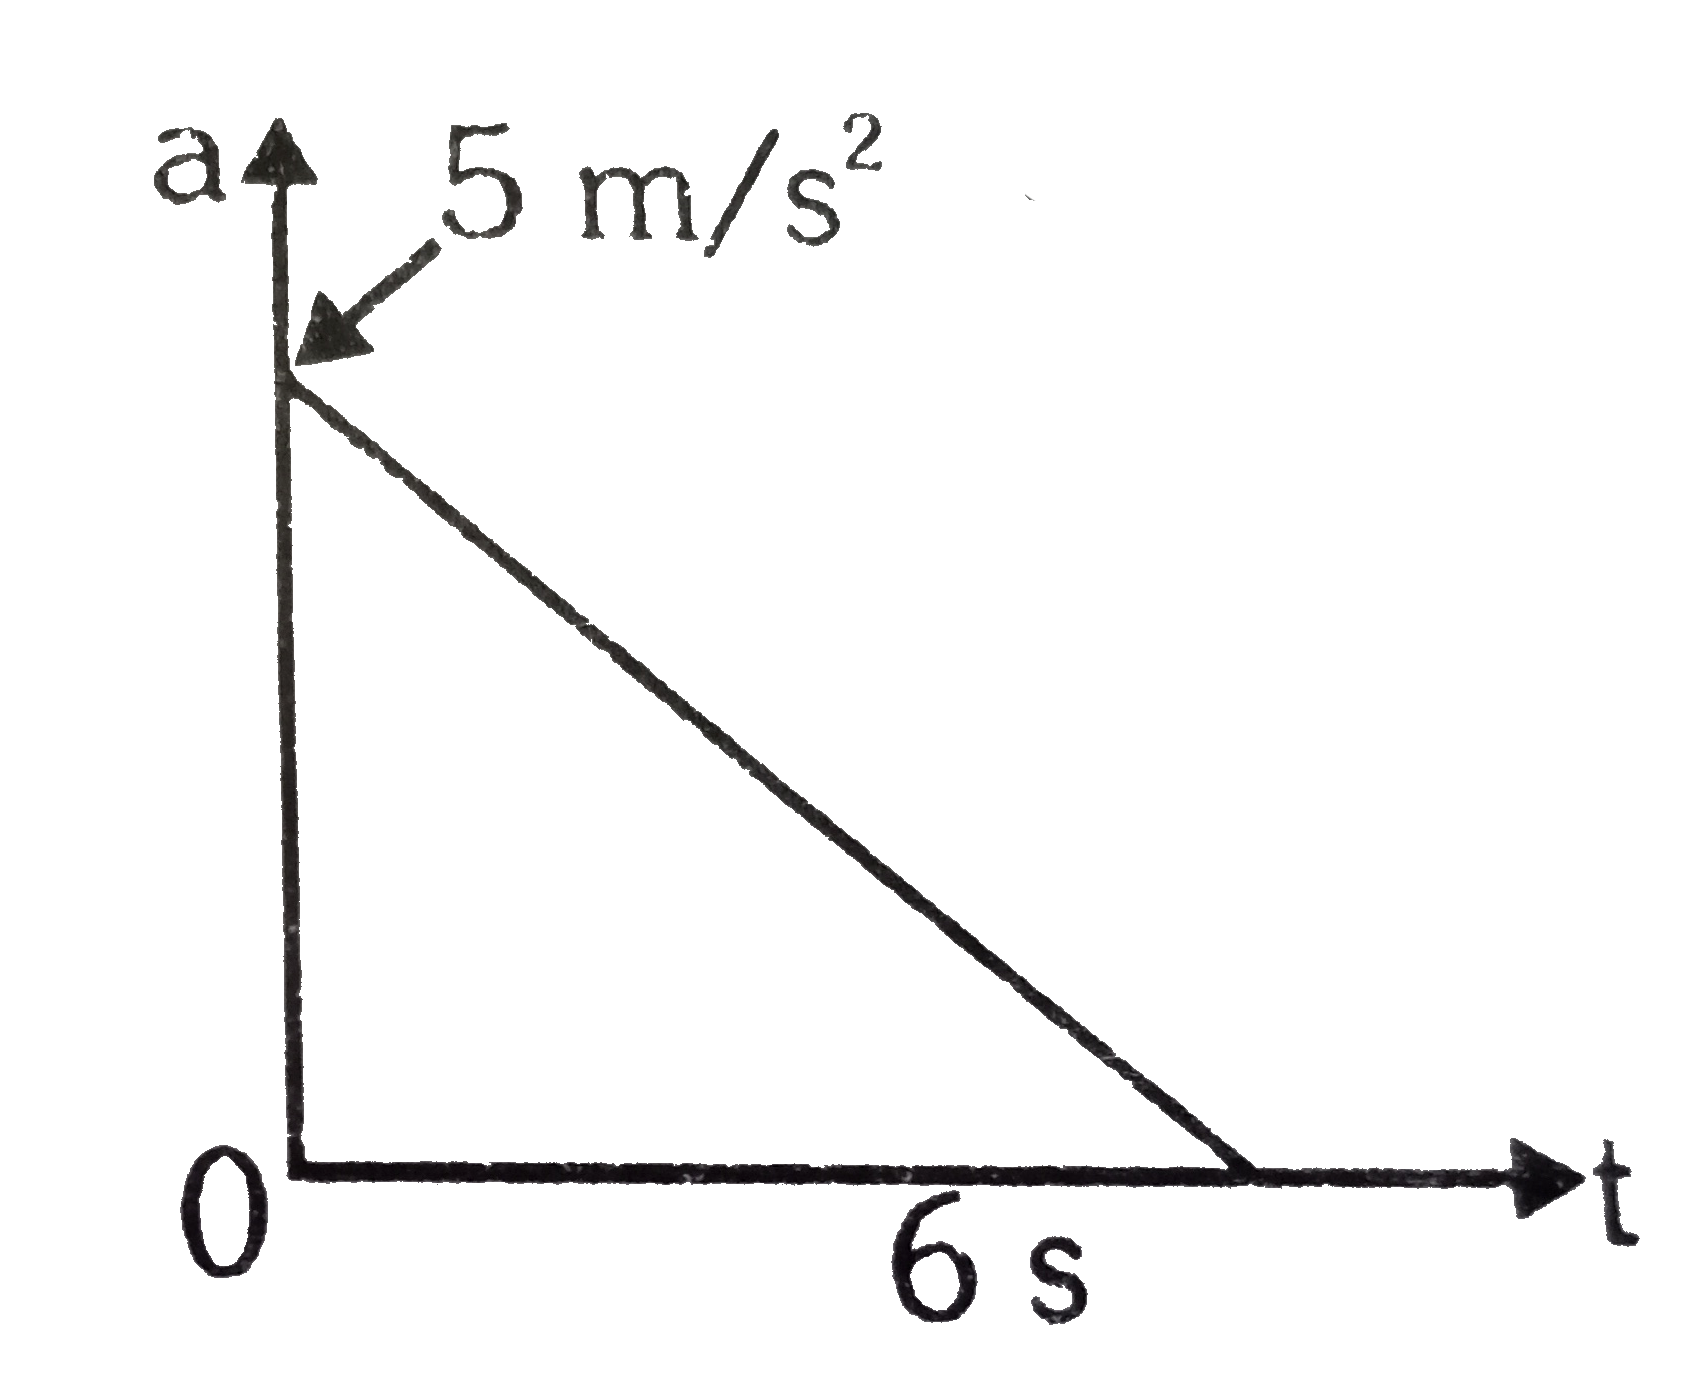
View SolutionA particle starts from rest. Its acceleration at time t=0 is 5m/s2 which varies with time as shown in the figure. The maximum speed of the particle will be
View SolutionA rocket is launched upward from the earth surface whose velocity time graph shown in figure. Then maximum height attained by the rocket is :-
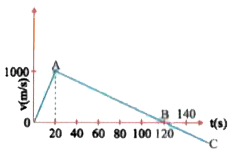
View SolutionA rocket is launched upward from the earth surface whose velocity time graph shown in figure. Then maximum height attained by the rocket is :-

View SolutionFor body of 50 kg. mass, the velocity time graph is shown in figure. Then force acting on the body is :-
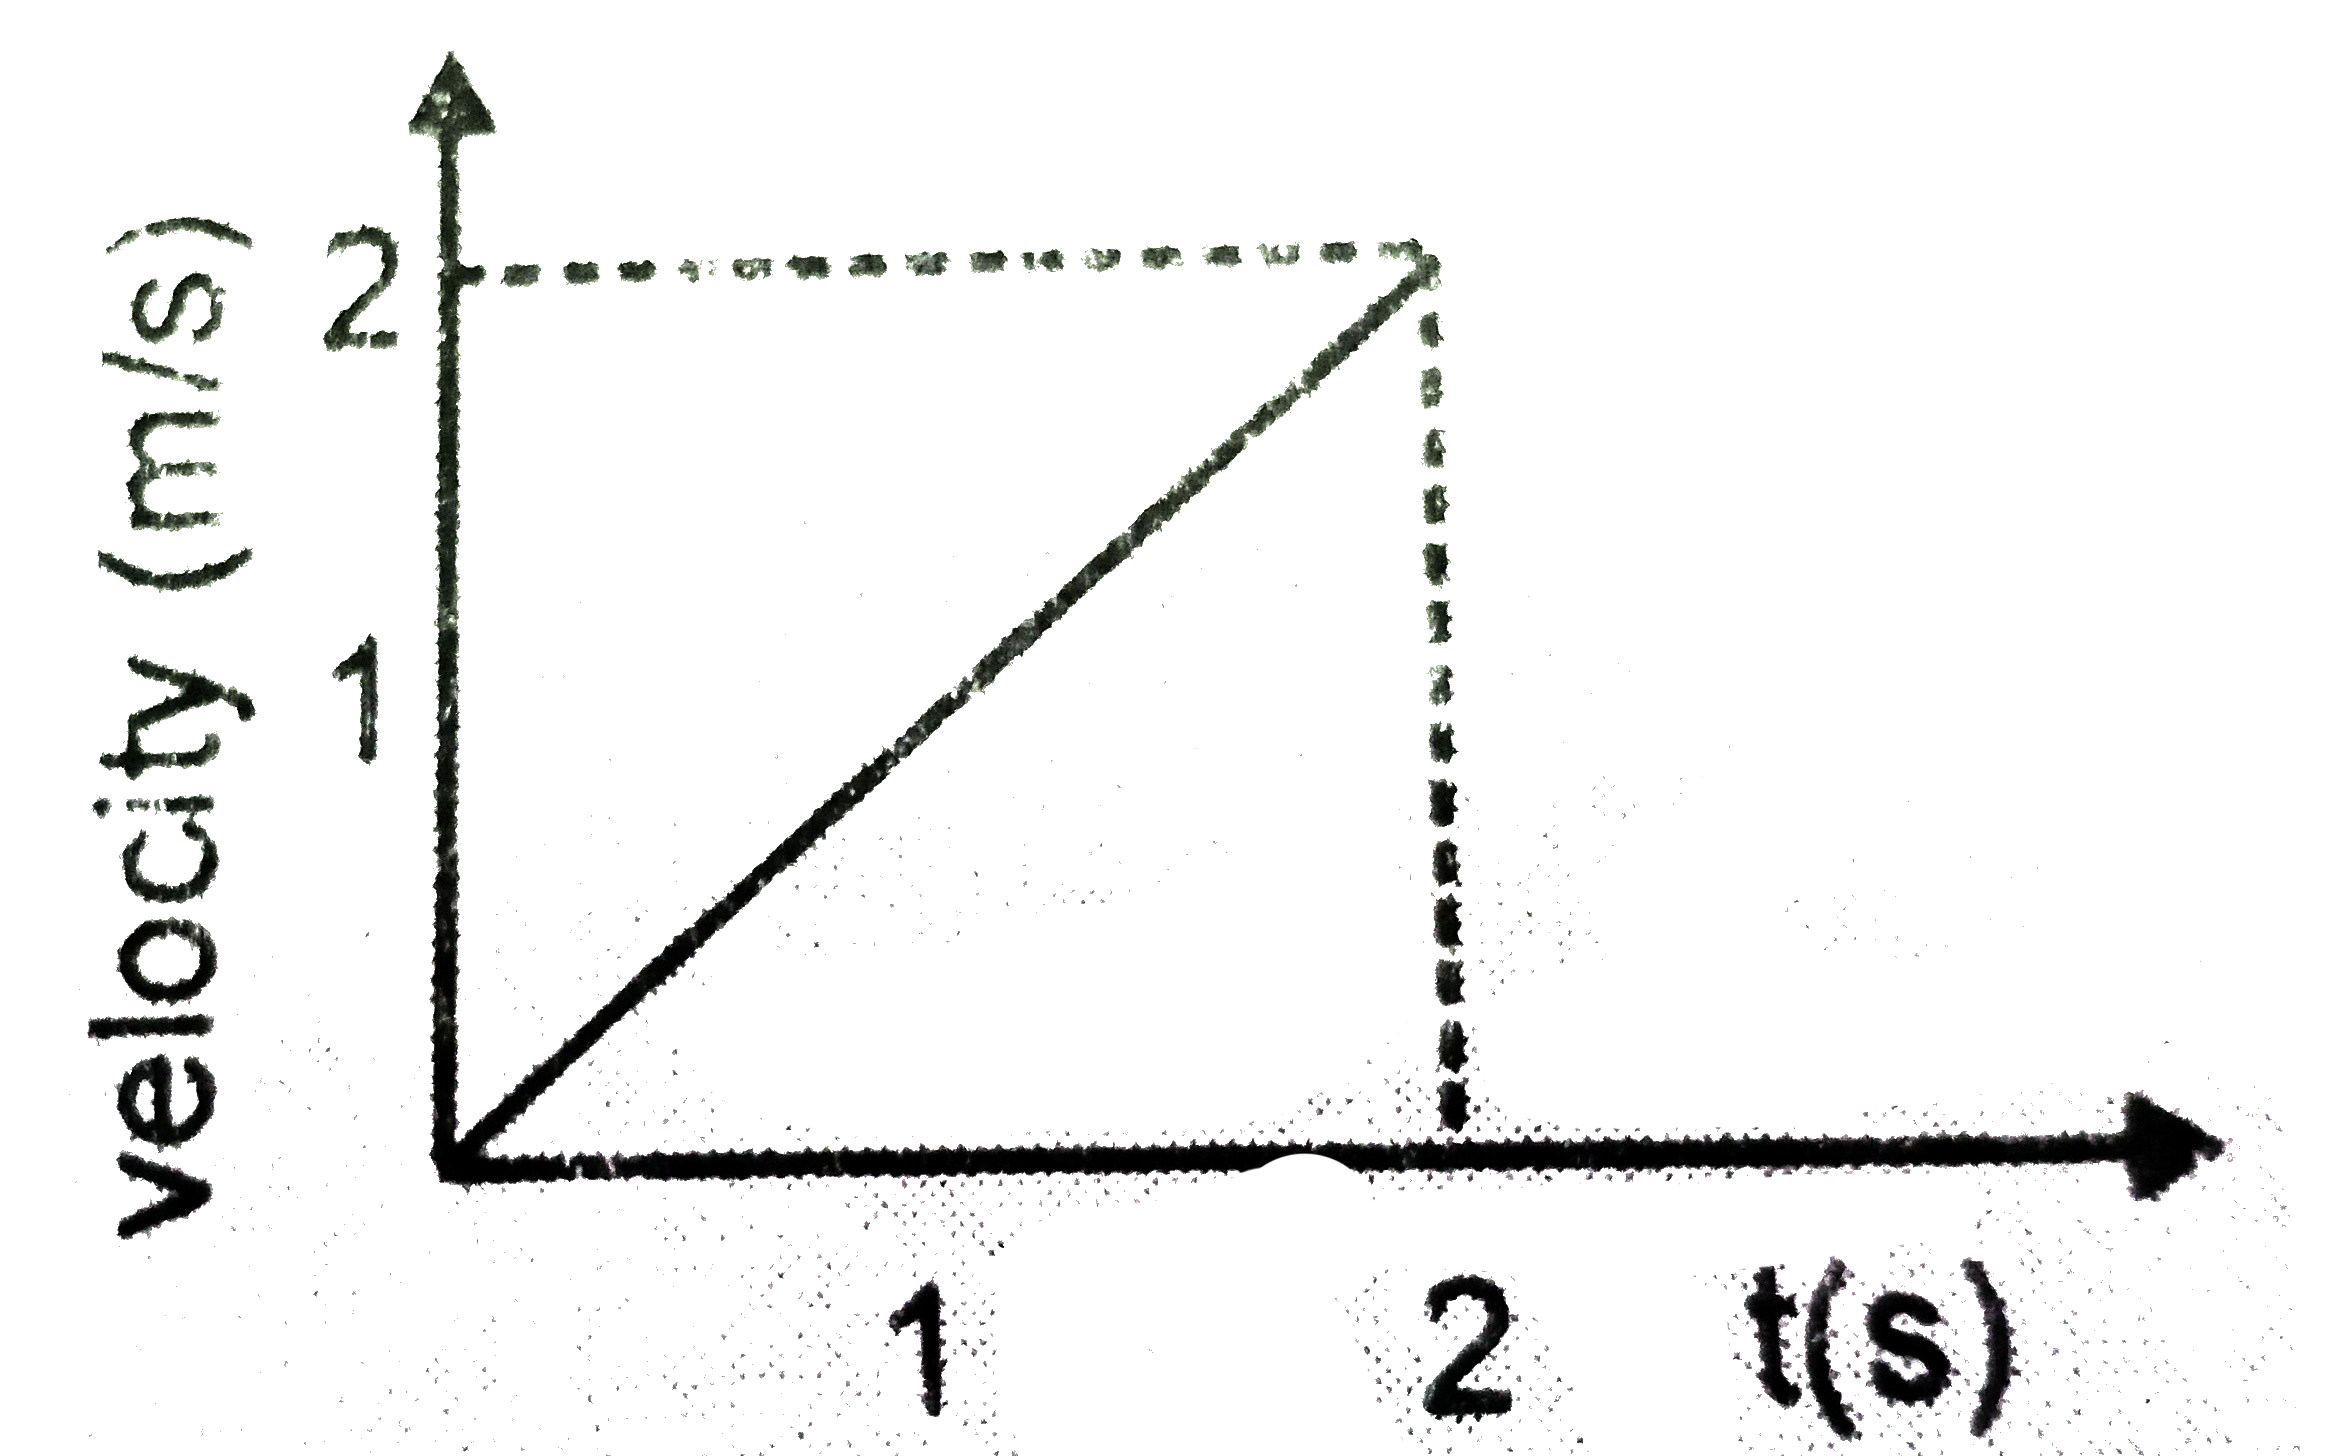
View Solution
