A force-time graph for a linear motion is shown in figure where the segments are circular. The linear momentum gained between zero and 8 second is

−2π newton × second
Zero newton × second
+4π newton × second
−6π newton × second
The correct Answer is:B
As the area above the time axis is numerically equal to area below the time axis therefore net momentum gained by body will be zero because momentum is a vector quantity.
Topper's Solved these Questions
- BOOK - ERRORLESS CHAPTER - WORK , ENERGY , POWER AND COLLISIONEXERCISE - Assertion & Reason For AIIMS Aspirants30videos
WORK , ENERGY , POWER AND COLLISION
- BOOK - ERRORLESS CHAPTER - WORK , ENERGY , POWER AND COLLISIONEXERCISE - Self Evaluation Test19videos
WORK , ENERGY , POWER AND COLLISION
- BOOK - ERRORLESS CHAPTER - WORK , ENERGY , POWER AND COLLISIONEXERCISE - Critical Thinking (Objective Questions)20videos
WORK , ENERGY , POWER AND COLLISION
- BOOK - ERRORLESS CHAPTER - WAVES AND SOUNDEXERCISE - SET25videos
WAVES AND SOUND
- BOOK - ERRORLESS CHAPTER - WORK, ENERGY, POWER & COLLISIONEXERCISE - Assertion30videos
WORK, ENERGY, POWER & COLLISION
Similar Questions
Knowledge Check
- Question 1 - Select One
A force - time graph for a linear motion is shown in the figure where the segments are circular. The linear momentum gained between zero and 8s is
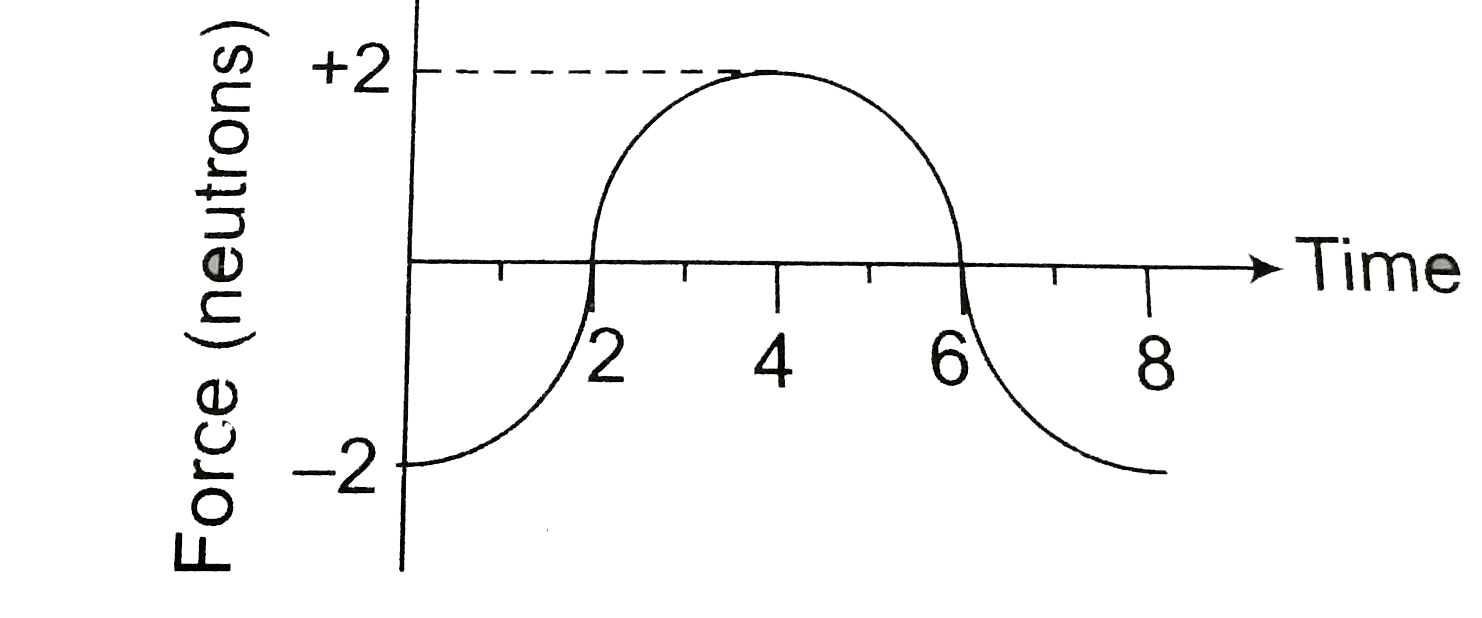 A−2πN−sBZeroC−4πN−sD−6πN−s
 - Question 2 - Select One
A force-time graph for a linear motion is shown in figure. The linear momentum gained between 0 and 6 second is
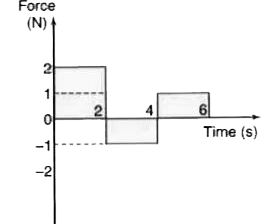 A2NsB4NsC6NsDZero
 - Question 3 - Select One
A force-time graph for the motion of a body is shown in the figure. The change in the momentum of the body between zero and 10sec is
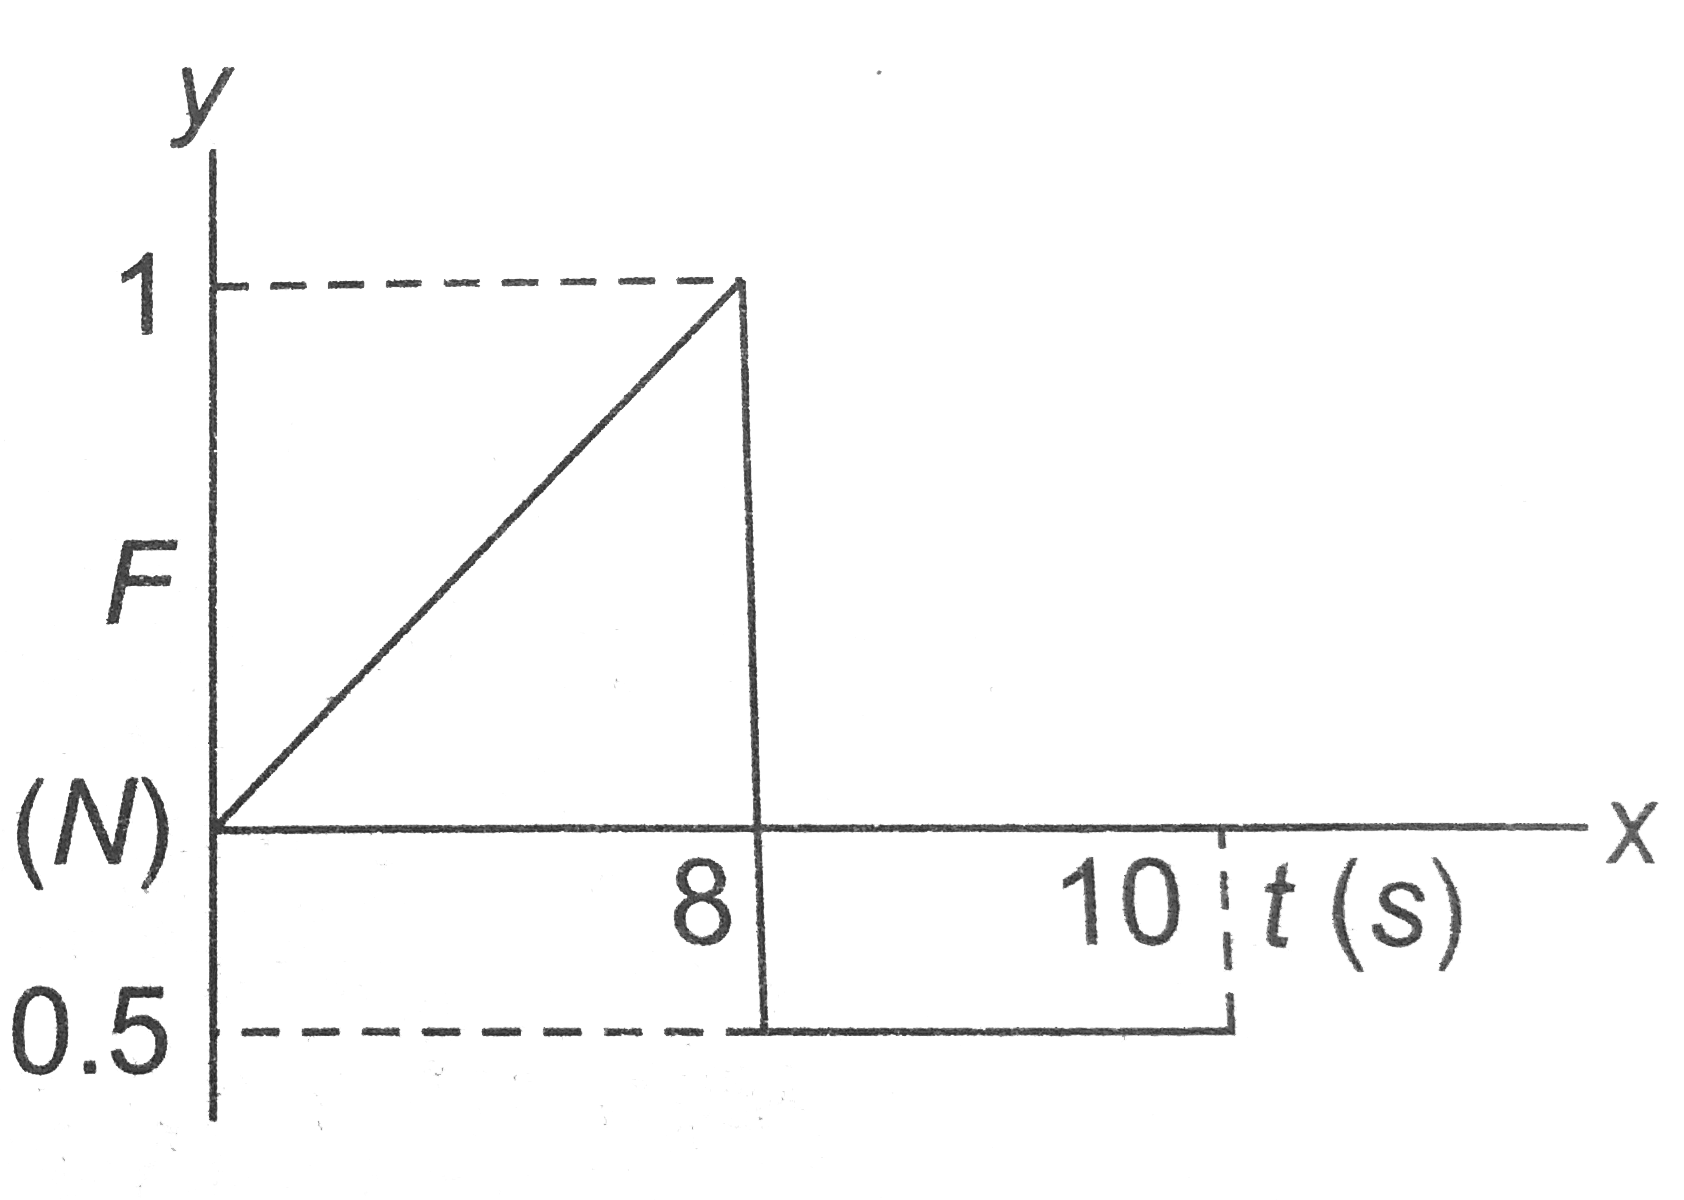 AzeroB4kgm/sC5kgm/sD3kgm/s
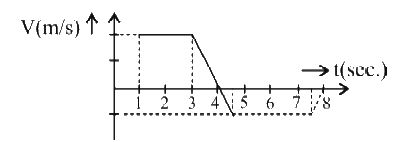
The velocity-time graph of a linear motion is shown in figure. The displacement from the origin after 8 sec is :
 View Solution
The velocity-time graph of a linear motion is shown in figure. The displacement from the origin after 8 sec is :
 View Solution
A force lime graph for the motion of a body is as shown in figure. Change in linear momentum between 0 and 6s is:
 View Solution
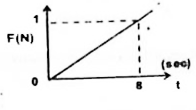
A force-time graph for the motion of a body is shown in figure. Change in linear momentum between 0 and 8 s is:
 View Solution
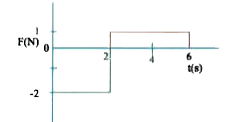
A force time graph for the motion of a body is as shown in figure. Change in linear momentum between 0 and 6s is
 View Solution

