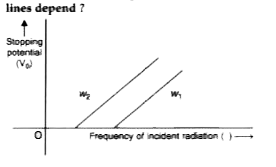
A graph of stopping potential of a photo sensitive metal with the frequency of incident radiation is plotted. What does the slope of this curve represent?Solution in Kannada

(i) Slope is determined by h and e. (or slope is independent of the metal used.)
(ii) Work function of the metal.
Topper's Solved these Questions
- DUAL NATURE OF RADIATION AND MATTERBOOK - OSWAAL PUBLICATIONCHAPTER - DUAL NATURE OF RADIATION AND MATTEREXERCISE - TOPIC-1 PHOTOELECTRIC EFFECT (SHORT ANSWER TYPE QUESTIONS-II)
6 Videos
- DUAL NATURE OF RADIATION AND MATTERBOOK - OSWAAL PUBLICATIONCHAPTER - DUAL NATURE OF RADIATION AND MATTEREXERCISE - TOPIC-1 PHOTOELECTRIC EFFECT (LONG ANSWER TYPE QUESTIONS)
4 Videos
- DUAL NATURE OF RADIATION AND MATTERBOOK - OSWAAL PUBLICATIONCHAPTER - DUAL NATURE OF RADIATION AND MATTEREXERCISE - TOPIC-2 DE-BROGLIE RELATION (NUMERICAL PROBLEMS)
7 Videos
- CURRENT ELECTRICITY BOOK - OSWAAL PUBLICATIONCHAPTER - CURRENT ELECTRICITY EXERCISE - TOPIC-3 (POTENTIOMETER & APPLICATIONS) (NUMERICAL PROBLEMS)
2 Videos
- ELECTRIC CHARGES & FIELDSBOOK - OSWAAL PUBLICATIONCHAPTER - ELECTRIC CHARGES & FIELDSEXERCISE - (TOPIC -2)Numerical Problems
5 Videos
Similar Questions
Mention any three properties of a photon.
View SolutionWrite any three experimental observations of photoelectric effect
View SolutionCalculate de-Broglie wavelength associated with a rifle bullet of mass 2 gram moving with a speed of 400ms−1.
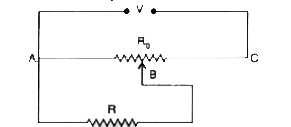
View SolutionA resistance of RΩ draws current from a potentiometer. The potentiometer has a total resistance R0Ω.A voltage V is supplied to the potentiometer. Derive an expression for the voltage across R when the sliding contact is in the middle of the potentiometer.

View SolutionAn atom was earlier assumed to be sphere of radius a having a positively charged point nucleus of charge +Ze at its centre . This nucleus was believed to be surrounded by a uniform desity of negative charge that made the atom neutral as a whole.
Use this theorem to find the electric field of this atom at a distance r(r>a) from the centre of the atom.
View SolutionThe stopping potential as a function of the frequency of the incident radiation is plotted for two different photoelectric surfaces A and B . The graphs show that work function of A is

View SolutionDraw a graph showing the variation of stopping potential with frequency of the incident radiation. What does the slope of the line with frequency axis indicate? What information can be obtained from the values of intercept on the potential axis?
View SolutionThe stopping potential for acertain photosensitive metal is Vq when the frequency of incident radiation is V_(0) When the frequency of the incident radiations is doubled, what will be the stopping potential ?
View SolutionWhich of the following is the graph between the frequency (v) of the incident radiations and the stopping potential ?
View SolutionIn a photoelectric experiment, a student plotted the graph of stopping potential (Vs) against the frequency of incident radiation (v). But he could not write the unit of the slope of the graph. What is the corrent unit ?
View SolutionIn a photoelectric experiment, the reciprocal of the slope of the straight line graph giving the relation between the stopping potential and the frequency of incident radiation gives
View SolutionIn photoelectric the slope of the straight line graph between stopping potential and frequency of incident radiation gives the ratio of Plancks constant to
View SolutionIn photoelectric effect the slope of stop of stopping potential versus frequency of incident light for a given surface will be
View Solutiona. Draw the graph showing the variation of potential with frequency of incident radiation.
b. What does the slope of the graph represent?
c. From the slope how will you find the value of 'h' ?
View SolutionThe slope of the graph drawn between stopping potential and frequency of incident radiation will be
View SolutionThe stopping potential as a function of the frequency of the incident radiation is plotted for two different photoelectric surfaces A and B . The graphs show that work function of A is

View Solution
