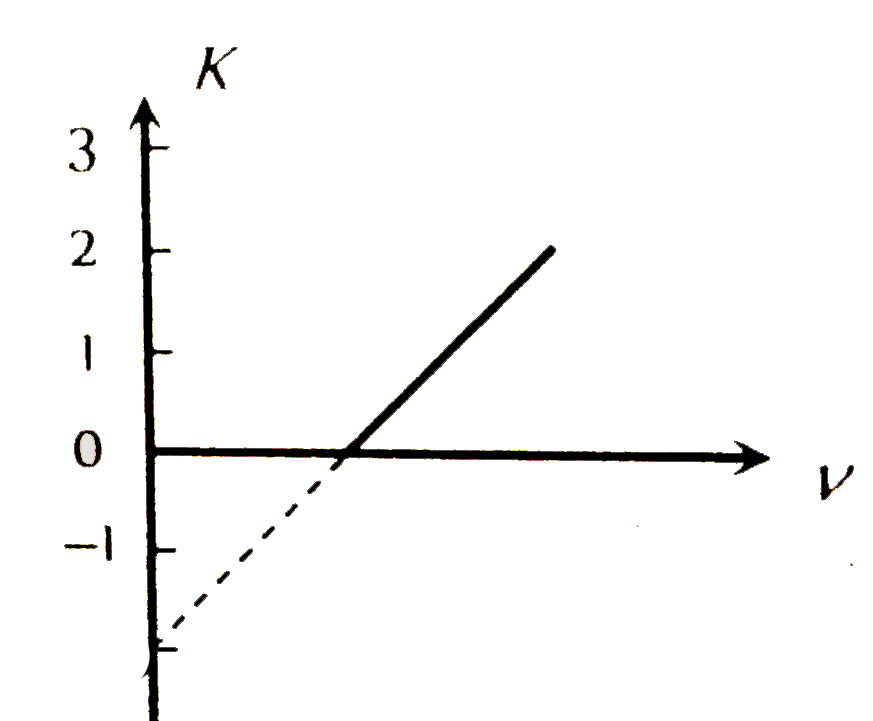
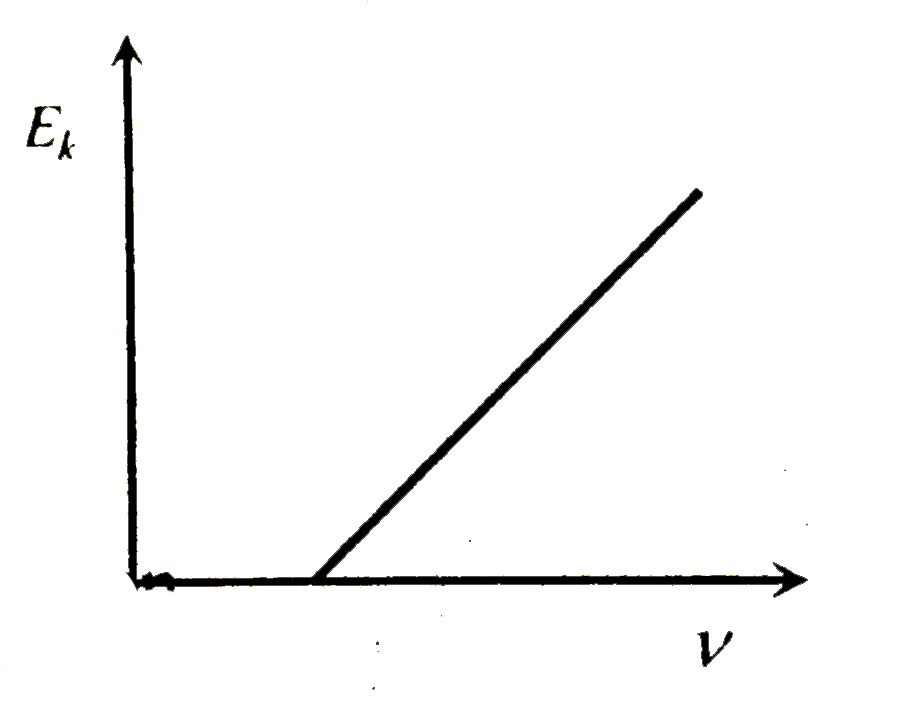
A graph of the kinetic energy (K) of the photoelectrons (in eV) against the frequency (v) for a metal used as a cathode in a photoelectric experiment is as shown in the figure .
What is the work function of the metal ?

2 eV
2.5 eV
3 eV
4 eV
The correct Answer is:C
The intercept on the-K axis gives the work function.
∴W=3eV
Topper's Solved these Questions
- ELECTRONS AND PHOTONS BOOK - MARVEL PUBLICATIONCHAPTER - ELECTRONS AND PHOTONS EXERCISE - TEST YOUR GRASP - 17
15 Videos
- ELECTROMAGNETIC INDUCTION AND ALTERNATING CURRENTS BOOK - MARVEL PUBLICATIONCHAPTER - ELECTROMAGNETIC INDUCTION AND ALTERNATING CURRENTS EXERCISE - TEST YOUR GRASP - 16
30 Videos
- ELECTROSTATICSBOOK - MARVEL PUBLICATIONCHAPTER - ELECTROSTATICSEXERCISE - TEST YOUR GRASP
20 Videos
Similar Questions
In an experiment of photo-electric effect, the graph of maximum kinetic energy Ek of the emitted photoelectrons versus the frequency v of the incident light is a straight line AB as shown in figure below :
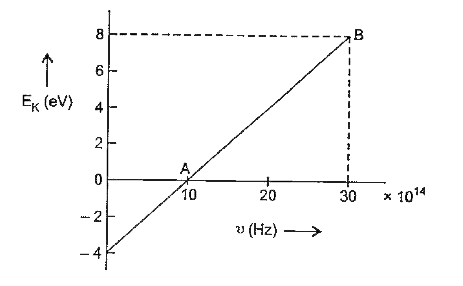
Work function of the metal.
View SolutionIn an experiment of photo-electric effect, the graph of maximum kinetic energy Ek of the emitted photoelectrons versus the frequency v of the incident light is a straight line AB as shown in figure below :
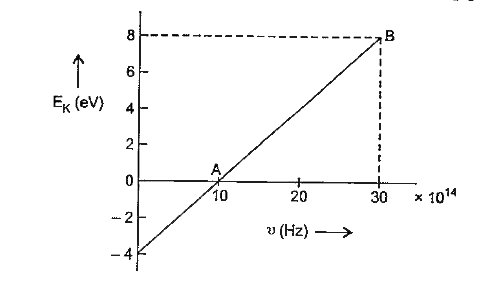
Threshold frequency of the metal.
View Solution
Knowledge Check
Figure represents a graph of kinetic energy (K) of photoelectrons (in eV ) and frequency (v) for a metal used as cathode in photoelectric experiment. The work function of metal is
 A1 eVB1.5 eVC2 eVD3 eV
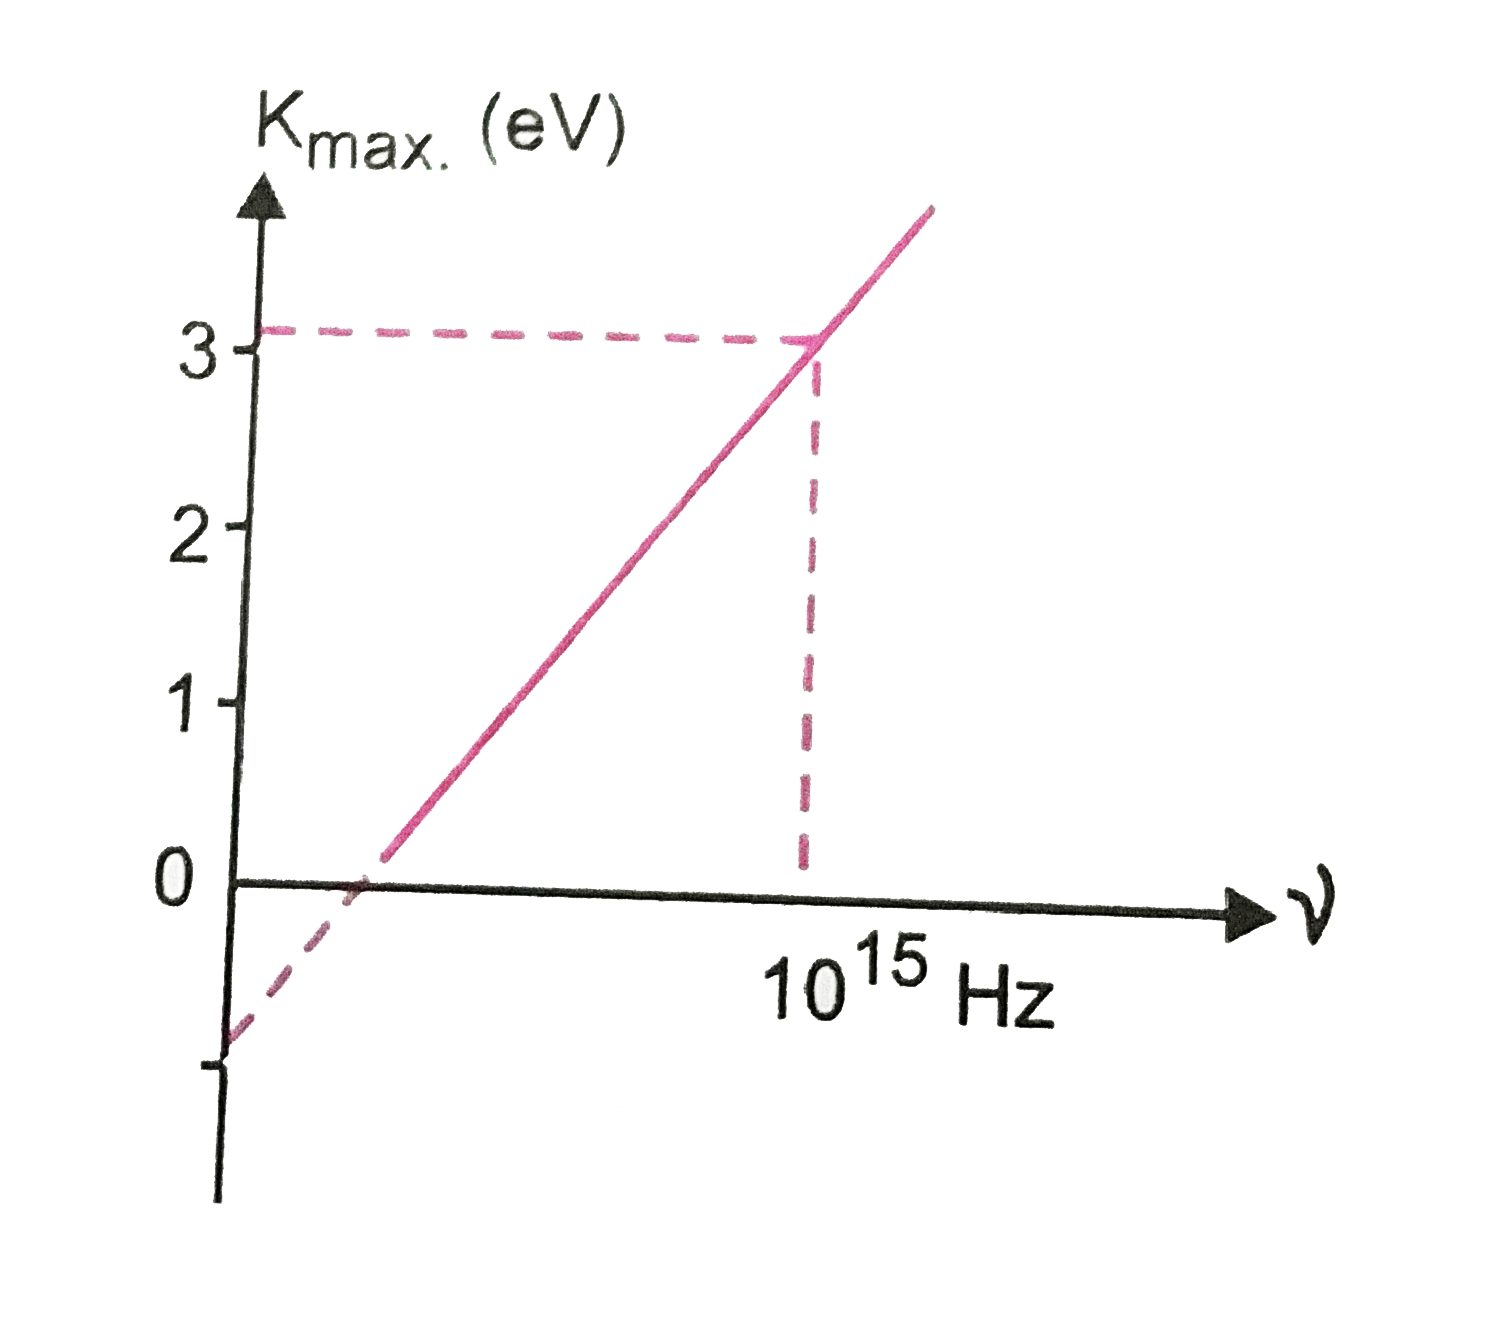
represents a graph of most energetic photoelectrons Kmax(in eV) and frequency v for a metal used as cathode in photoelectrons experiment. The threshold frequency of light for the photoelectric emission from the metal is
 A1×1014HzB1.5×1014HzC2×1014HzD2.7×1014Hz
represents a graph of most energetic photoelectrons Kmax(in eV) and frequency v for a metal used as cathod in photoelectrons experiment. The threshold frequency of light for the photoelectric emission from the metal is
 A1×1014HzB1.5×1014HzC2.1×1014HzD2.7×1014Hz
For the photoelectric effect, the maximum kinetic energy Ek of the emitted photoelectrons is plotted against the frequency of the incident photons as shown in the figure. The slope of the curve gives
View SolutionIn an experiment of photoelectric effect, the graph of maximum kinetic energy EK of the emitted photoelectrons versus the frequency v of the incident light is a straight line AB as shown in Figure below:
Find : (i) Threshold frequency of the metal.
(ii) work function of the metal
(iii) Stopping potential for the photoelectrons emitted by the light of frequency v=30×1014 Hz.
View SolutionKmax (in eV) = 3, and frequency of light (in Hz) =1×10¹⁵ for a metal used as a cathode in a photoelectric experiment. The threshold frequency of light for the photoelectric emission from the metal is -
View SolutionFor the photoelectric effect, the maximum kinetic energy Ek of the emitted photoelectrons is plotted against the frequency ν of the incident photons as shown in the figure. The slope of the curve gives

View SolutionKmax (in eV) = 3, and frequency of light (in Hz) =1×10¹⁵ for a metal used as a cathode in a photoelectric experiment. The threshold frequency of light for the photoelectric emission from the metal is -
View Solution
