A longitudinal standing wave y=acoskxcosωt is maintained in a homogeneious medium of density ρ. Here ω is the angular speed and k , the wave number and a is the amplitude of the standing wave . This standing wave exists all over a given region of space.
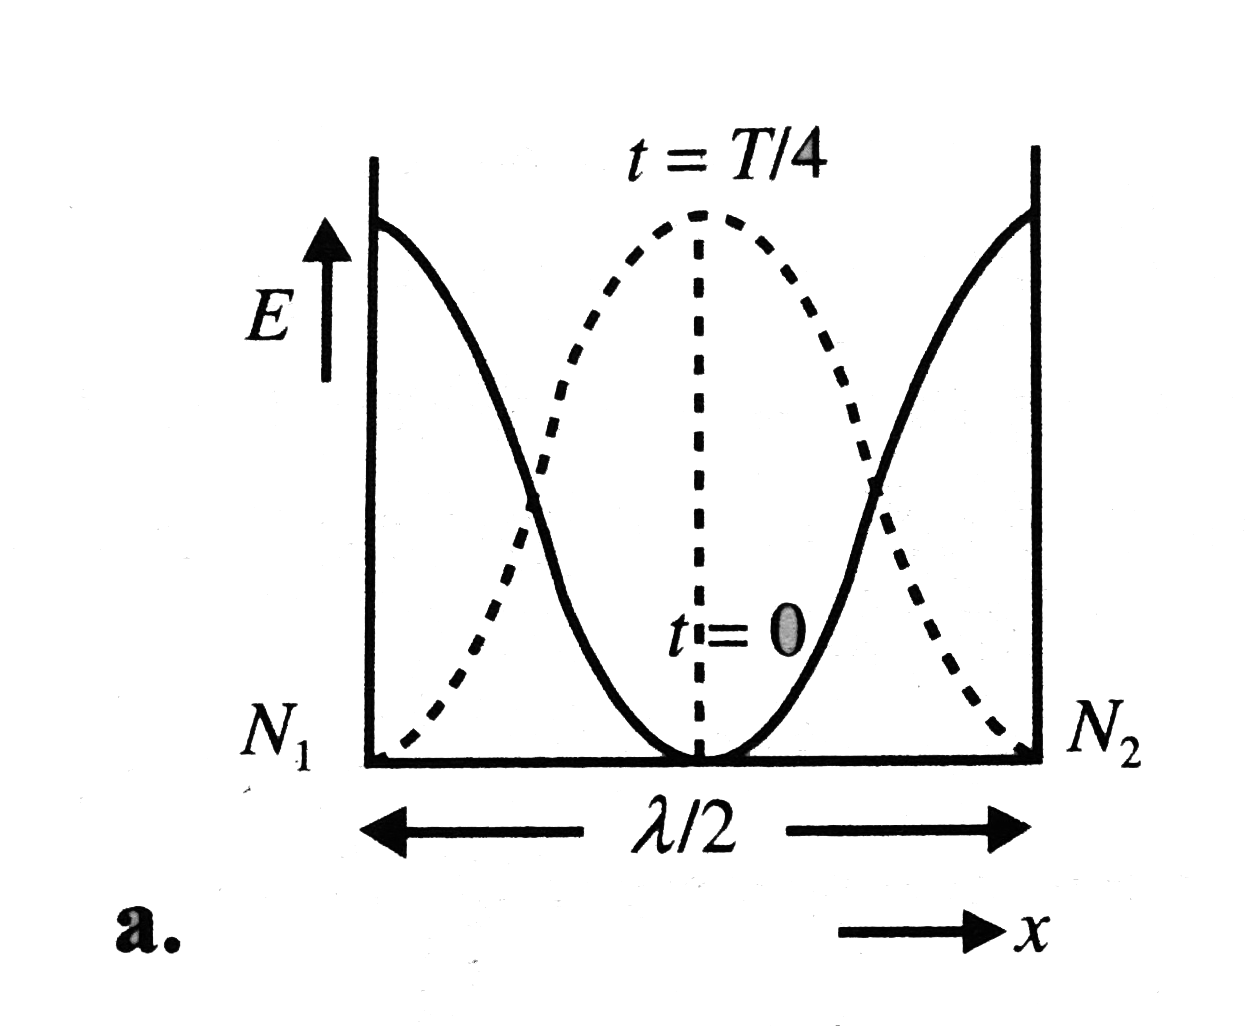
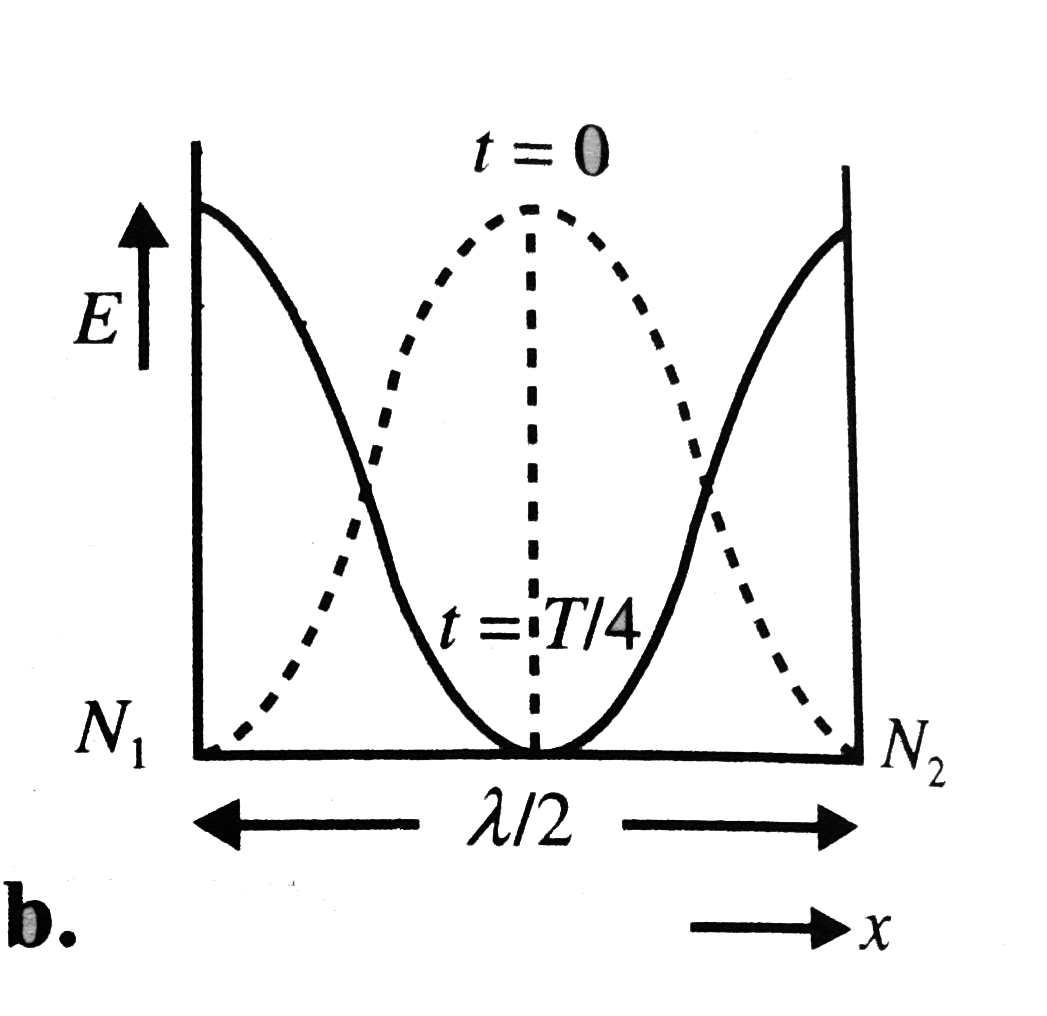
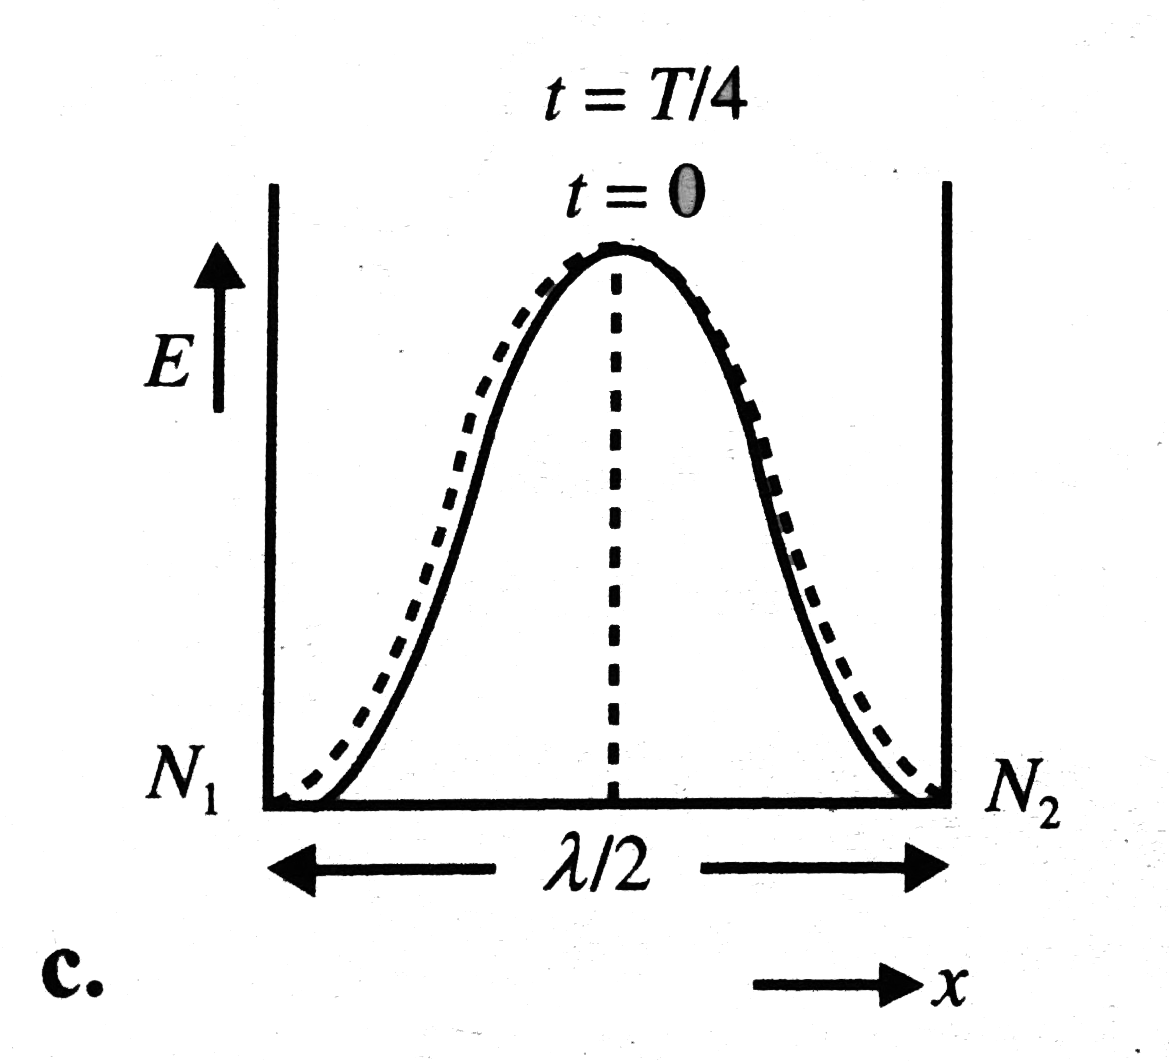
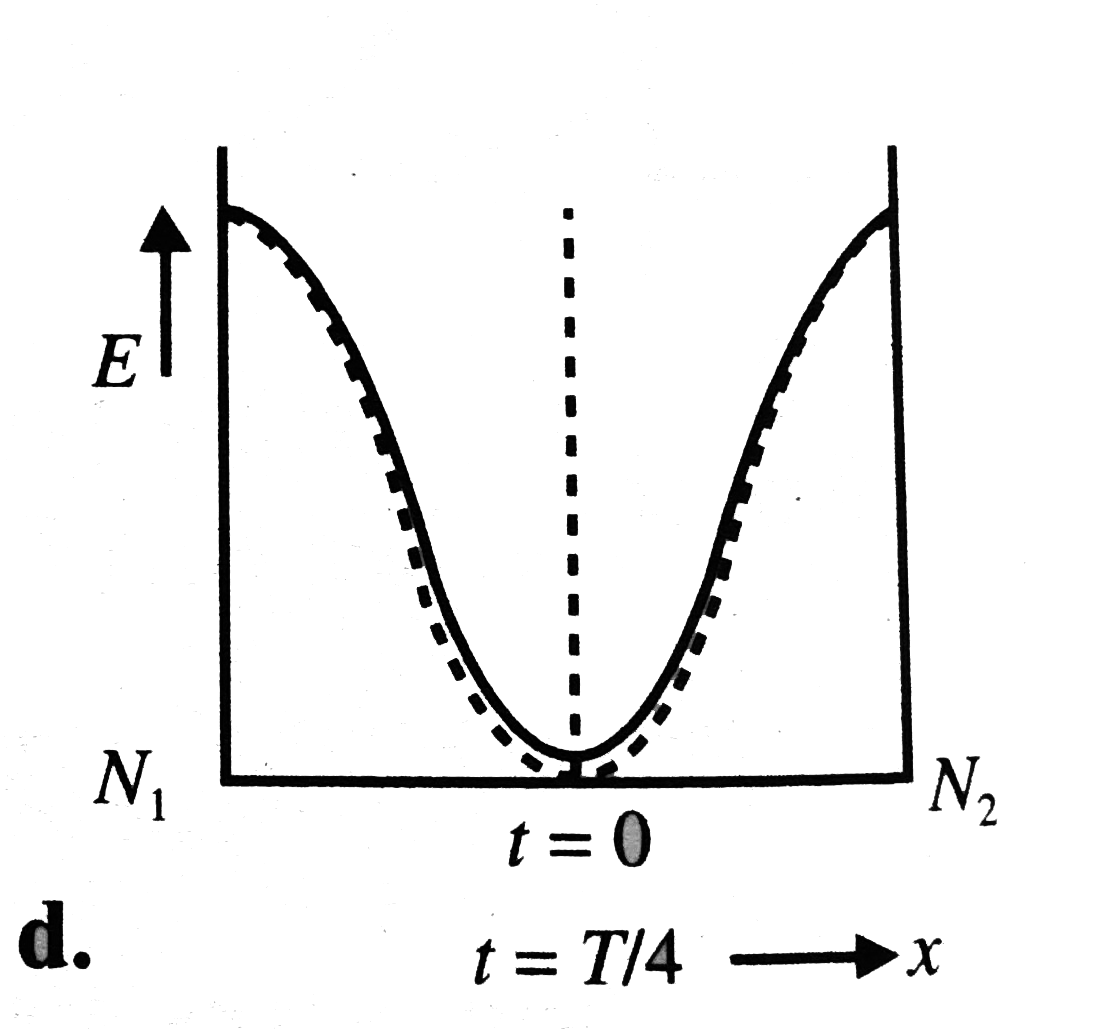
If a graph E(=Ep+Ek) versus t , i.e., total space energy density verus time were drawn at the instants of time t=0 and t=T/4, between two successive nodes separated by distance λ/2 which of the following graphs correctly shows the total energy (E) distribution at the two instants.


The correct Answer is:A
To solve the problem of finding the correct graph for the total energy distribution of a longitudinal standing wave at two different time instances, we will follow these steps:
Step 1: Understand the standing wave equation
The given standing wave is represented by the equation:
y=acos(kx)cos(ωt)
where:
- a is the amplitude,
- k is the wave number,
- ω is the angular frequency.
Step 2: Write the expression for total energy density
The total energy density E is the sum of potential energy density Ep and kinetic energy density Ek:
E=Ep+Ek
The expressions for potential and kinetic energy densities are:
Ep=12Y(dydx)2
Ek=12ρ(dydt)2
where Y is Young's modulus and ρ is the density of the medium.
Step 3: Calculate E at t=0
At t=0:
y=acos(kx)cos(0)=acos(kx)
Now, we differentiate y with respect to x and t:
1. dydx=−aksin(kx)
2. dydt=−aωsin(ωt)
Substituting these into the energy density equations:
Ep=12Y(−aksin(kx))2=12Ya2k2sin2(kx)
Ek=12ρ(−aωsin(0))2=0
Thus, at t=0:
E=Ep=12Ya2k2sin2(kx)
Step 4: Calculate E at t=T4
At t=T4:
y=acos(kx)cos(π2)=0
Now, substituting t=T4 into the derivatives:
1. dydx=−aksin(kx)
2. dydt=−aωsin(π2)=−aω
Now substituting into the energy density equations:
Ep=0
Ek=12ρ(−aω)2=12ρa2ω2
Thus, at t=T4:
E=Ek=12ρa2ω2
Step 5: Analyze the graphs
1. At t=0, the energy density E is proportional to sin2(kx), which has nodes at x=nπk (where n is an integer).
2. At t=T4, the energy density E is proportional to cos2(kx), which has nodes at x=(n+12)πk.
Step 6: Identify the correct graph
From the analysis, the graph for E at t=0 should show peaks at x=π2k and x=3π2k (sine squared function), while at t=T4, the graph should show peaks at x=0 and x=π (cosine squared function).
Based on the options provided, the correct graph that represents these conditions is Option A.
The given standing wave is represented by the equation:
y=acos(kx)cos(ωt)
where:
- a is the amplitude,
- k is the wave number,
- ω is the angular frequency.
The total energy density E is the sum of potential energy density Ep and kinetic energy density Ek:
E=Ep+Ek
The expressions for potential and kinetic energy densities are:
Ep=12Y(dydx)2
Ek=12ρ(dydt)2
where Y is Young's modulus and ρ is the density of the medium.
At t=0:
y=acos(kx)cos(0)=acos(kx)
Now, we differentiate y with respect to x and t:
1. dydx=−aksin(kx)
2. dydt=−aωsin(ωt)
Ep=12Y(−aksin(kx))2=12Ya2k2sin2(kx)
Ek=12ρ(−aωsin(0))2=0
E=Ep=12Ya2k2sin2(kx)
At t=T4:
y=acos(kx)cos(π2)=0
Now, substituting t=T4 into the derivatives:
1. dydx=−aksin(kx)
2. dydt=−aωsin(π2)=−aω
Ep=0
Ek=12ρ(−aω)2=12ρa2ω2
E=Ek=12ρa2ω2
1. At t=0, the energy density E is proportional to sin2(kx), which has nodes at x=nπk (where n is an integer).
2. At t=T4, the energy density E is proportional to cos2(kx), which has nodes at x=(n+12)πk.
From the analysis, the graph for E at t=0 should show peaks at x=π2k and x=3π2k (sine squared function), while at t=T4, the graph should show peaks at x=0 and x=π (cosine squared function).
Topper's Solved these Questions
- SUPERPOSITION AND STANDING WAVESBOOK - CENGAGE PHYSICS ENGLISHCHAPTER - SUPERPOSITION AND STANDING WAVESEXERCISE - Integer
9 Videos
- SUPERPOSITION AND STANDING WAVESBOOK - CENGAGE PHYSICS ENGLISHCHAPTER - SUPERPOSITION AND STANDING WAVESEXERCISE - Single Correct Answer Type
56 Videos
- SUPERPOSITION AND STANDING WAVESBOOK - CENGAGE PHYSICS ENGLISHCHAPTER - SUPERPOSITION AND STANDING WAVESEXERCISE - Assertion - Reasoning
6 Videos
- SOUND WAVES AND DOPPLER EFFECTBOOK - CENGAGE PHYSICS ENGLISHCHAPTER - SOUND WAVES AND DOPPLER EFFECTEXERCISE - Integer
16 Videos
- THERMODYNAMICSBOOK - CENGAGE PHYSICS ENGLISHCHAPTER - THERMODYNAMICSEXERCISE - 24
1 Videos
Similar Questions
A longitudinal standing wave y=acoskxcosωt is maintained in a homogeneious medium of density ρ. Here ω is the angular speed and k , the wave number and a is the amplitude of the standing wave . This standing wave exists all over a given region of space.
The space density of the kinetic energy . KE=Ek(x,t) at the point (x,t) is given by
View SolutionA longitudinal standing wave y=acoskxcosωt is maintained in a homogeneious medium of density ρ. Here ω is the angular speed and k , the wave number and a is the amplitude of the standing wave . This standing wave exists all over a given region of space.
The space density of the potential energy PE=Ep(x,t) at a point (x,t) in this space is
View Solution
Knowledge Check
The stationary wave y = 2a sinkx cosωt in a stretched string is the result of superposition of y1=asin(kx−ωt) and
Ay2=acos(kx+ωt)By2=asin(kx+ωt)Cy2=acos(kx−ωt)Dy2=asin(kx−ωt)
In a standing wave, node is a point of
View SolutionWhich of the following represents a standing wave ?
View SolutionStanding waves can be produced
View SolutionStanding waves can be produced
View SolutionA standing wave ξ=asinkx.Cosωt is maintained in a homogeneous rod with cross − sectional area S and density ρ. Find the total mechanical energy confined between the sections corresponding to the adjacent displacement nodes.
View SolutionIn a standing transerse wave on a string :
View SolutionAs the e.m. waves travel in free space
View Solution
