A particle is executing SHM between points-XmandXm, as shown in figure(i). The velocity V(t) of the particle is partially graphed and shown in figure (ii). Two points A and B corresponding to time t1 and time t2 respectively are marked on the V(t) curve.
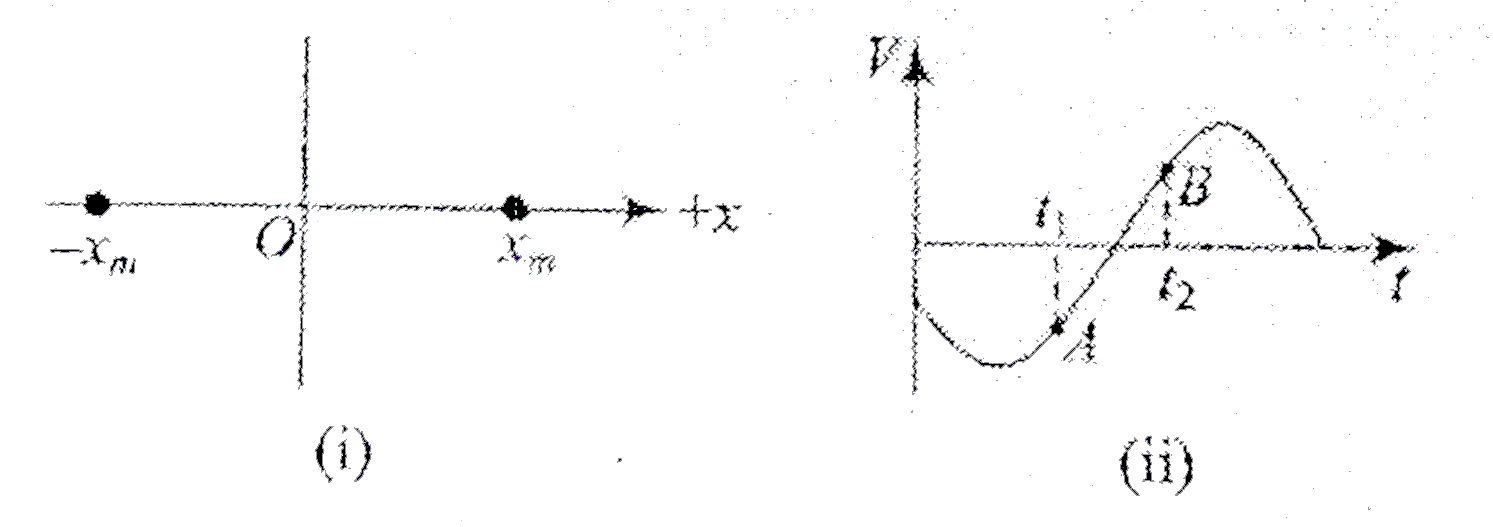
At time t1, it ios going towards Xm.
At time t1, its speed is decreasing
At time t2, its position lies in between −Xm and O
The phase difference Δϕ between points A and B must be expressed as 90∘<Δϕ<180∘.
The correct Answer is:B, C
Step by step video & image solution for A particle is executing SHM between points-X_(m)andX_(m), as shown in figure(i). The velocity V(t) of the particle is partially graphed and shown in figure (ii). Two points A and B corresponding to time t_(1) and time t_(2) respectively are marked on the V(t) curve. by Physics experts to help you in doubts & scoring excellent marks in Class 11 exams.
Updated on:21/07/2023Topper's Solved these Questions
- LINEAR AND ANGULAR SIMPLE HARMONIC MOTIONBOOK - CENGAGE PHYSICS ENGLISHCHAPTER - LINEAR AND ANGULAR SIMPLE HARMONIC MOTIONEXERCISE - Multiple Correct Answer Type
5 Videos
- LINEAR AND ANGULAR SIMPLE HARMONIC MOTIONBOOK - CENGAGE PHYSICS ENGLISHCHAPTER - LINEAR AND ANGULAR SIMPLE HARMONIC MOTIONEXERCISE - Multiple Correct Answer Type
9 Videos
- LINEAR AND ANGULAR SIMPLE HARMONIC MOTIONBOOK - CENGAGE PHYSICS ENGLISHCHAPTER - LINEAR AND ANGULAR SIMPLE HARMONIC MOTIONEXERCISE - Subjective type
2 Videos
- KINETIC THEORY OF GASES AND FIRST LAW OF THERMODYNAMICSBOOK - CENGAGE PHYSICS ENGLISHCHAPTER - KINETIC THEORY OF GASES AND FIRST LAW OF THERMODYNAMICSEXERCISE - Interger
11 Videos
- MISCELLANEOUS KINEMATICSBOOK - CENGAGE PHYSICS ENGLISHCHAPTER - MISCELLANEOUS KINEMATICSEXERCISE - Interger type
3 Videos
Similar Questions
The velocity of particle (whose displacement time graph is shown) at t=3
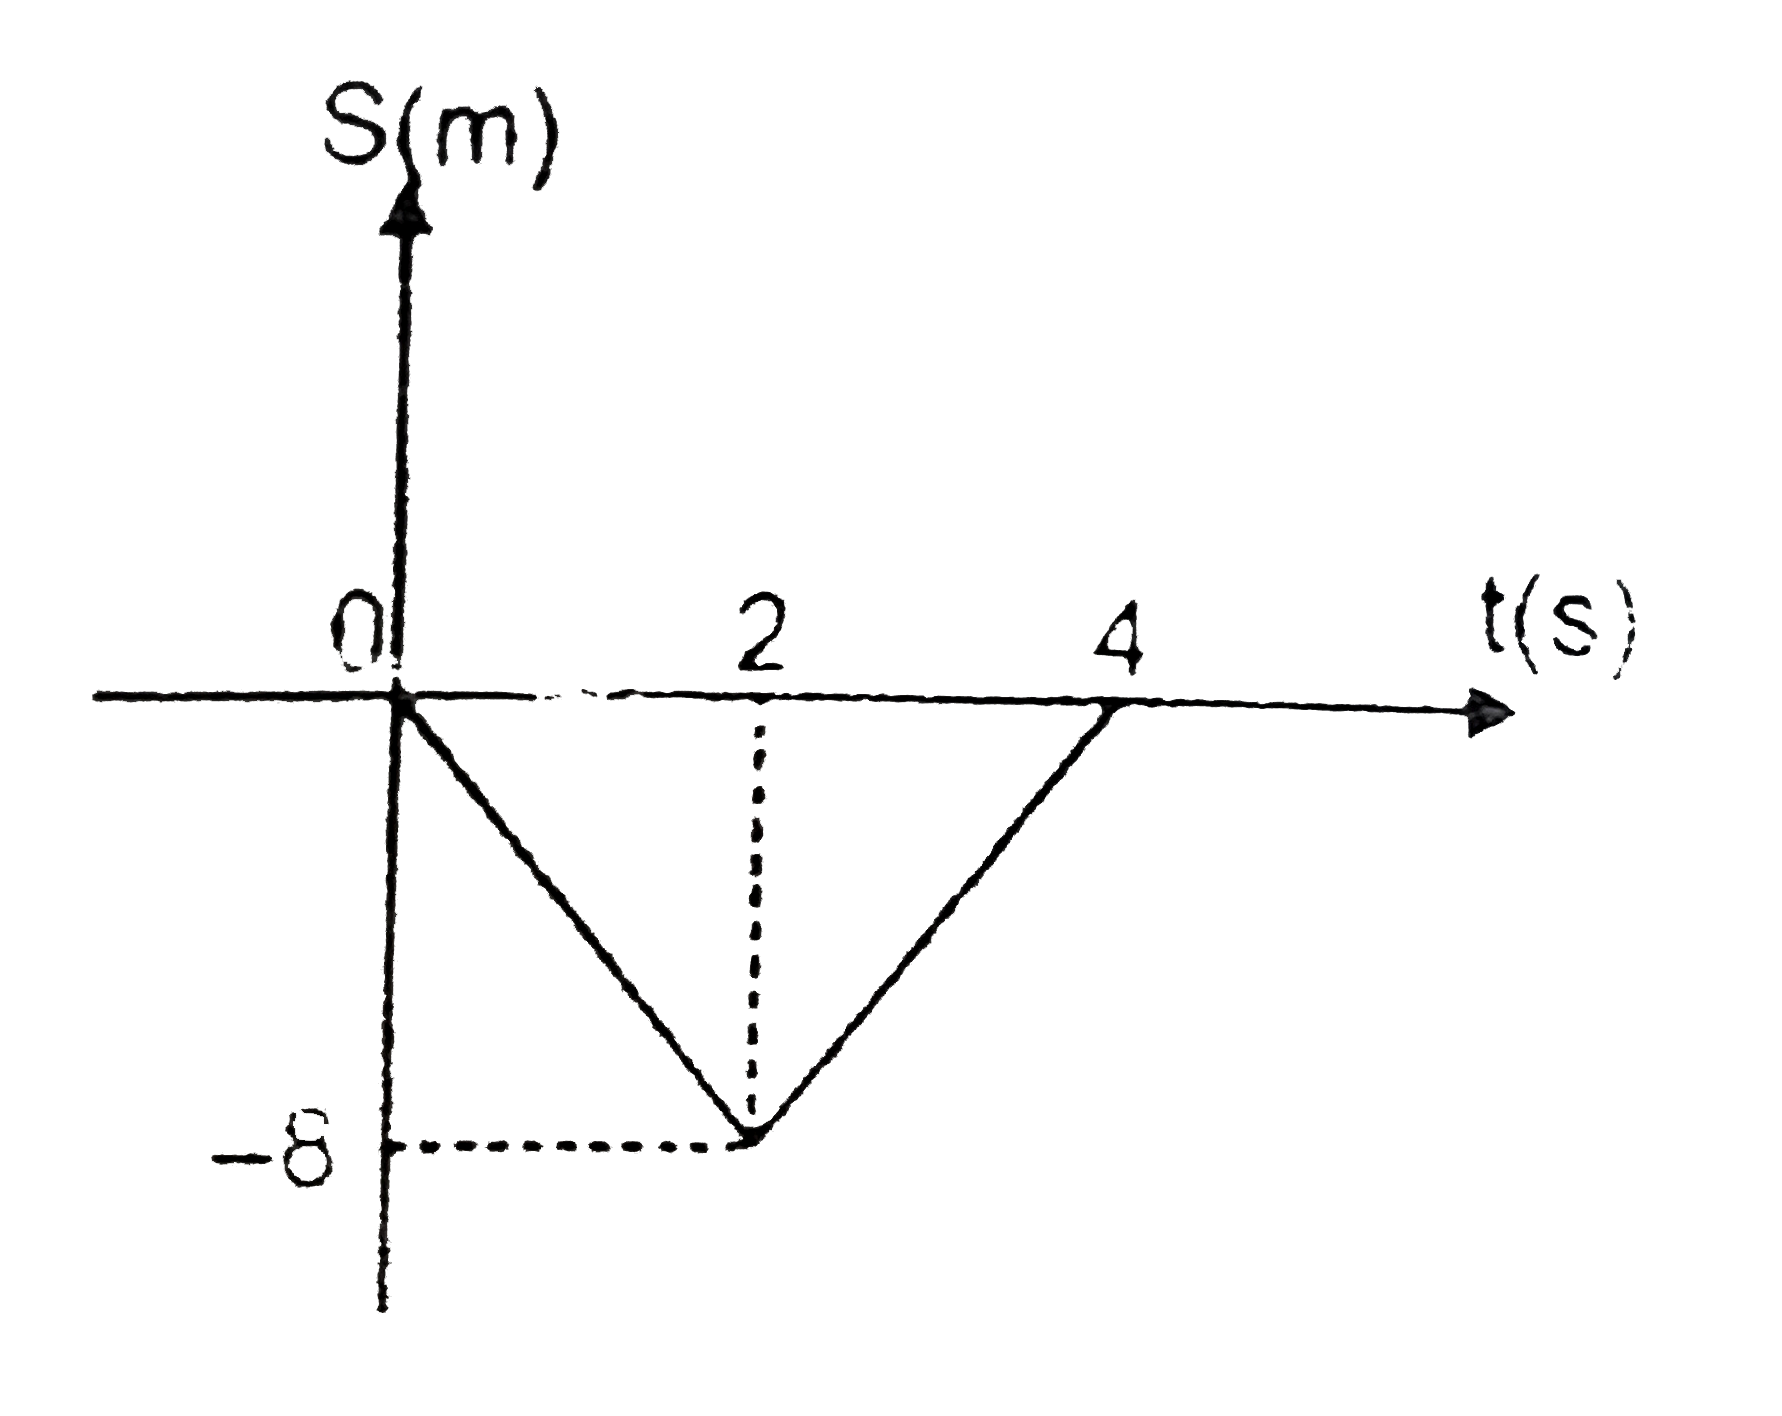 .
.
View SolutionThe figure shows the velocity (v) of a particle plotted against time (t).
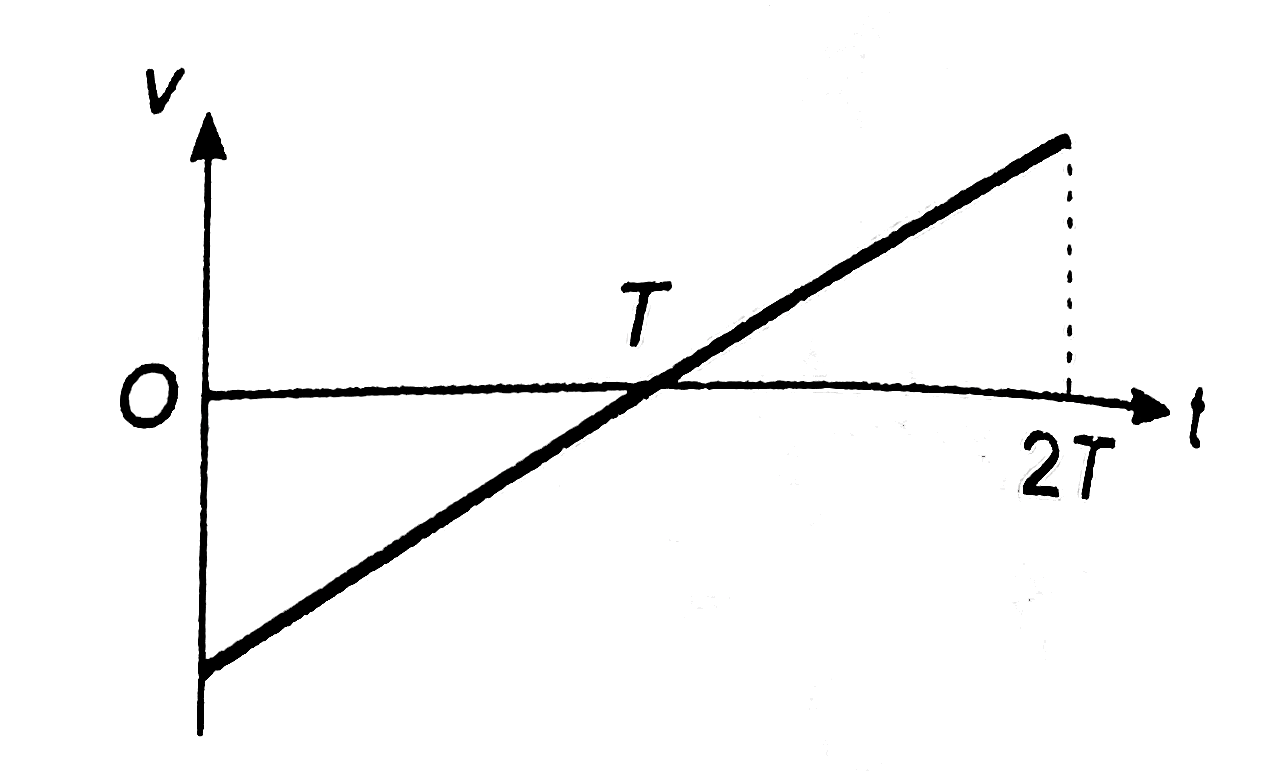
View SolutionThe figure shows the velocity (v) of a particle plotted against time (t).

View SolutionThe velocity (v) - time (t) graph for a particle moving along x - axis is shown in the figure. The corresponding position (x) - time (t) is best represented by
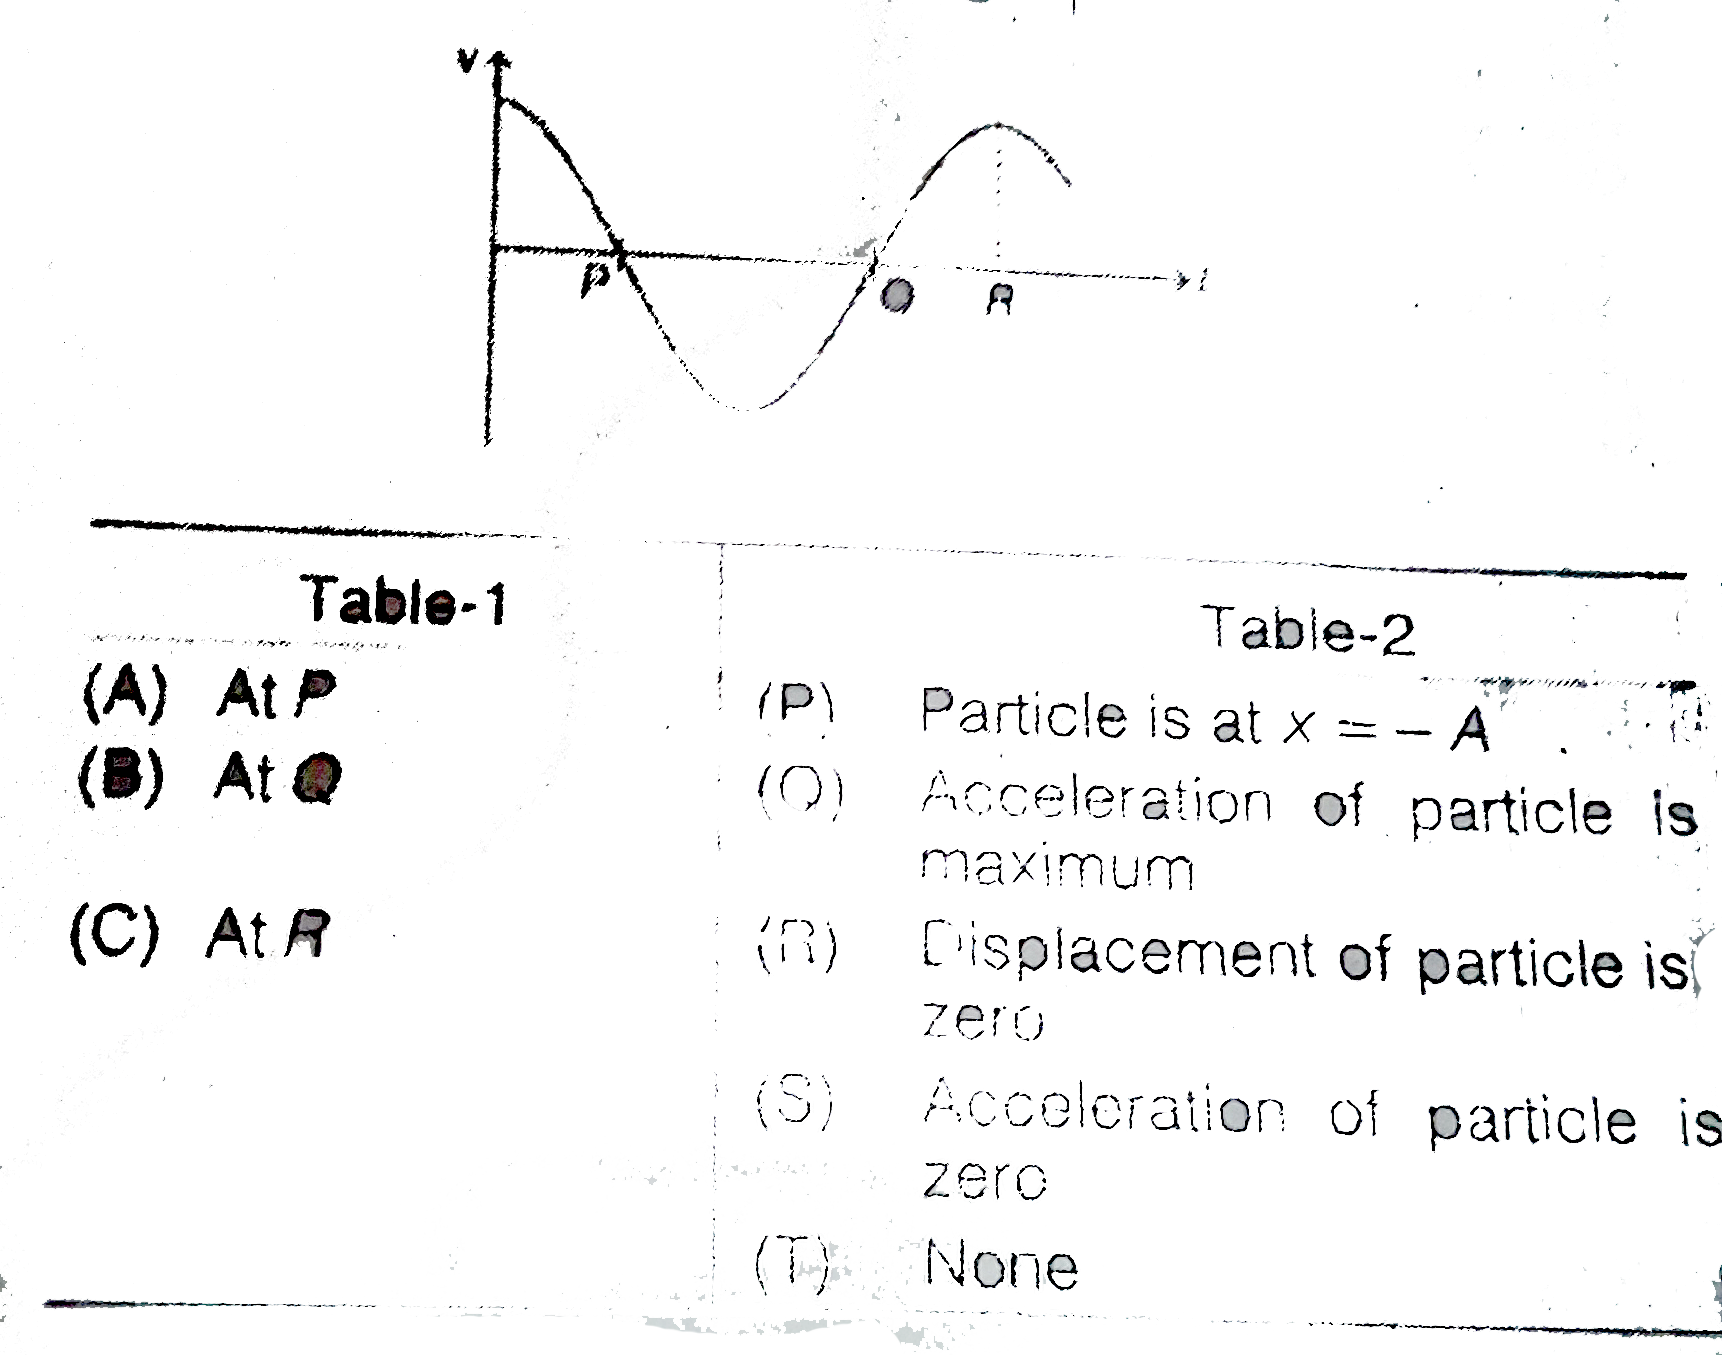
View SolutionVelocity-time graph of a particle in SHM is as shown in figure. Match the following
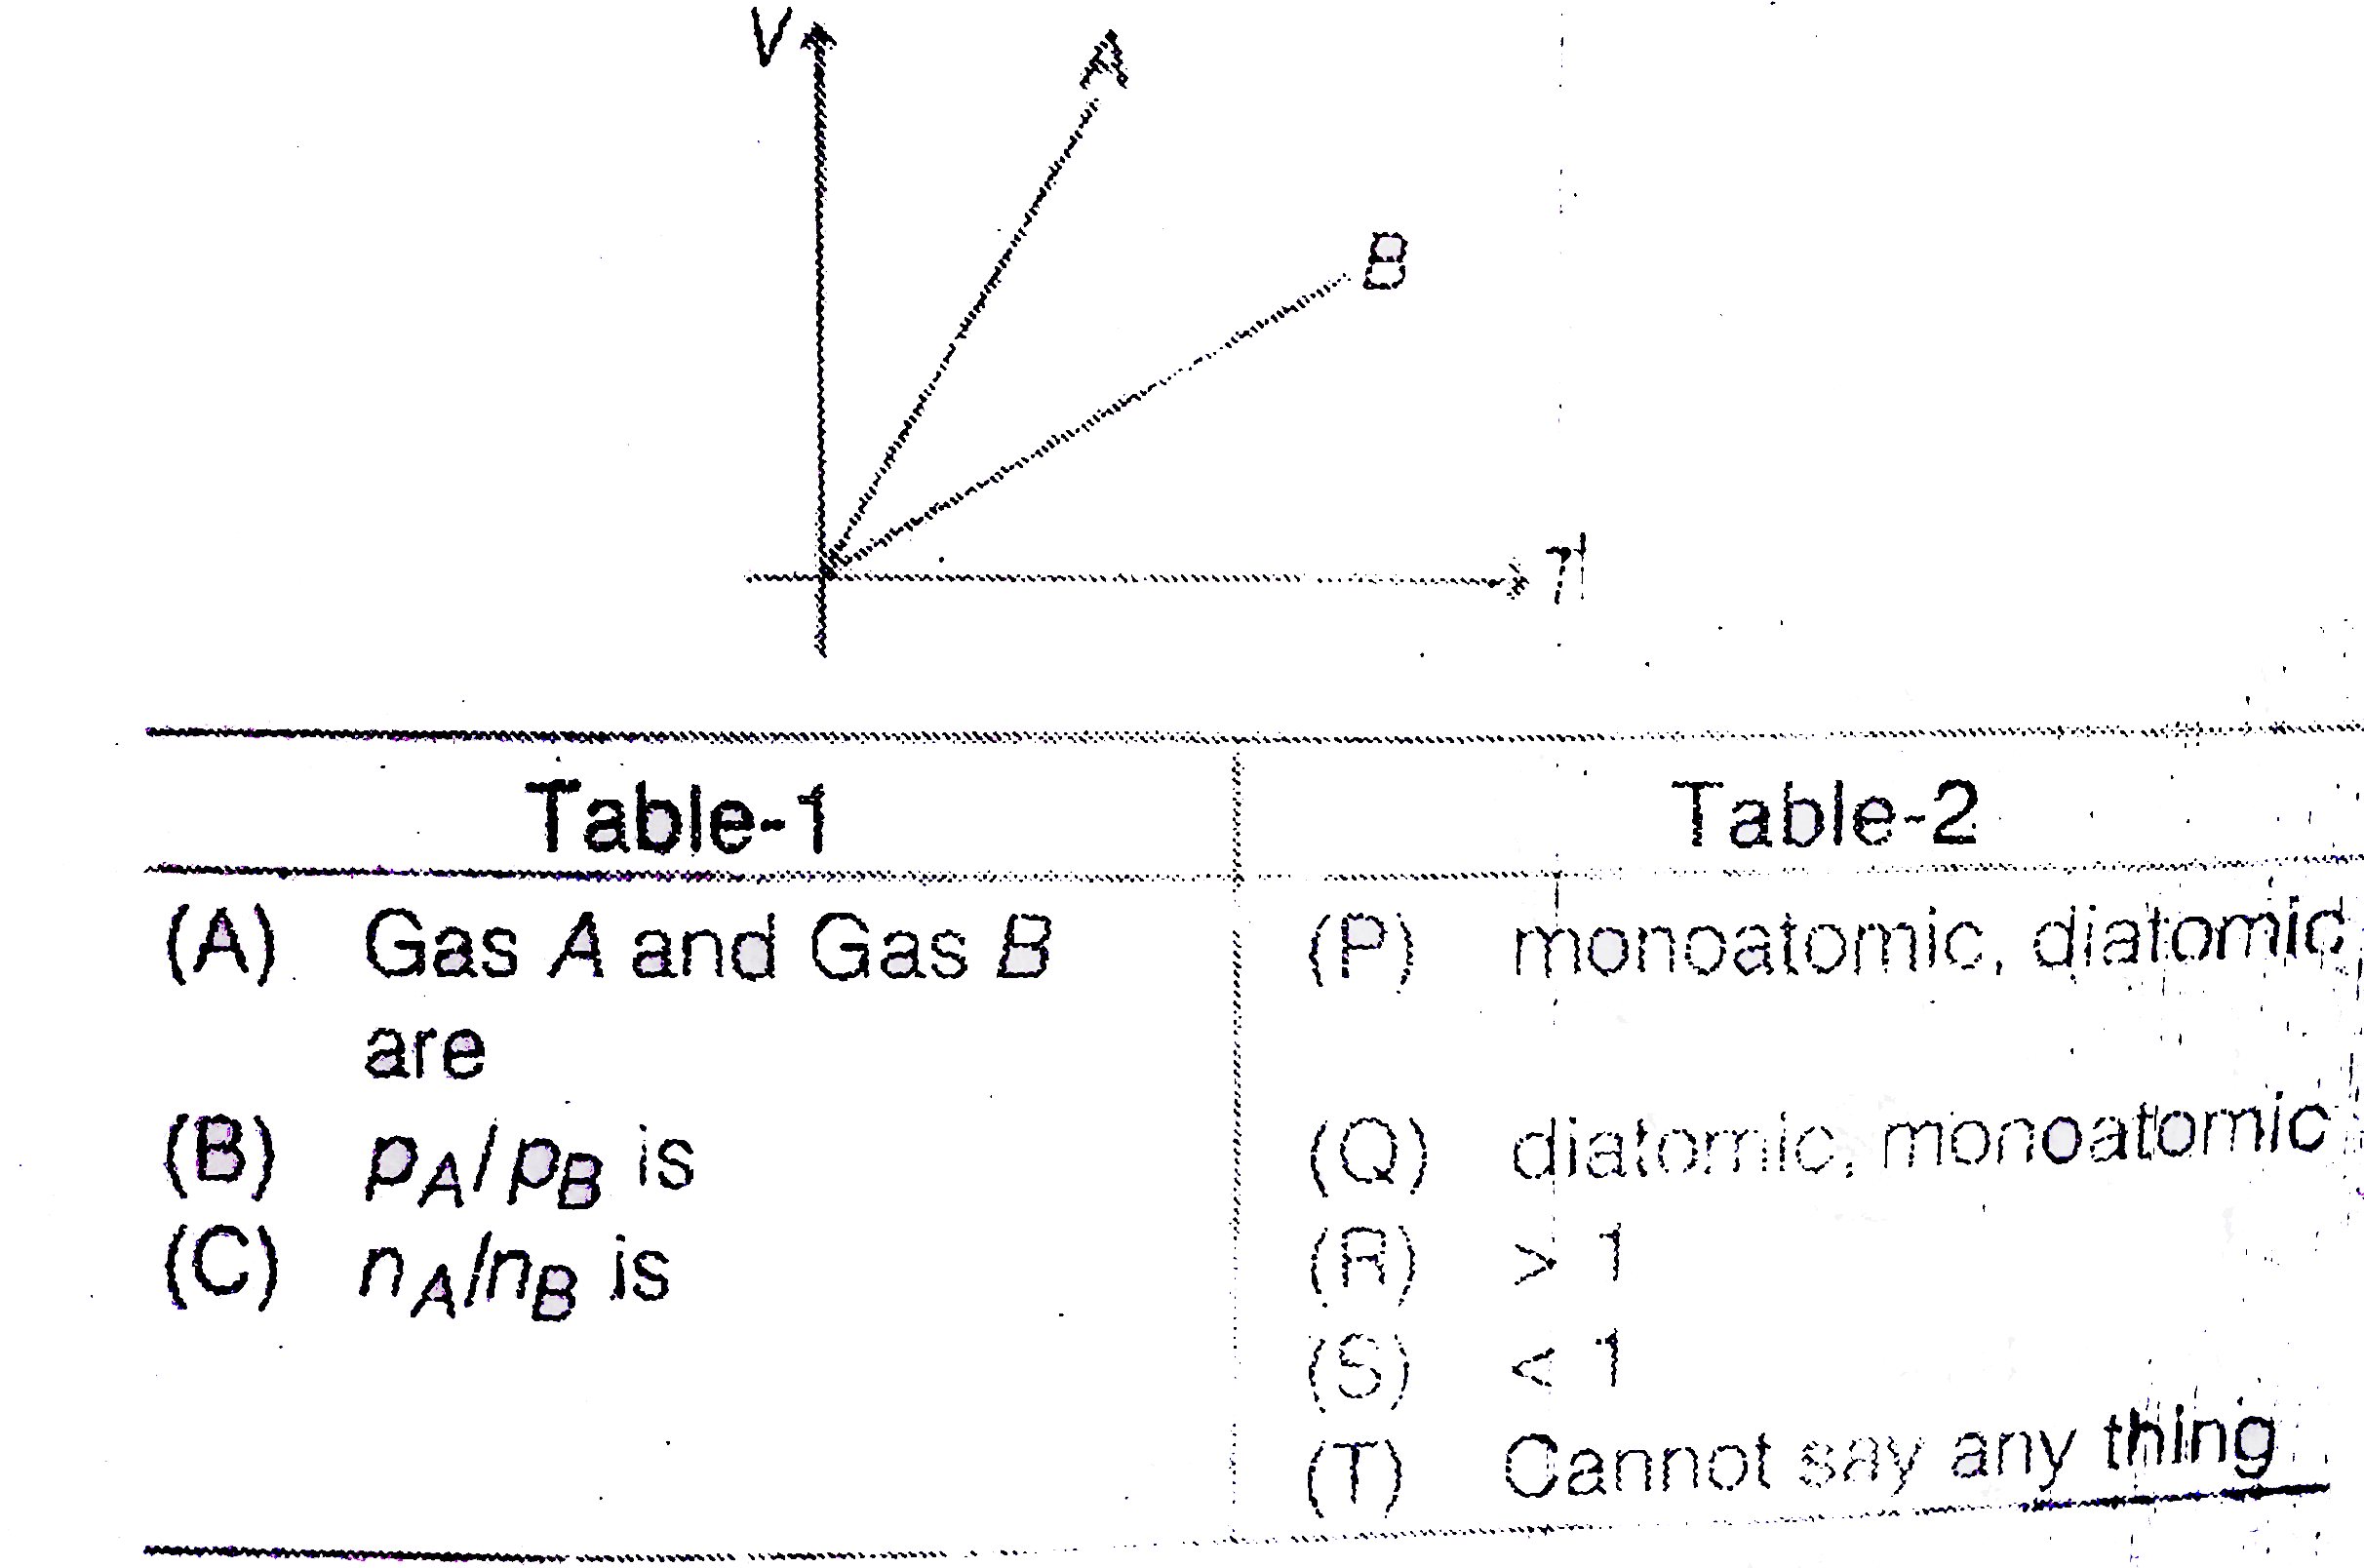
View SolutionIn the V-T graph shown in figure match the following.
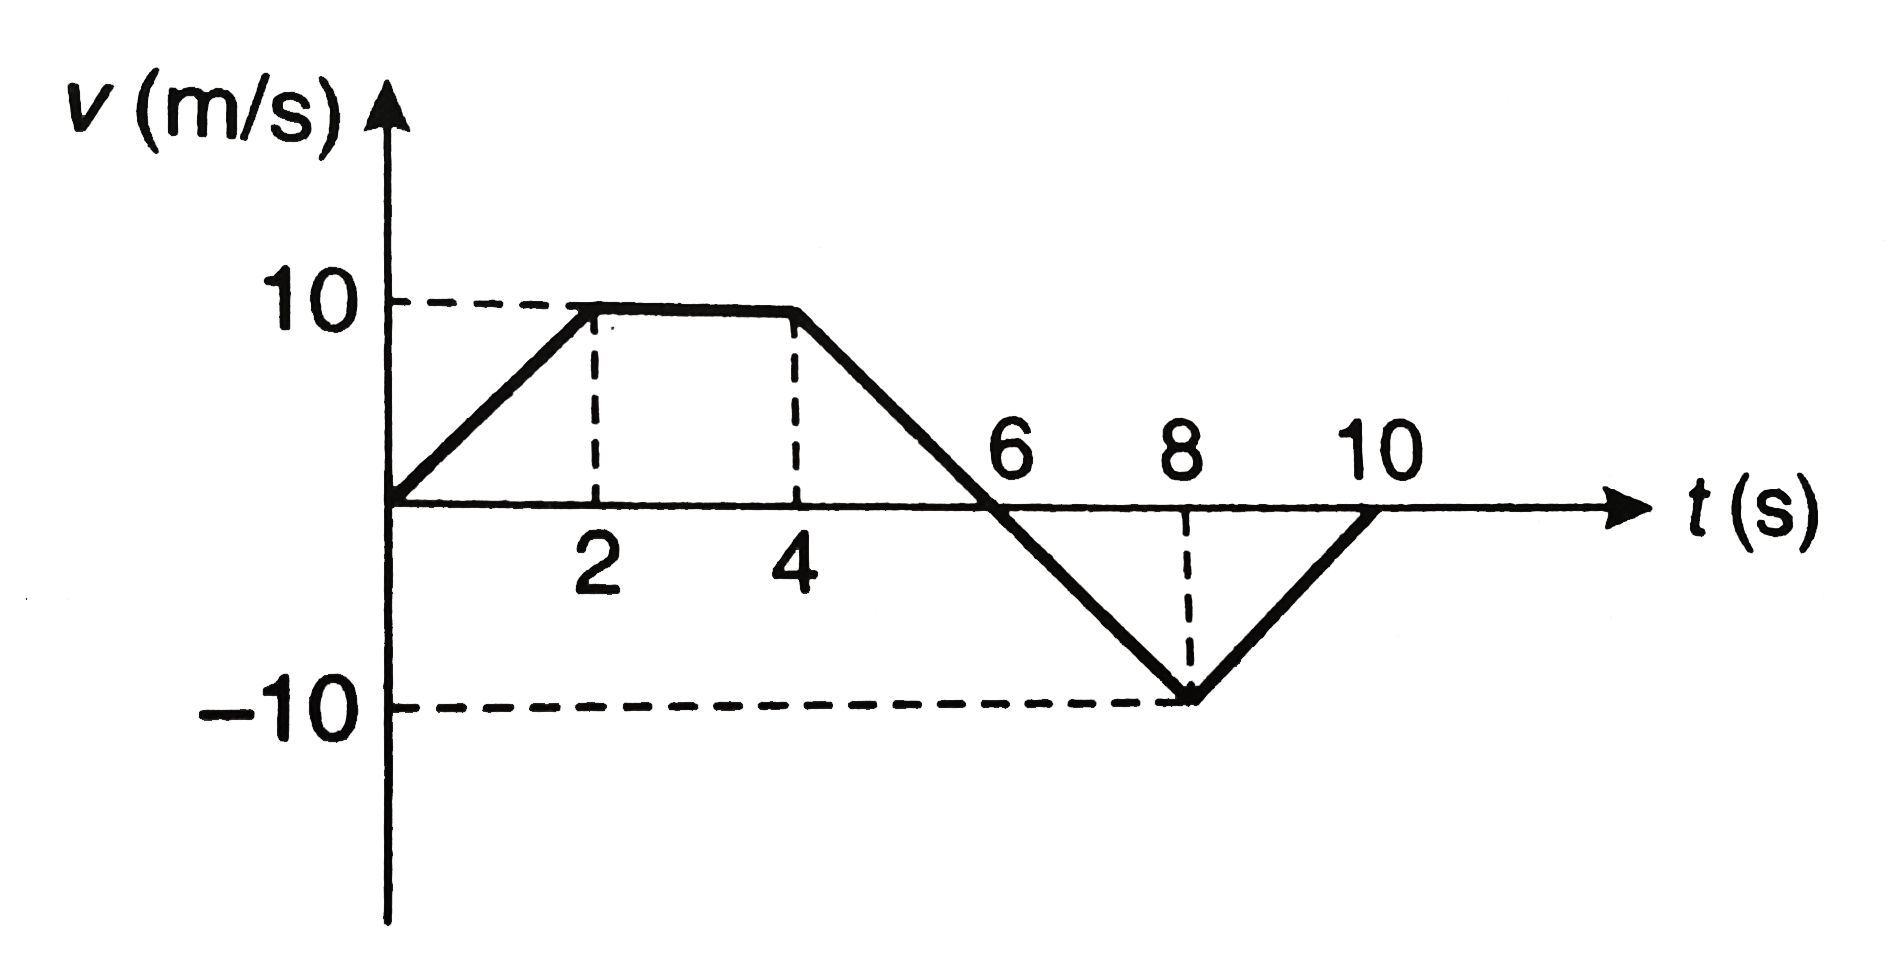
View SolutionVelocity-time graph of a particle moving in a straight line is shown in figure. At time t=0,s=−10m. Plot corresponding a-t and s-t graphs.
View SolutionThe velocity-time (v-t) graph for a particle in a straight line motion is given below The corresponding accelaration-time (a-t) graph will
View SolutionThe x-t graph of a particle moving along a straight line is shown in figure

The v-t graph of the particle is correctly shown by
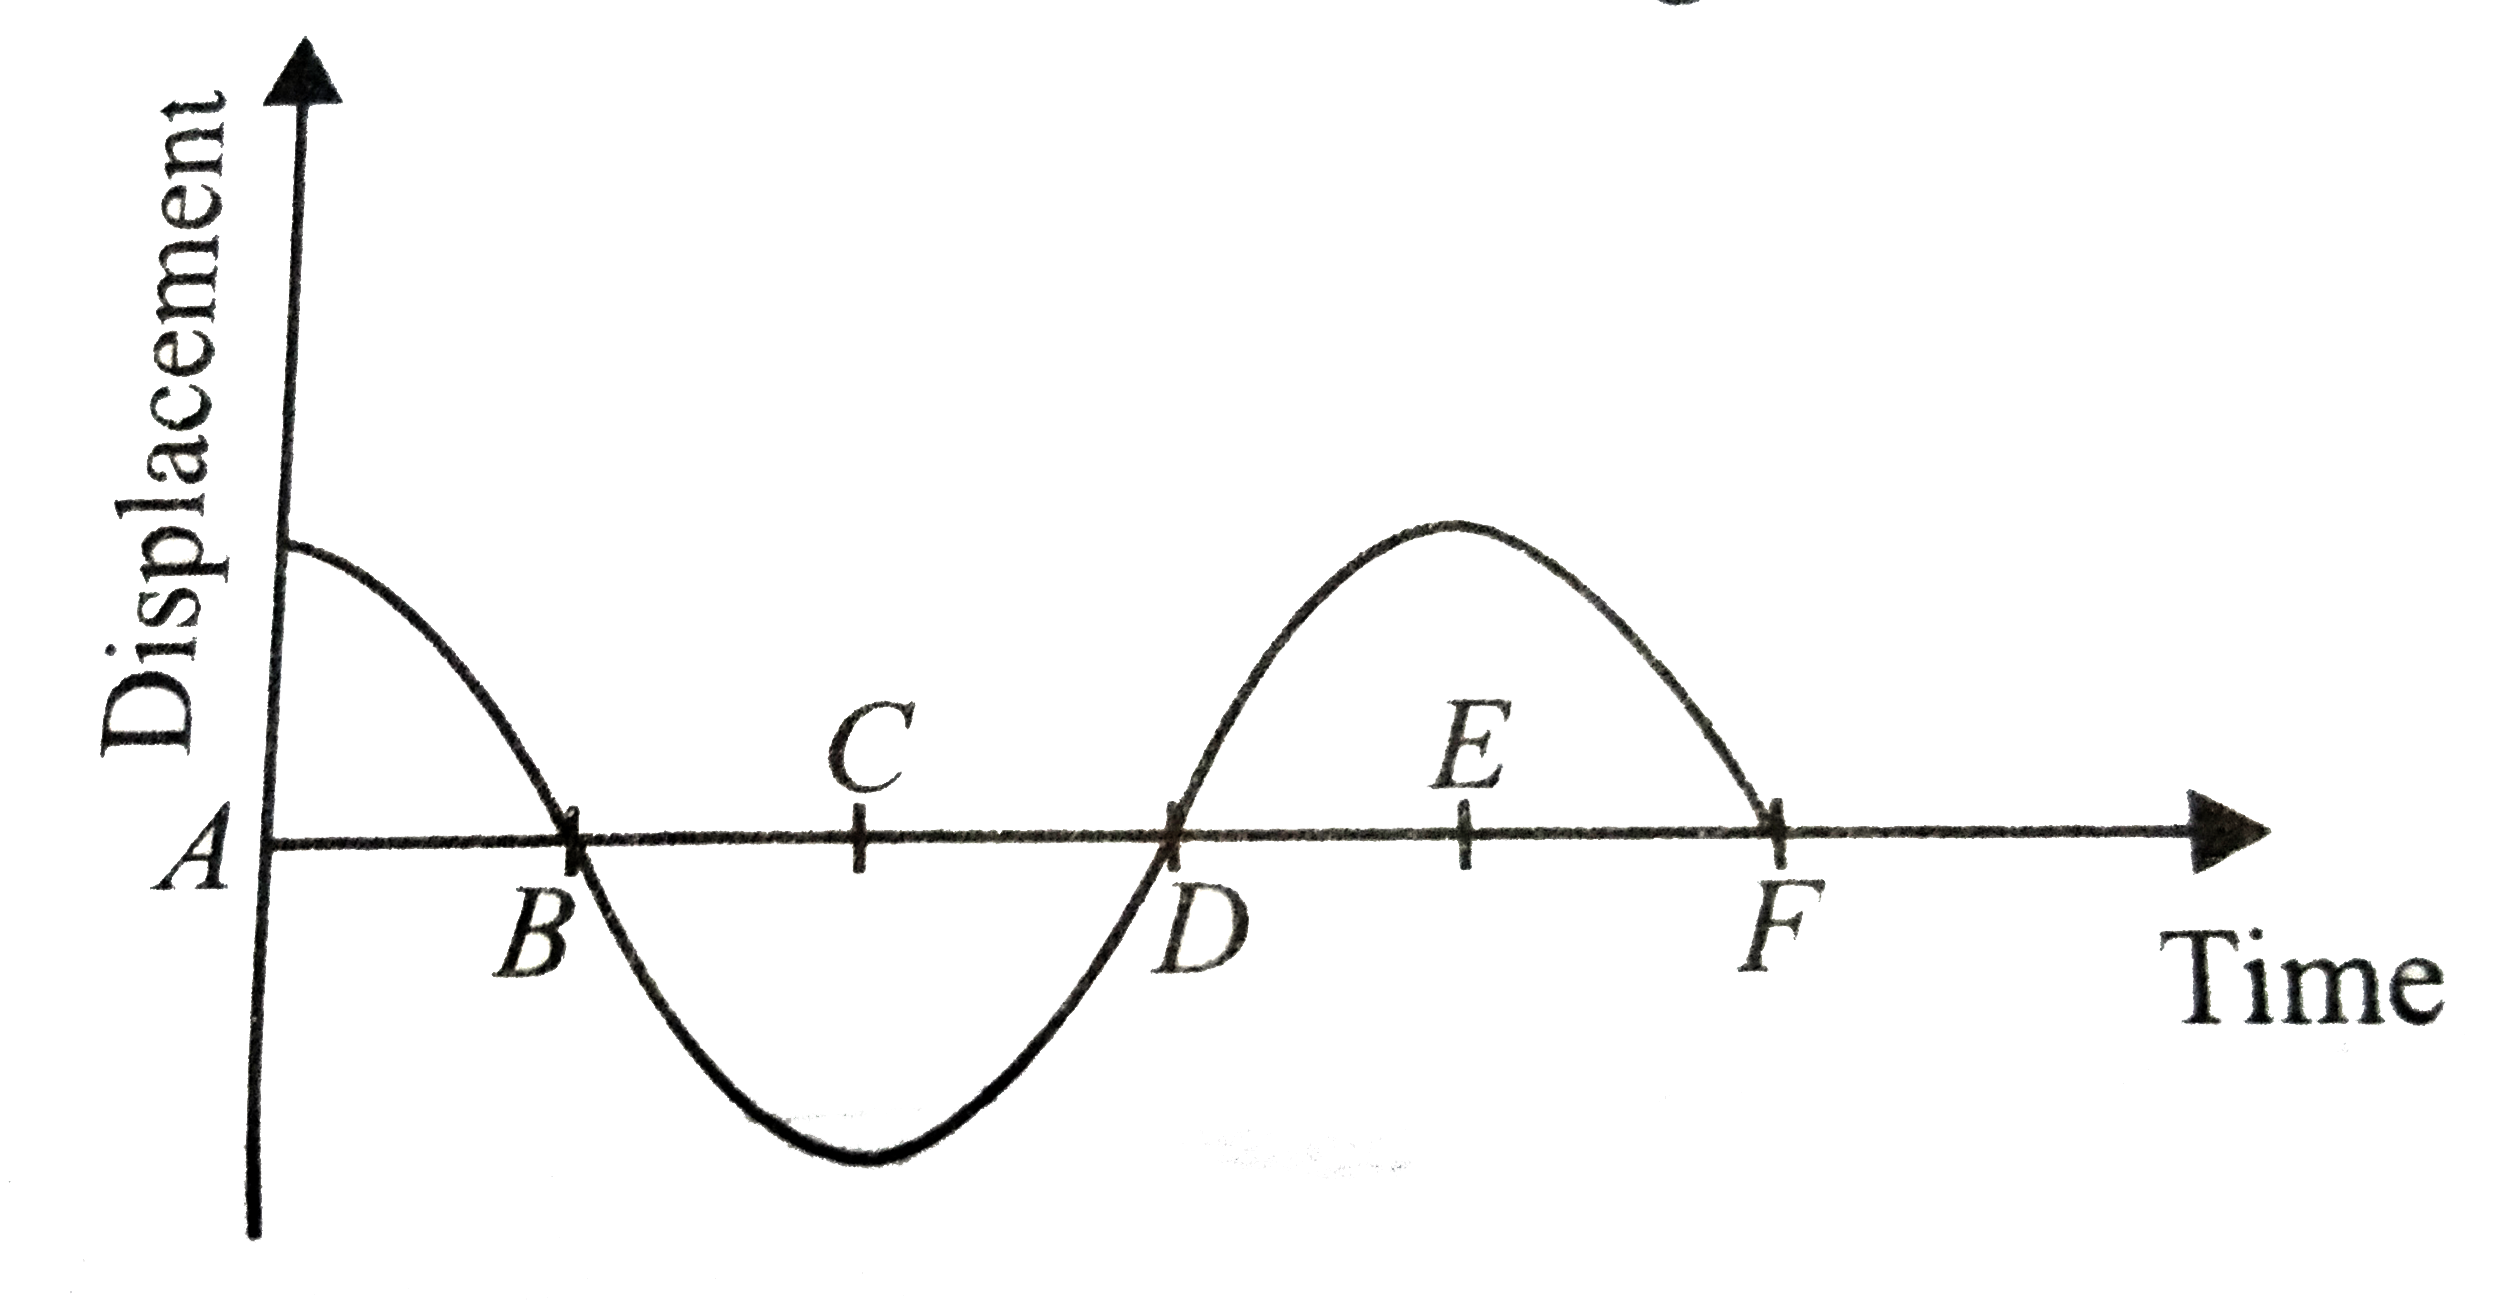
View Solutiondisplacement versus time curve for a particle executing SHM is is as shown in figure. At what points the velocity of the particle is zero?
View Solution
