A particle of mass m oscillates with simple harmonic motion between points x1 and x2, the equilibrium position being O. Its potential energy is plotted. It will be as given below in the graph
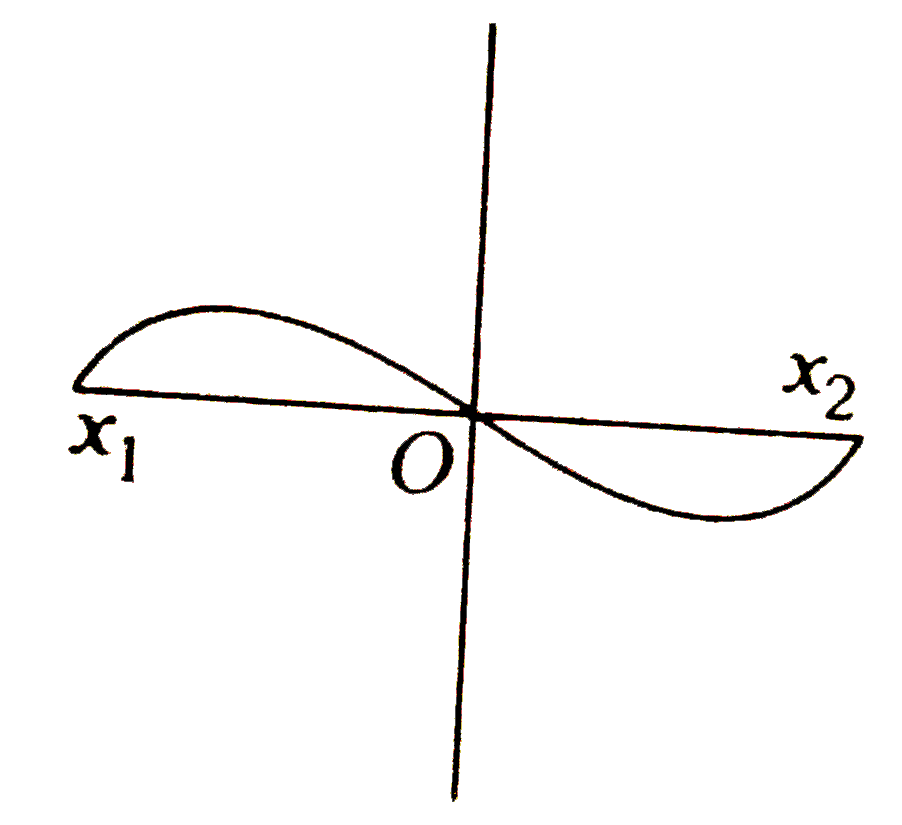
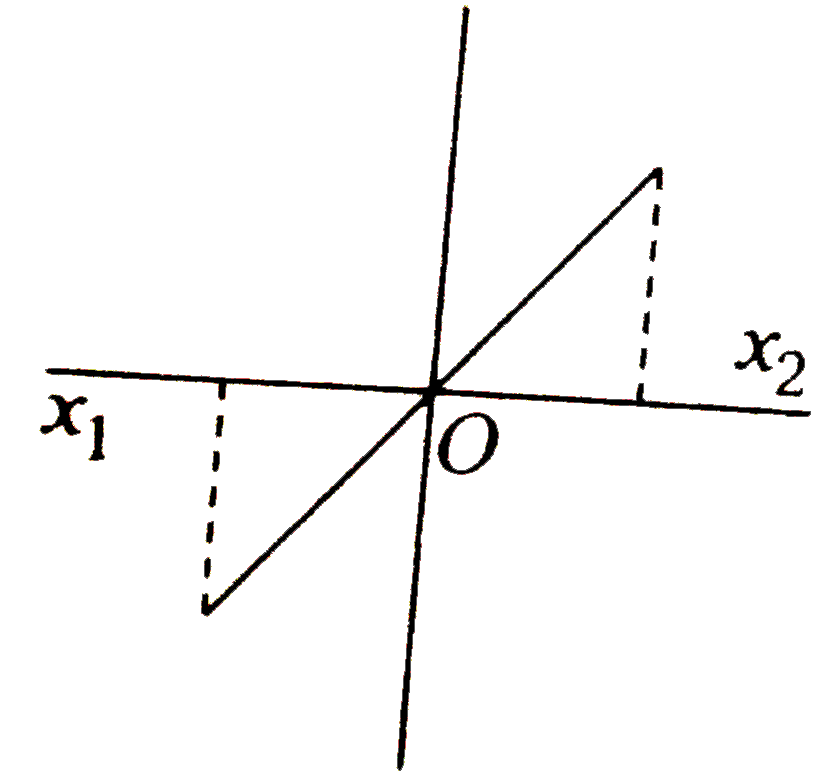
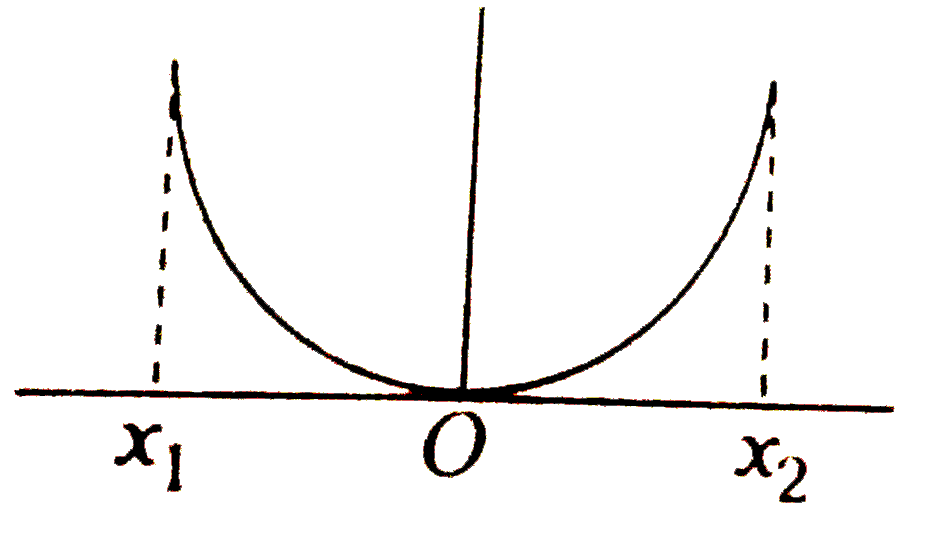
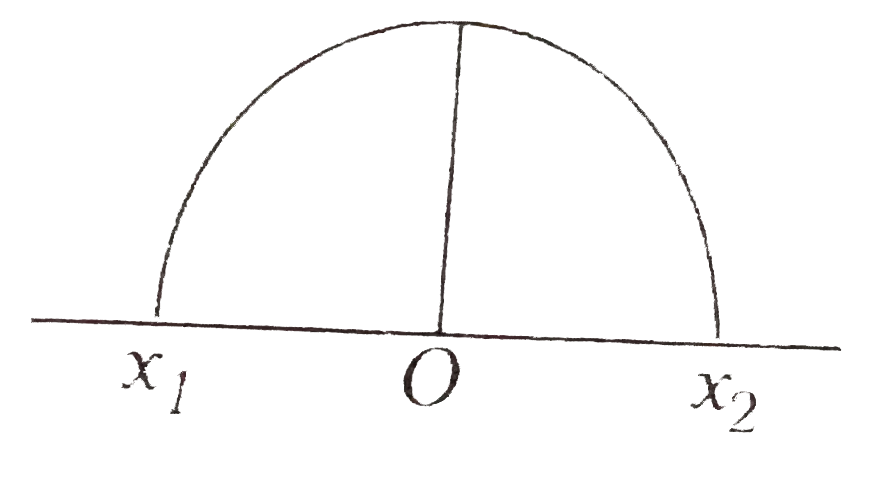
The correct Answer is:C
To solve the problem of determining the correct graph for the potential energy of a particle oscillating in simple harmonic motion (SHM) between points x1 and x2 with the equilibrium position at O, we can follow these steps:
Step 1: Understand the Potential Energy in SHM
The potential energy U of a particle in simple harmonic motion is given by the formula:
U=12mω2x2
where:
- m is the mass of the particle,
- ω is the angular frequency,
- x is the displacement from the equilibrium position.
Step 2: Analyze the Formula
From the formula, we can observe that:
- The potential energy U is proportional to the square of the displacement x.
- This means that as x increases (either positively or negatively), the potential energy increases.
Step 3: Identify the Shape of the Graph
Since U is proportional to x2, the graph of potential energy versus displacement will be a parabola that opens upwards. The vertex of this parabola will be at the equilibrium position O (where x=0), and the potential energy at this point will be zero.
Step 4: Determine the Characteristics of the Graph
- At the equilibrium position O (i.e., x=0), the potential energy U is zero.
- As the particle moves towards x1 and x2, the potential energy will increase, reflecting the quadratic relationship.
Step 5: Evaluate the Given Options
Based on the characteristics of the potential energy graph:
- The correct graph should show a parabola opening upwards with the lowest point (minimum potential energy) at the equilibrium position O.
- The potential energy should be zero at x=0 and increase as x moves away from zero in either direction.
Conclusion
After analyzing the options provided in the question, the graph that matches the described characteristics (a parabola opening upwards with the vertex at the equilibrium position) is the correct answer.
Final Answer
The correct option is Option 3, which represents the potential energy of the particle in simple harmonic motion.
---
The potential energy U of a particle in simple harmonic motion is given by the formula:
U=12mω2x2
where:
- m is the mass of the particle,
- ω is the angular frequency,
- x is the displacement from the equilibrium position.
From the formula, we can observe that:
- The potential energy U is proportional to the square of the displacement x.
- This means that as x increases (either positively or negatively), the potential energy increases.
Since U is proportional to x2, the graph of potential energy versus displacement will be a parabola that opens upwards. The vertex of this parabola will be at the equilibrium position O (where x=0), and the potential energy at this point will be zero.
- At the equilibrium position O (i.e., x=0), the potential energy U is zero.
- As the particle moves towards x1 and x2, the potential energy will increase, reflecting the quadratic relationship.
Based on the characteristics of the potential energy graph:
- The correct graph should show a parabola opening upwards with the lowest point (minimum potential energy) at the equilibrium position O.
- The potential energy should be zero at x=0 and increase as x moves away from zero in either direction.
After analyzing the options provided in the question, the graph that matches the described characteristics (a parabola opening upwards with the vertex at the equilibrium position) is the correct answer.
The correct option is Option 3, which represents the potential energy of the particle in simple harmonic motion.
Similar Questions
A particle oscillates simple harmonic motion with a period of 16s. Two second after crossing the equilibrium position its velocity becomes 1m/s. The amplitude is
View SolutionA particle is vibrating in a simple harmonic motion with an amplitude of 4 cm . At what displacement from the equilibrium position, is its energy half potential and half kinetic
View SolutionA particle executes simple harmonic motion with an amplitude of 10 cm. At what distance from the mean position are the kinetic and potential energies equal?
View SolutionA particle starts oscillating simple harmonically from its equilibrium position then, the ratio of kinetic energy and potential energy of the particle at the time T/12 is: (T=time period)
View SolutionA particle executing harmonic motion is having velocities v1 and v2 at distances is x1 and x2 from the equilibrium position. The amplitude of the motion is
View SolutionA particle of mass 2kg moves in simple harmonic motion and its potential energy U varies with position x as shown. The period of oscillation of the particle is
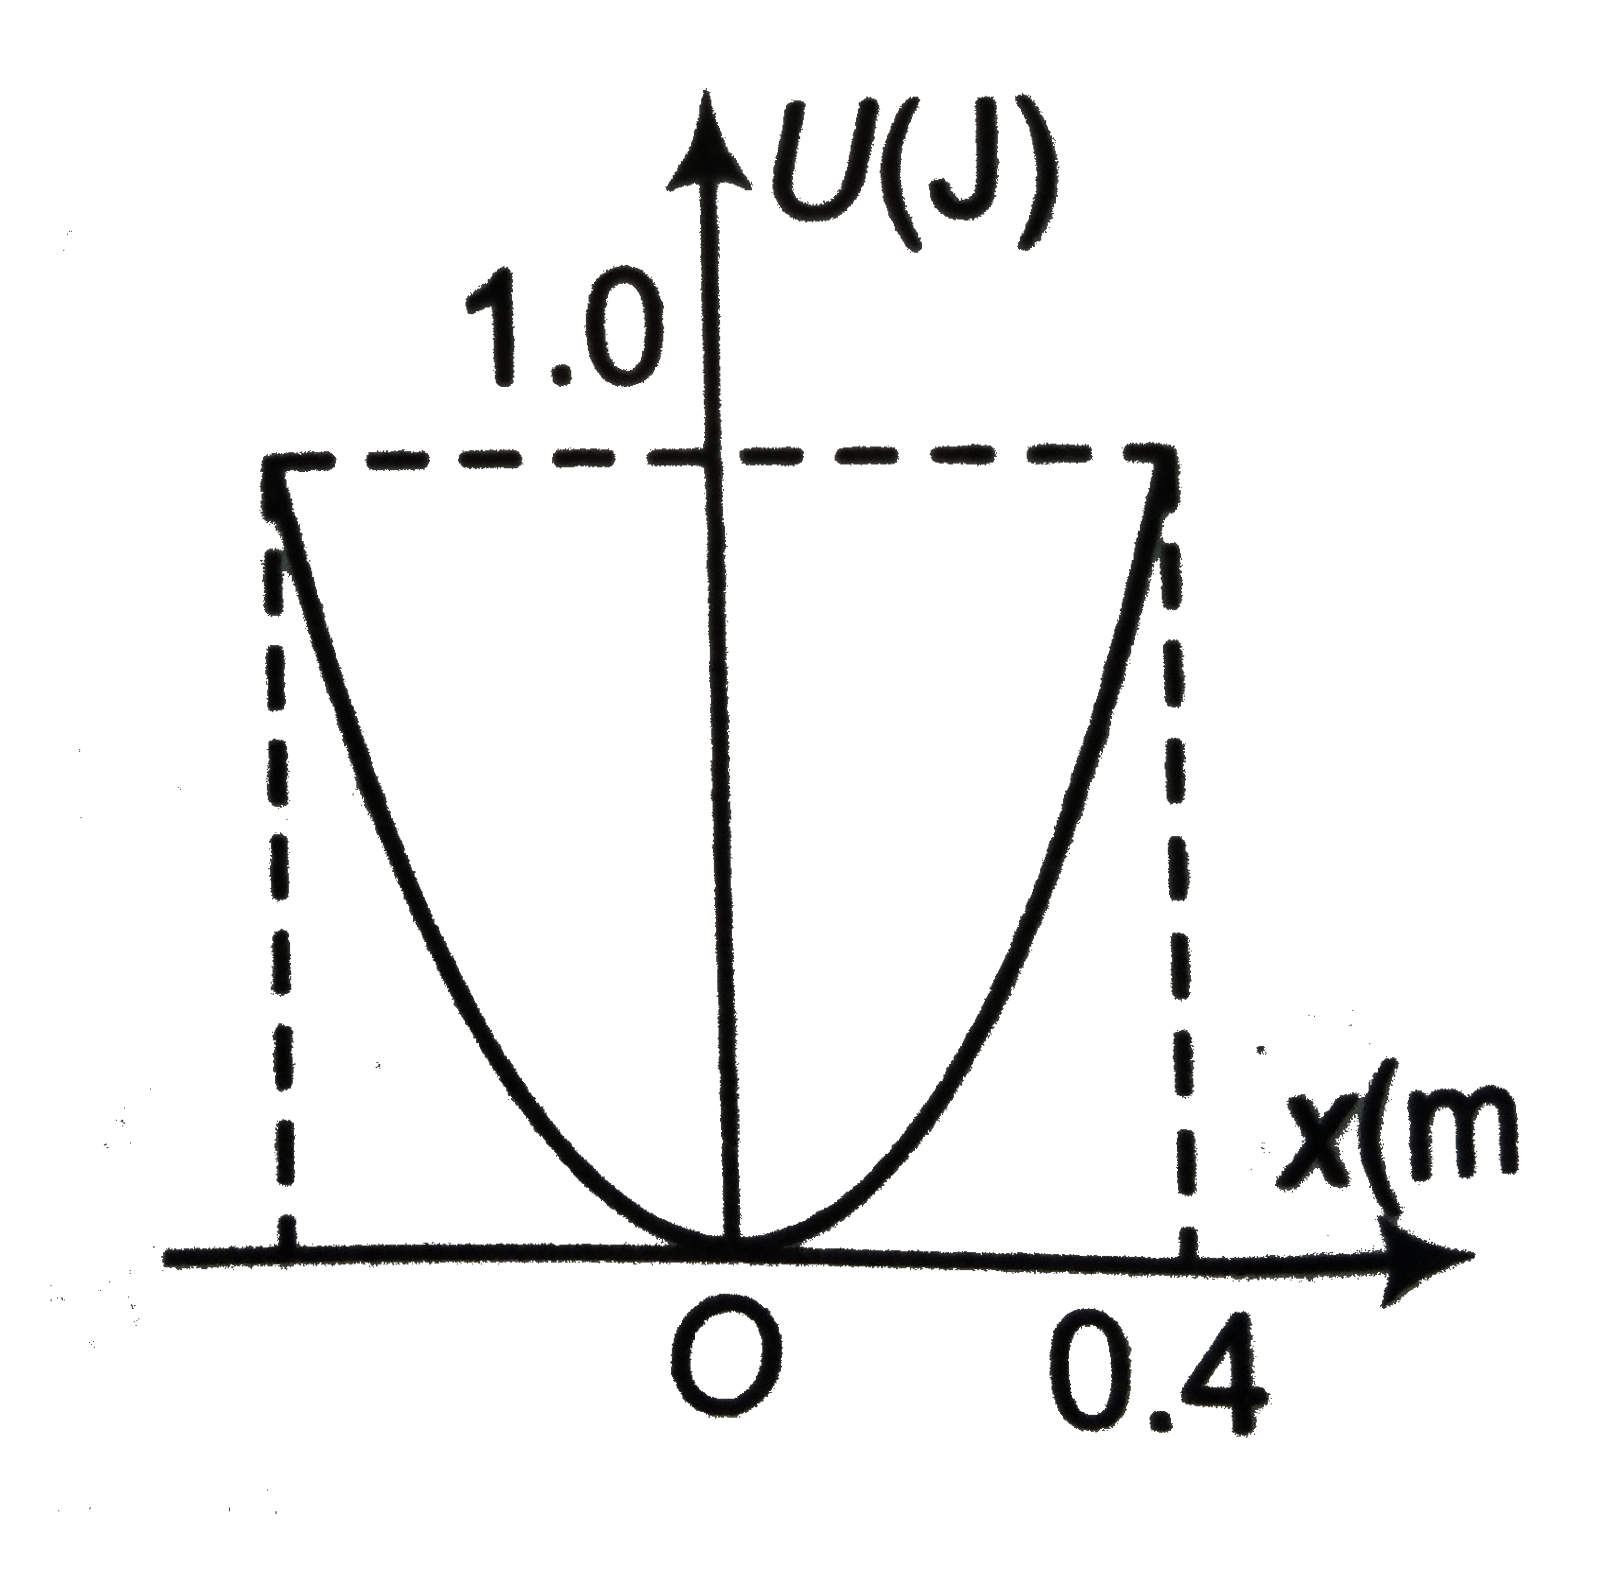
View SolutionA particle of mass 2kg moves in simple harmonic motion and its potential energy U varies with position x as shown. The period of oscillation of the particle is

View SolutionThe total energy of a particle, executing simple harmonic motion is.
where x is the displacement from the mean position, hence total energy is independent of x.
View SolutionA particle of mass = 2kg moves in simple harmonic motion and its potential energy U varies with position x as shown. The period of oscillation of the particle is nπ5 second. Find value of n.
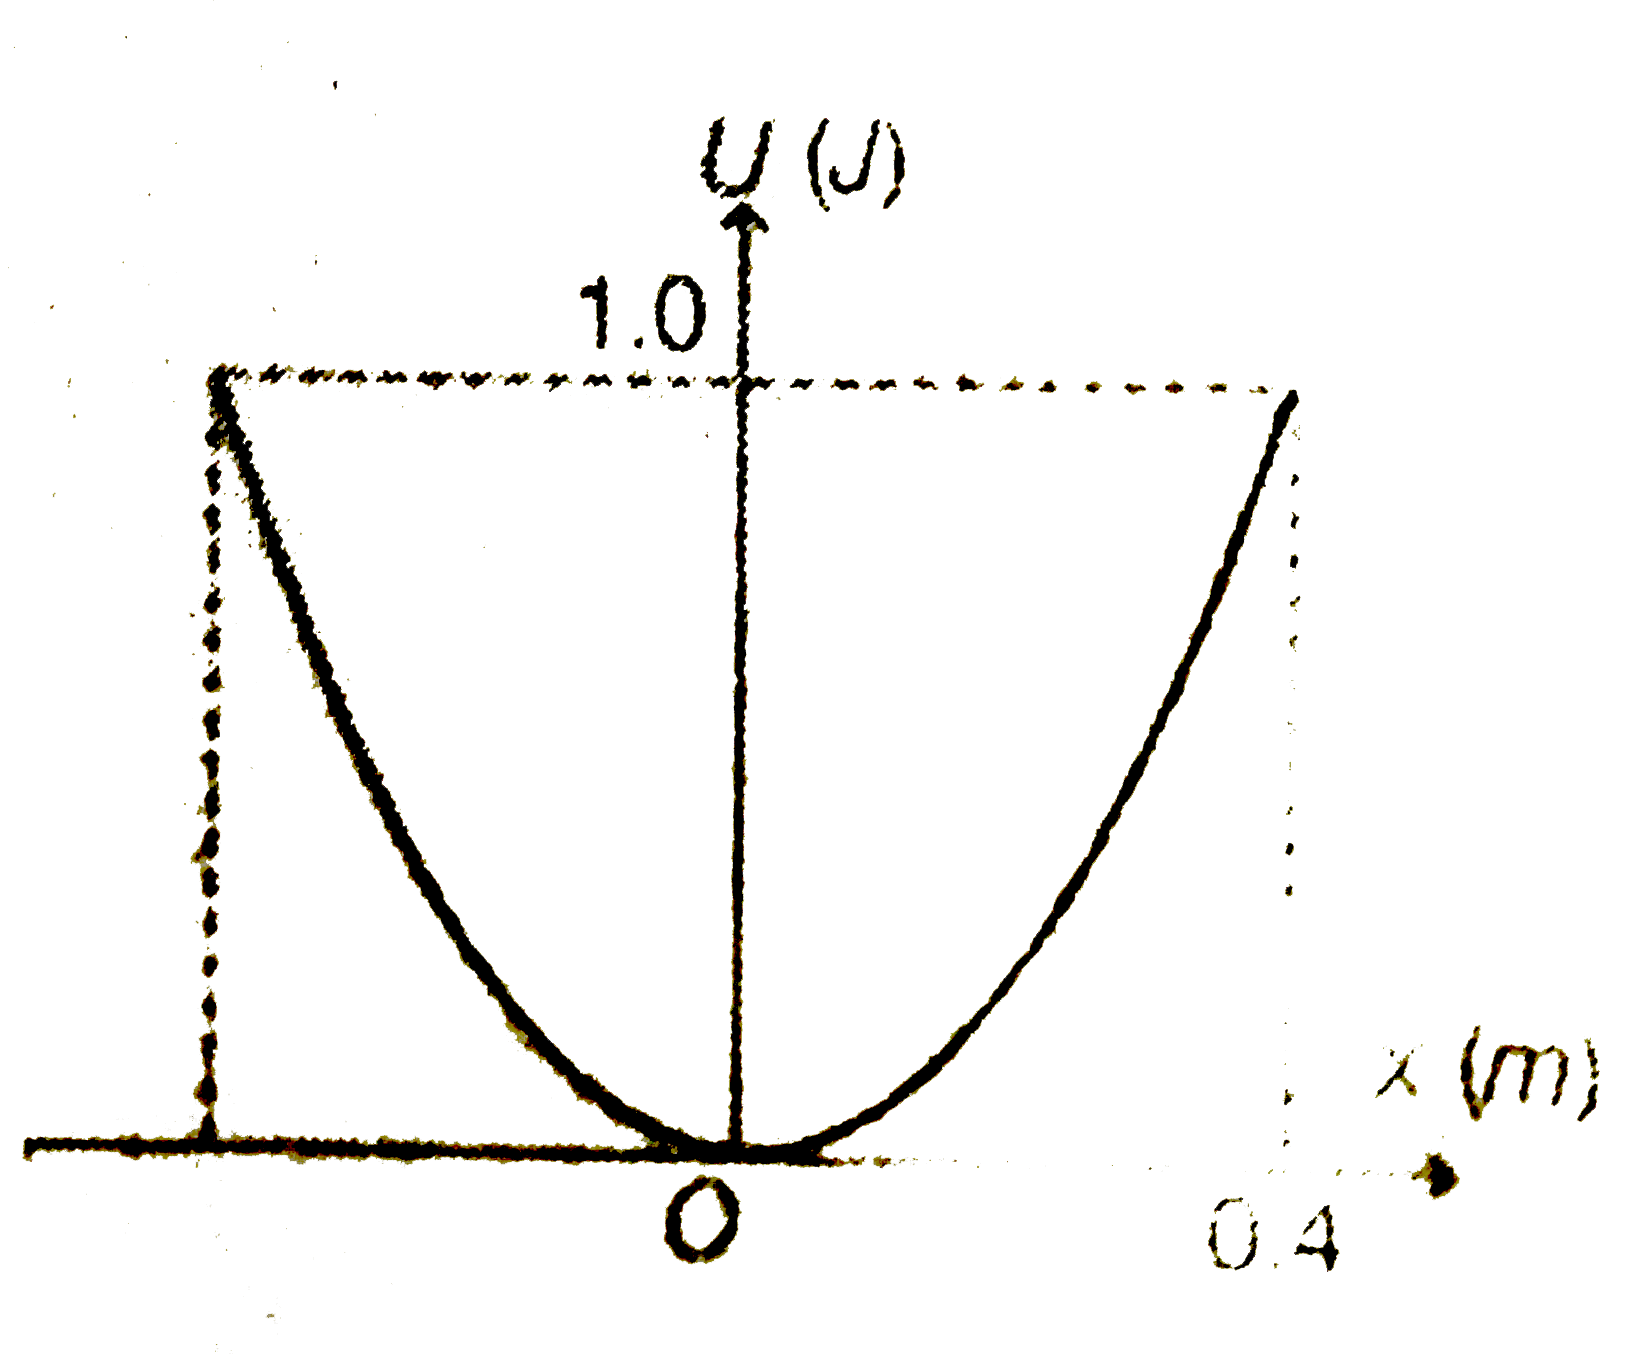
View SolutionA particle of mass 4kg moves simple harmonically such that its PE (U) varies with position x, as shown. The period of oscillations is :-
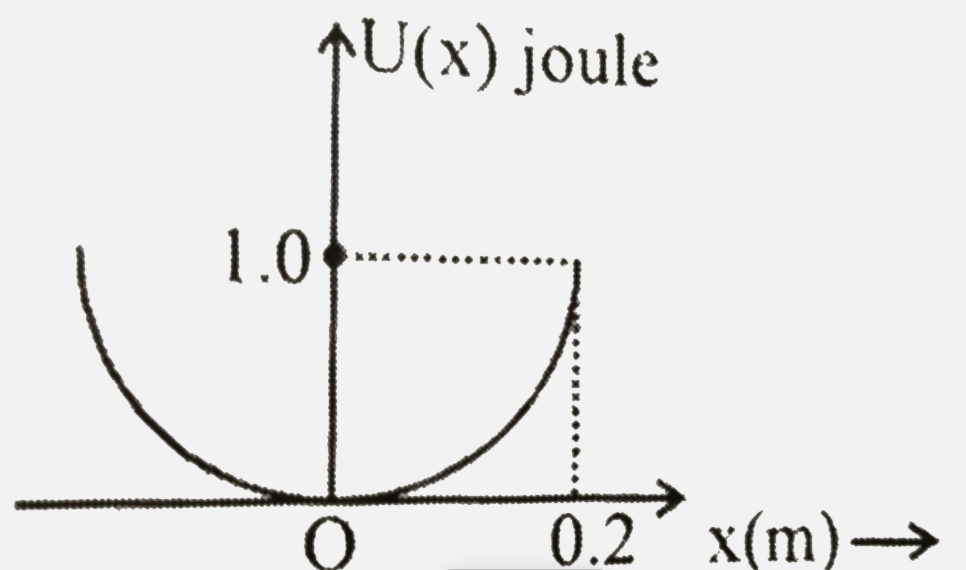
View Solution
