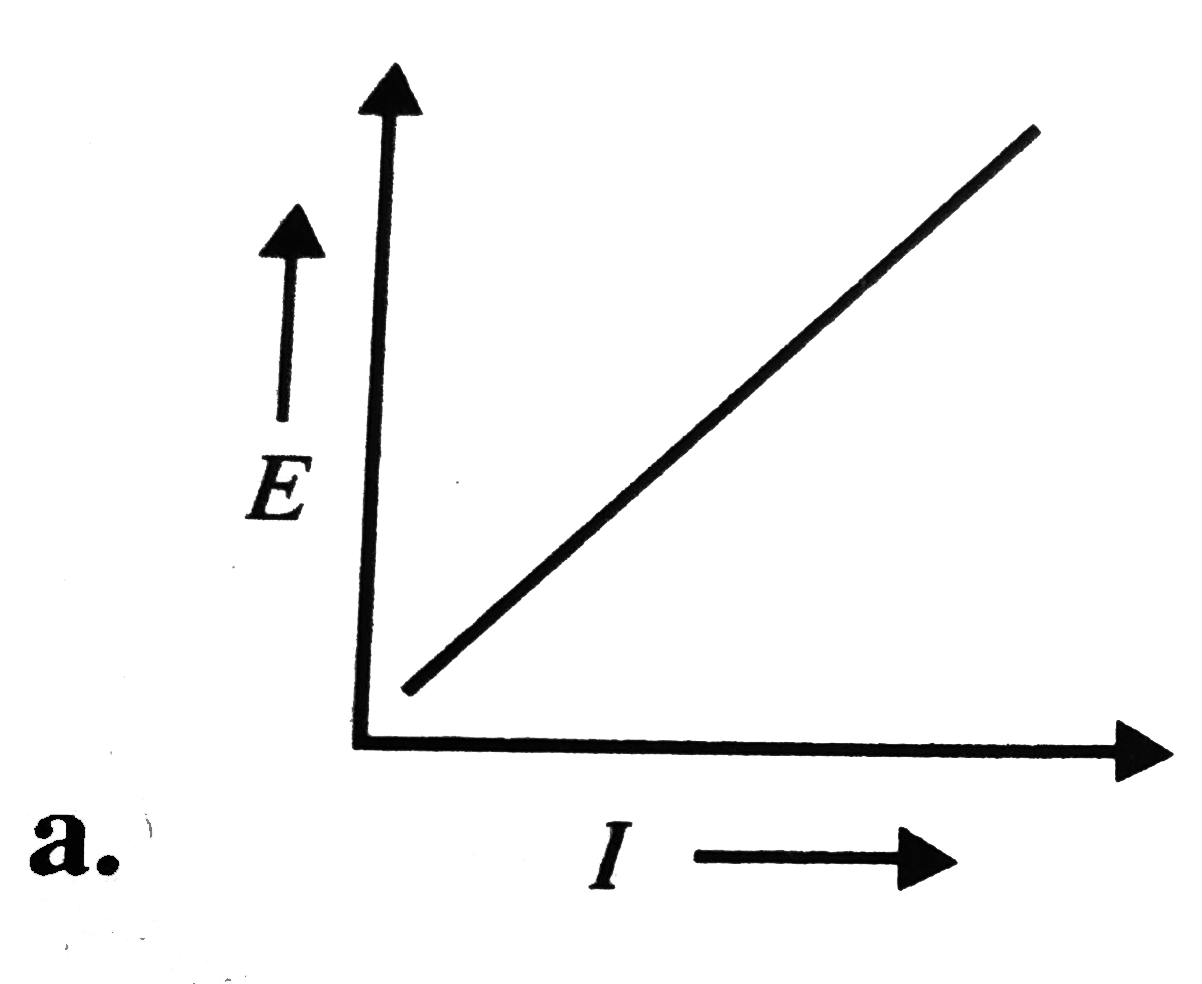
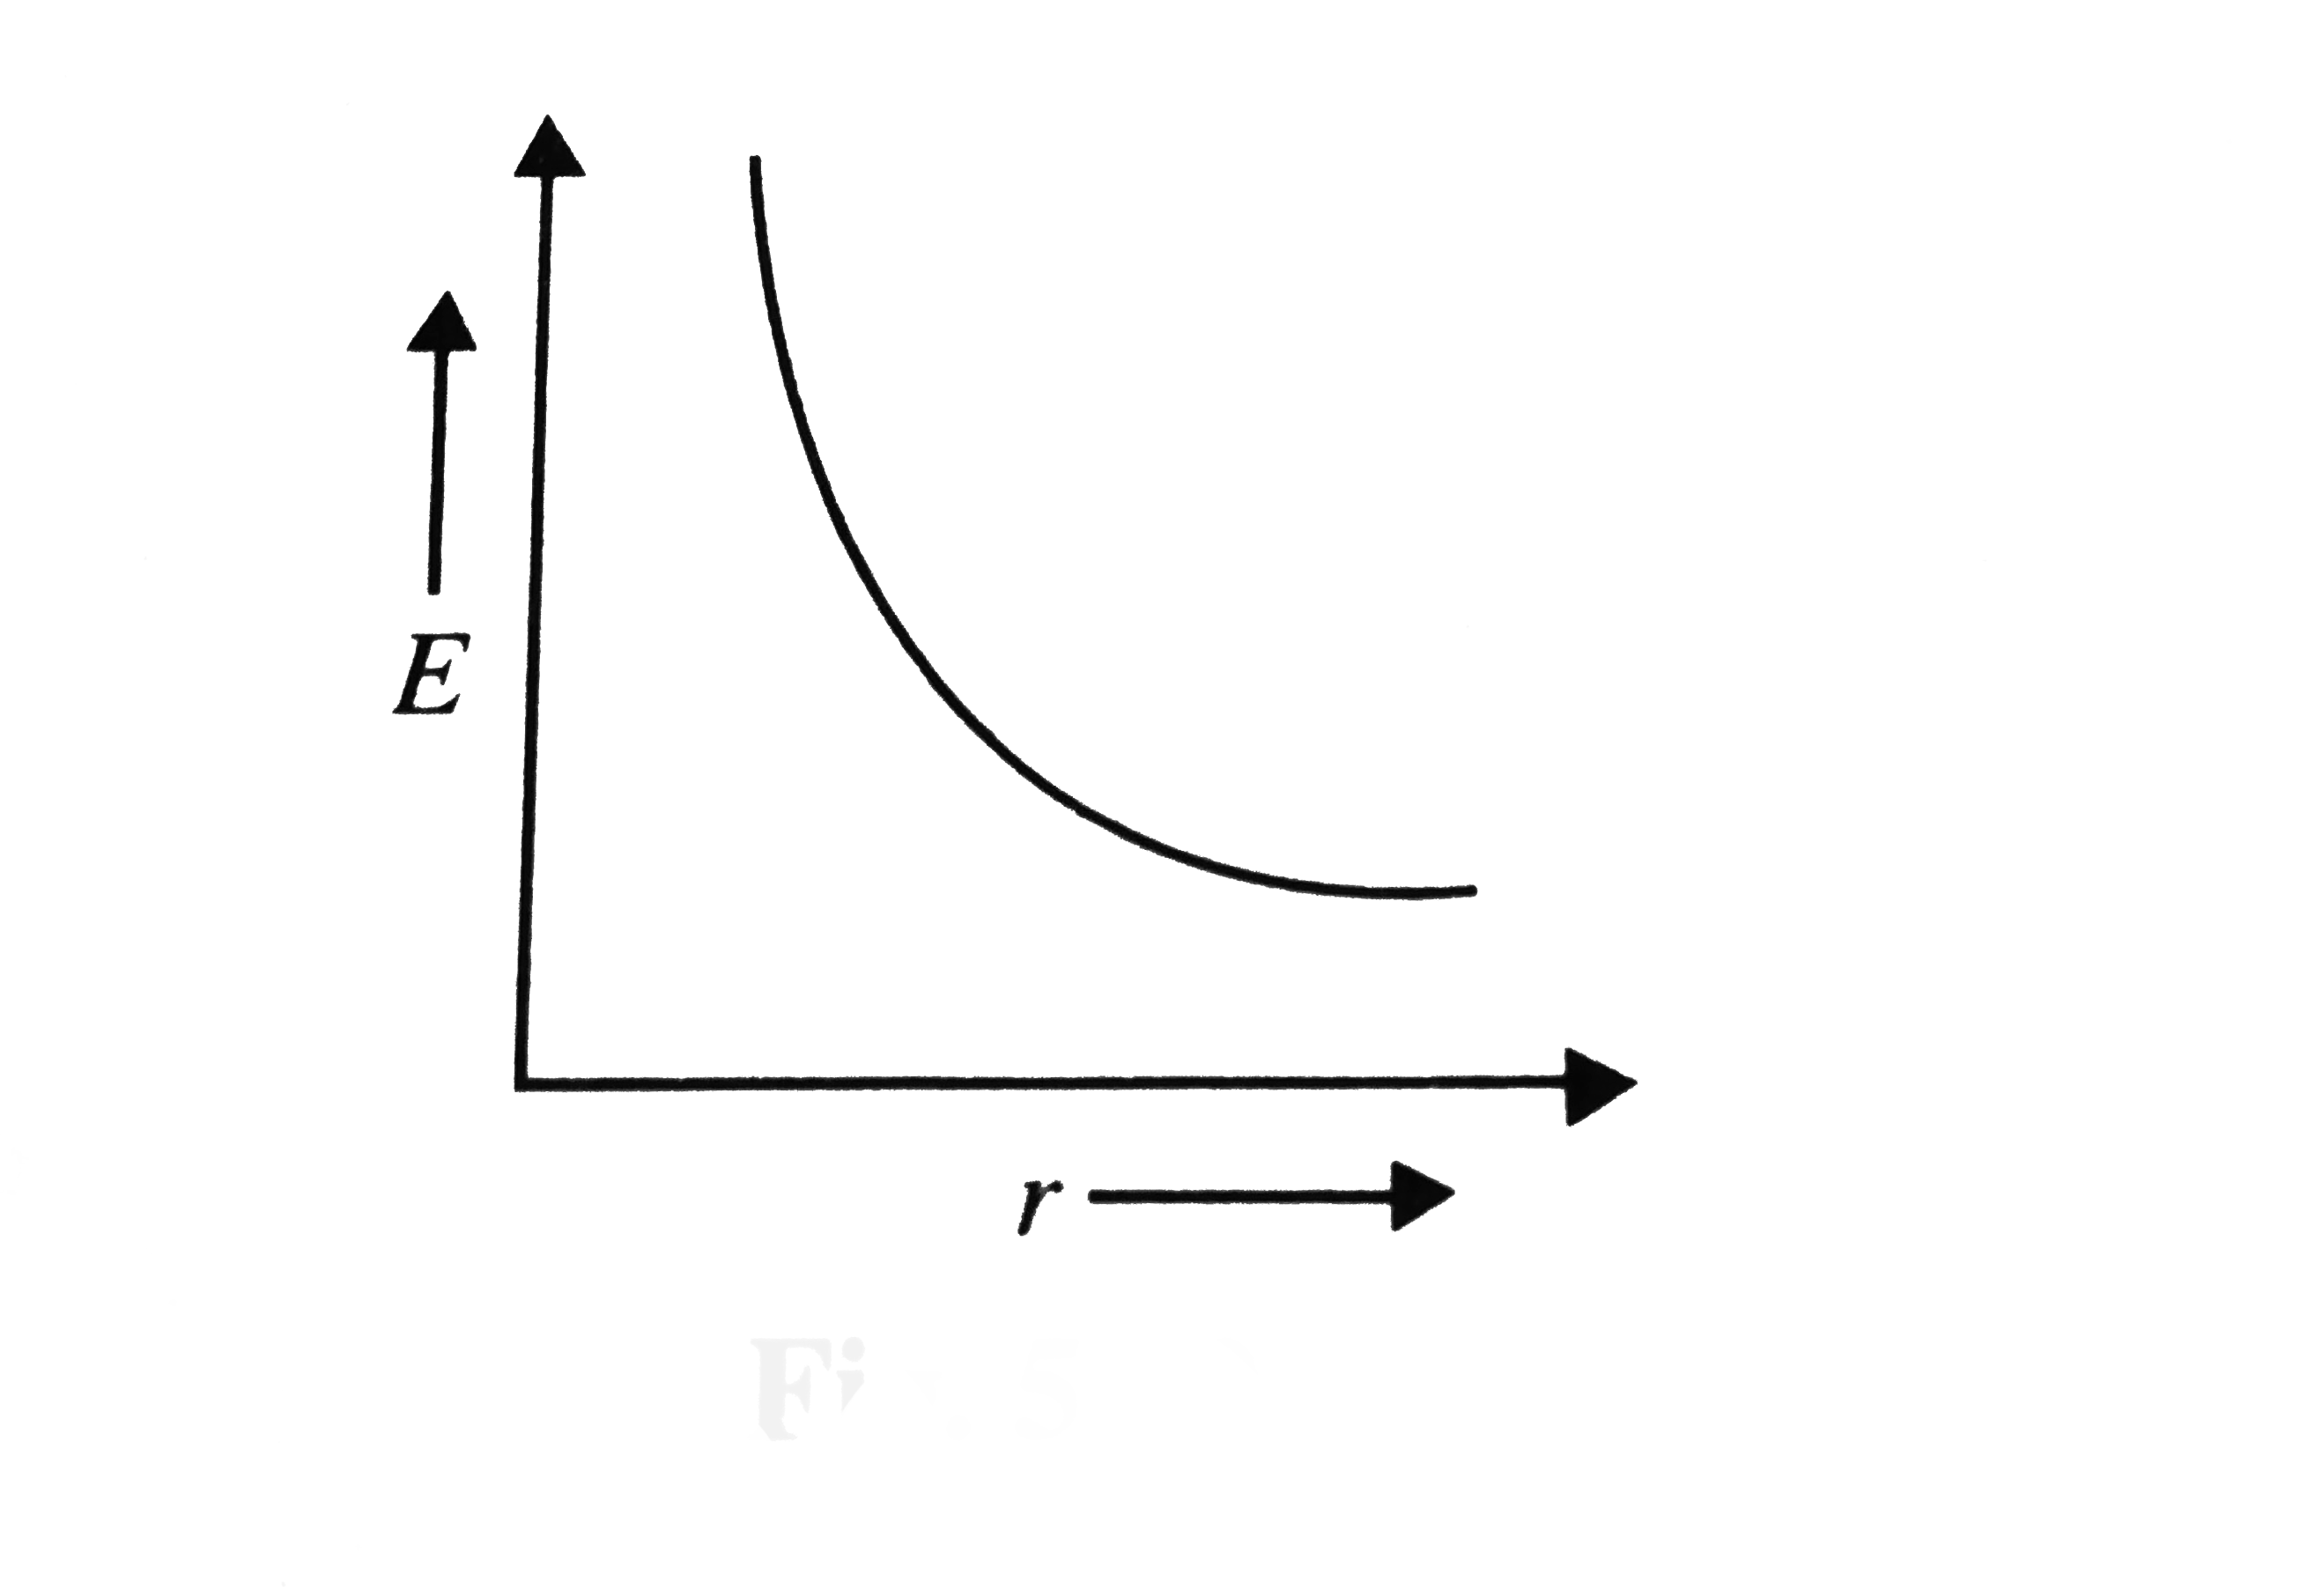
A sonic source, located in a uniform medium, emits waves of frequency n. If intensity, energy density (energy per unit volume of the medium) and maximum speed of oscillations of medium particle are, respectively, I, E and u0 at a point, then which of the following graphs are correct?


The correct Answer is:A, C, D
To solve the problem, we need to analyze the relationships between intensity (I), energy density (E), and maximum speed of oscillations of the medium particles (u₀) for a sonic source emitting waves of frequency n.
1. Understanding Intensity (I):
- Intensity (I) is defined as the energy per unit area per unit time. It can be expressed in terms of energy density (E) and the speed of sound in the medium.
- The relationship can be given as:
I∝E
- This implies that intensity is directly proportional to energy density.
2. Graph of Intensity vs Energy Density:
- Since intensity is proportional to energy density, if we plot intensity (I) on the y-axis and energy density (E) on the x-axis, we will get a straight line passing through the origin.
- Graph: A straight line graph indicating a linear relationship between I and E.
3. Understanding Energy Density (E) and Frequency (n):
- The energy density (E) is related to the frequency (n) of the waves. The relationship can be derived from the formula for intensity:
I=2π2n2A2ρv
- From this, we can express energy density as:
E∝n2
- This indicates that energy density is proportional to the square of the frequency.
4. Graph of Energy Density vs Frequency:
- If we plot energy density (E) on the y-axis and frequency (n) on the x-axis, we will get a parabolic graph that is symmetric about the E-axis.
- Graph: A parabola opening upwards, indicating that as frequency increases, energy density increases quadratically.
5. Understanding Maximum Speed of Oscillation (u₀):
- The maximum speed of oscillation (u₀) is related to the amplitude (A) and frequency (n):
u0=2πnA
- Squaring both sides gives:
E∝u20
- This means energy density is also proportional to the square of the maximum speed of oscillation.
6. Graph of Energy Density vs Maximum Speed of Oscillation:
- If we plot energy density (E) on the y-axis and maximum speed of oscillation (u₀) on the x-axis, we will again get a parabolic graph that is symmetric about the E-axis.
- Graph: A parabola opening upwards, indicating that as the maximum speed of oscillation increases, energy density also increases quadratically.
Summary of Graphs:
- Graph 1: Intensity (I) vs Energy Density (E) - Straight line through the origin.
- Graph 2: Energy Density (E) vs Frequency (n) - Parabola opening upwards.
- Graph 3: Energy Density (E) vs Maximum Speed of Oscillation (u₀) - Parabola opening upwards.
- Intensity (I) is defined as the energy per unit area per unit time. It can be expressed in terms of energy density (E) and the speed of sound in the medium.
- The relationship can be given as:
I∝E
- This implies that intensity is directly proportional to energy density.
- Since intensity is proportional to energy density, if we plot intensity (I) on the y-axis and energy density (E) on the x-axis, we will get a straight line passing through the origin.
- Graph: A straight line graph indicating a linear relationship between I and E.
- The energy density (E) is related to the frequency (n) of the waves. The relationship can be derived from the formula for intensity:
I=2π2n2A2ρv
- From this, we can express energy density as:
E∝n2
- This indicates that energy density is proportional to the square of the frequency.
- If we plot energy density (E) on the y-axis and frequency (n) on the x-axis, we will get a parabolic graph that is symmetric about the E-axis.
- Graph: A parabola opening upwards, indicating that as frequency increases, energy density increases quadratically.
- The maximum speed of oscillation (u₀) is related to the amplitude (A) and frequency (n):
u0=2πnA
- Squaring both sides gives:
E∝u20
- This means energy density is also proportional to the square of the maximum speed of oscillation.
- If we plot energy density (E) on the y-axis and maximum speed of oscillation (u₀) on the x-axis, we will again get a parabolic graph that is symmetric about the E-axis.
- Graph: A parabola opening upwards, indicating that as the maximum speed of oscillation increases, energy density also increases quadratically.
- Graph 1: Intensity (I) vs Energy Density (E) - Straight line through the origin.
- Graph 2: Energy Density (E) vs Frequency (n) - Parabola opening upwards.
- Graph 3: Energy Density (E) vs Maximum Speed of Oscillation (u₀) - Parabola opening upwards.
Topper's Solved these Questions
- SOUND WAVES AND DOPPLER EFFECTBOOK - CENGAGE PHYSICS ENGLISHCHAPTER - SOUND WAVES AND DOPPLER EFFECTEXERCISE - Assertion-Reasoning
24 Videos
- SOUND WAVES AND DOPPLER EFFECTBOOK - CENGAGE PHYSICS ENGLISHCHAPTER - SOUND WAVES AND DOPPLER EFFECTEXERCISE - Comprehension
144 Videos
- SOUND WAVES AND DOPPLER EFFECTBOOK - CENGAGE PHYSICS ENGLISHCHAPTER - SOUND WAVES AND DOPPLER EFFECTEXERCISE - Single Correct
252 Videos
- RIGID BODY DYNAMICS 2BOOK - CENGAGE PHYSICS ENGLISHCHAPTER - RIGID BODY DYNAMICS 2EXERCISE - Interger
2 Videos
- SUPERPOSITION AND STANDING WAVESBOOK - CENGAGE PHYSICS ENGLISHCHAPTER - SUPERPOSITION AND STANDING WAVESEXERCISE - Comprehension Type
5 Videos
Similar Questions
If V and u are electric potential and energy density, respectively, at a distance r from a positive point charge, then which of the following graph is correct ?
View SolutionEnergy density E (energy per unit volume ) of the medium ar a distance r from a sound source varies acording to the curve shown in figure. Which of the following are possible?

View SolutionA particle is projected from a point of an angle with the horizontal. At any instant t, if p is the linear momentum and E the kinetic energy, then which of the following graph is/are correct?
View SolutionAn EM wave from air enters a medium. The electric fields are
→E1=E01ˆxcos[2πv(zc−t)] in air and
→E=E02ˆxcos[k(2z−ct)] in medium, where the wave number k and frequency v refer to their values in air. The medium is non-magnetic. If ∈r1 and ∈r2 refer to relative permittivities of air and medium respectively, which of the following options is correct ?
View SolutionWhich of the following options is representing average energy per unit volume of a travelling wave? (Where rho is density, omega is angular frequency, A is amplitude)
View SolutionA source of sound emits sound waves at frequency f0. It is moving towards an observer with fixed speed vs(vs<v where v is the speed in air). If the observer were to move towards the source with speed v0 one of the following two graphs (A and B) will give the correct variation of the frequency f heard by the observer as v0 is changed,
_E01_169_Q01.png)
The variation of f with v0 is given correctly by :-
View SolutionA conductor of length L is placed along the x - axis , with one of its ends at x = 0 and the other at x = L. If the rate of flow of heat energy through the conduct is constant and its thermal resistance per unit length is also constant , then Which of the following graphs is/are correct ?
View Solution(A ): Speed of EM wave in a medium depends on electrical permittivity and magnetic permeability of the medium (R) E.M wave transport energy in the form of oscillating electric and magnetic fields
View SolutionA tuning fork of frequency 440 Hz is attached to a long string of linear mass density 0.01kgm−1 kept under a tension of 49 N. The fork produces transverse waves of amplitude 0.50 mm on the string. (a) Find the wave speed and the wavelength of the waves. (b) Find the maximum speed and acceleration of a particle of the string. (c) At what average rate is the tuning fork transmitting energy to the string ?
View SolutionA block M hangs vertically at the bottom end of a uniform rope of constant mass per unit length. The top end of the rope is attached to a fixed rigid support at O. A transverse wave pulse (Pulse 1) of wavelength λ0 is produced at point O on the rope. The pulse takes time TOA to reach point A. If the wave pulse of wavelength λ0 is produced at point A (Pulse 2) without disturbing the position of M it takes time TAO to reach point O. Which of the following options is/are correct?

View Solution
