A conductor of length L is placed along the x - axis , with one of its ends at x = 0 and the other at x = L. If the rate of flow of heat energy through the conduct is constant and its thermal resistance per unit length is also constant , then Which of the following graphs is/are correct ?
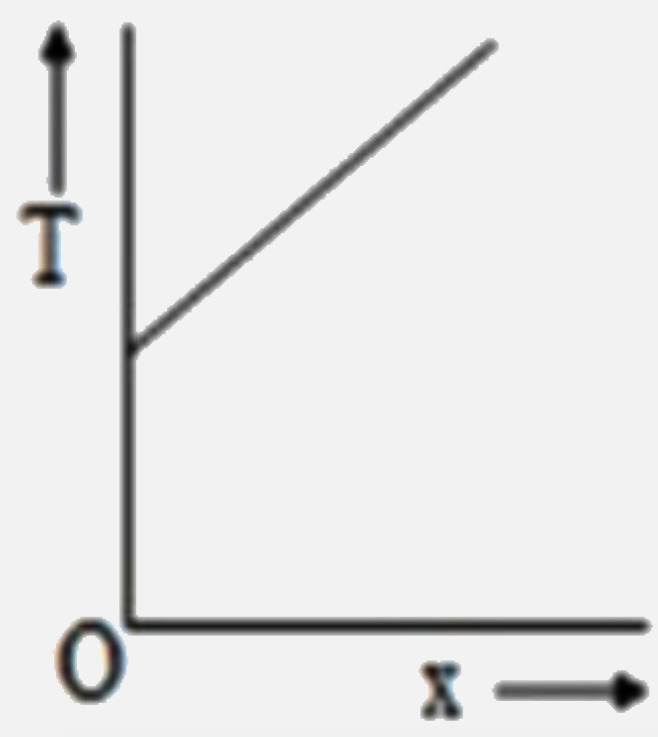
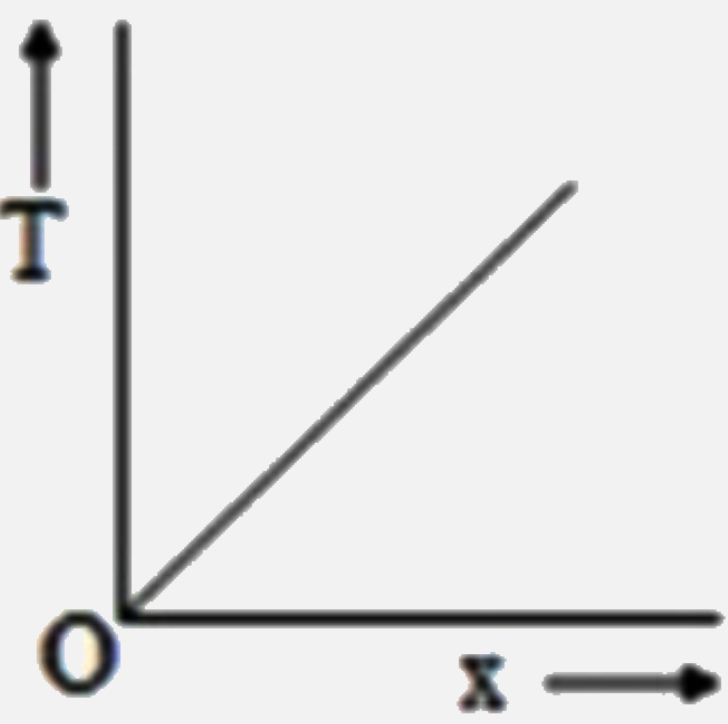
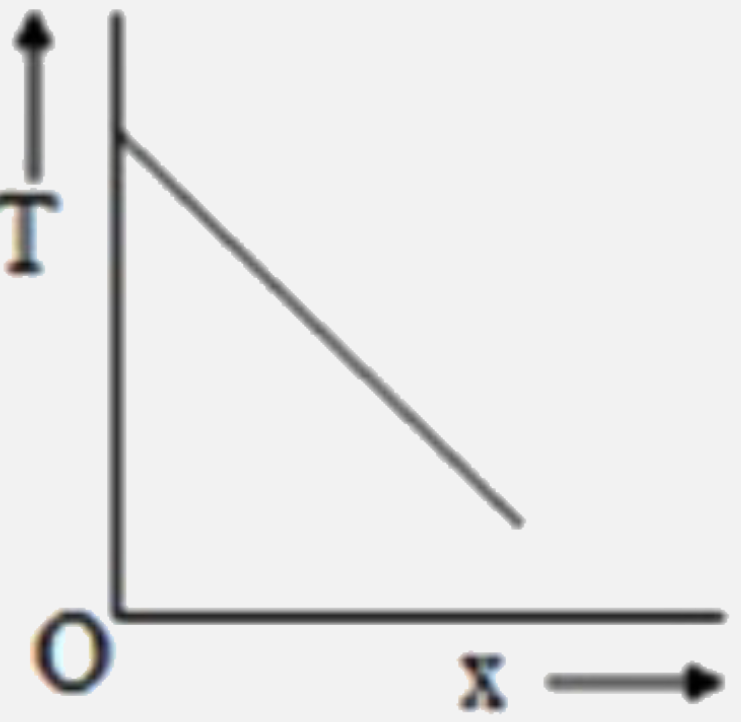
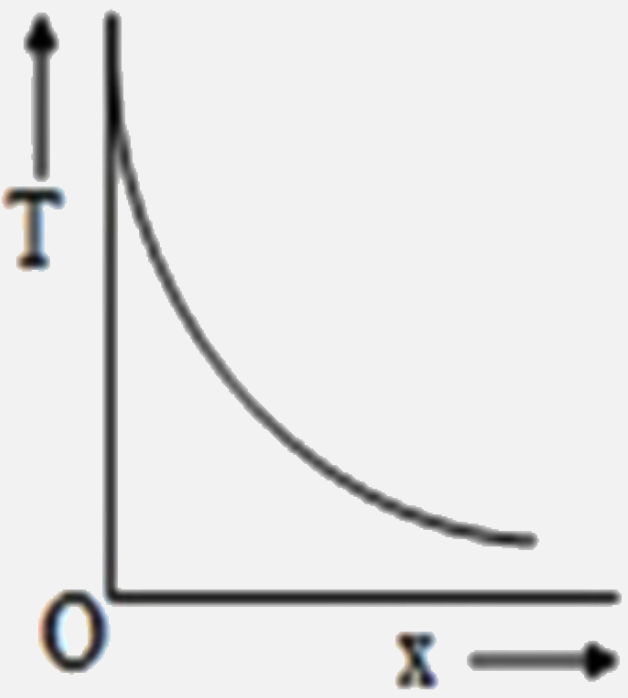
The correct Answer is:C
To solve the problem, we need to analyze the situation of heat transfer through a conductor and how it relates to temperature distribution along the length of the conductor.
1. Understanding the Setup:
- We have a conductor of length L placed along the x-axis, with one end at x=0 and the other at x=L.
- The rate of heat flow (H) through the conductor is constant, and the thermal resistance per unit length is also constant.
2. Heat Transfer Equation:
- The rate of heat transfer H can be expressed using Fourier's law of heat conduction:
H=KAdTdx
where:
- K is the thermal conductivity,
- A is the cross-sectional area,
- dTdx is the temperature gradient.
3. Constant Thermal Resistance:
- The thermal resistance R of the conductor can be defined as:
R=LKA
- Given that the thermal resistance per unit length is constant, it implies that KA is also constant.
4. Finding the Temperature Gradient:
- Since H is constant and KA is constant, it follows that dTdx must also be constant.
- Therefore, we can express this as:
dTdx=−constant
- The negative sign indicates that as x increases, the temperature T decreases.
5. Graphical Representation:
- The relationship dTdx=−constant implies that the temperature T decreases linearly with x.
- This results in a straight line graph with a negative slope.
6. Conclusion:
- The correct graph representing the temperature distribution along the conductor will show a straight line with a negative slope, indicating a linear decrease in temperature from T(0) at x=0 to T(L) at x=L.
- We have a conductor of length L placed along the x-axis, with one end at x=0 and the other at x=L.
- The rate of heat flow (H) through the conductor is constant, and the thermal resistance per unit length is also constant.
- The rate of heat transfer H can be expressed using Fourier's law of heat conduction:
H=KAdTdx
where:
- K is the thermal conductivity,
- A is the cross-sectional area,
- dTdx is the temperature gradient.
- The thermal resistance R of the conductor can be defined as:
R=LKA
- Given that the thermal resistance per unit length is constant, it implies that KA is also constant.
- Since H is constant and KA is constant, it follows that dTdx must also be constant.
- Therefore, we can express this as:
dTdx=−constant
- The negative sign indicates that as x increases, the temperature T decreases.
- The relationship dTdx=−constant implies that the temperature T decreases linearly with x.
- This results in a straight line graph with a negative slope.
- The correct graph representing the temperature distribution along the conductor will show a straight line with a negative slope, indicating a linear decrease in temperature from T(0) at x=0 to T(L) at x=L.
Similar Questions
When a steel wire fixed at one end is pulled by a constant force F at its other end , its length increases by l.Which of the following statements is not correct?
View SolutionA straight rod of length L has one of its end at the origin and the other at X=L. If the mass per unit length of the rod is given by Ax where A is constant, where is its centre of mass?
View SolutionA straight rod of length L has one of its end at the origin and the other at X=L. If the mass per unit length of the rod is given by Ax where A is constant, where is its centre of mass?
View SolutionA straight rod of length L has one of its end at the origin and the other at X=L. If the mass per unit length of the rod is given by Ax where A is constant, where is its centre of mass?
View SolutionA thin rod of length L is lying along the x-axis with its ends at x=0 and x=L its linear (mass/length) varies with x as k(xL)n, where n can be zero of any positive number. If to position xCM of the centre of mass of the rod is plotted against 'n', which of the following graphs best apporximates the dependence of xCM on n?
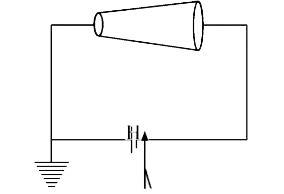
View SolutionA conductor is made of an isotropic material and has shape of a truncated cone. A battery of constant emf is connected across it and its left end is earthed as shown. If at a certain section at a distance x form left end, electric field intensity and the rate of generation of heat per unit length are E and H respectively, which of the following graphs is (are) correct?
View SolutionA rod of length 'l' is placed along x-axis. One of its ends is at the origin. The rod has a non-uniform charge density λ= a, a being a positive constant. Electric potential at P as shown in the figure is -

View SolutionA rod of length l is placed along x - axis. One of its ends is at the origin. The rod has a non - uniform charge density λ=ax, a being a positive constant. The electric potential at the point P (origin) as shown in the figure is

View SolutionA rod length L and mass M is placed along the x-axis with one end at the origin, as shown in the figure above. The rod has linear mass density λ=2ML2x, where x is the distance from the origin. Which of the following gives the x-coordinate of the rod's center of mass?

View SolutionTwo conductors made of the same material have lengths L and 2L but have equal resistance. The two are connected in series in a circuit which current is flowing. Which of the following is/are correct?
View Solution
