A sound source S is moving along a straight track with speed v, and is emitting sound of frequency v0 (see figure). An observer is standing at a finite distance at the point O, from the track . The time variation of frequency heard by the observer is best respresent by :
(t0 represents the instant when the distance between the source and observer is minimum )


To solve the problem, we need to analyze the situation using the Doppler effect, which describes how the frequency of a wave changes for an observer moving relative to the source of the wave.
1. Understanding the Setup:
- We have a sound source S moving with speed v along a straight track.
- The source emits sound of frequency ν0.
- An observer is located at point O, at a finite distance from the track.
2. Identifying the Critical Point:
- The time t0 is defined as the instant when the distance between the source S and the observer O is at a minimum. This is when the source is closest to the observer.
3. Applying the Doppler Effect:
- When the source is moving towards the observer, the frequency heard by the observer increases. The formula for the observed frequency f′ when the source is approaching is given by:
f′=vv−vsν0
where vs is the speed of the source.
4. Behavior as the Source Approaches:
- As the source approaches the observer, the frequency increases. This occurs until the source reaches the point closest to the observer (at t0).
5. Behavior as the Source Moves Away:
- After passing the observer, the source starts moving away. The frequency heard by the observer now decreases. The formula for the observed frequency when the source is moving away is:
f′=vv+vsν0
- Here, the frequency decreases as the source moves away from the observer.
6. Graphing Frequency vs. Time:
- We can plot the frequency f′ on the y-axis against time on the x-axis.
- As the source approaches, the frequency increases until it reaches a maximum at t0.
- After t0, as the source moves away, the frequency decreases.
7. Conclusion:
- The graph of frequency vs. time will show an increase in frequency as the source approaches, peaking at t0, and then a decrease in frequency as the source moves away.
Final Representation:
The time variation of frequency heard by the observer can be represented as a graph that rises to a peak at t0 and then falls, indicating the change in frequency due to the Doppler effect.
---
- We have a sound source S moving with speed v along a straight track.
- The source emits sound of frequency ν0.
- An observer is located at point O, at a finite distance from the track.
- The time t0 is defined as the instant when the distance between the source S and the observer O is at a minimum. This is when the source is closest to the observer.
- When the source is moving towards the observer, the frequency heard by the observer increases. The formula for the observed frequency f′ when the source is approaching is given by:
f′=vv−vsν0
where vs is the speed of the source.
- As the source approaches the observer, the frequency increases. This occurs until the source reaches the point closest to the observer (at t0).
- After passing the observer, the source starts moving away. The frequency heard by the observer now decreases. The formula for the observed frequency when the source is moving away is:
f′=vv+vsν0
- Here, the frequency decreases as the source moves away from the observer.
- We can plot the frequency f′ on the y-axis against time on the x-axis.
- As the source approaches, the frequency increases until it reaches a maximum at t0.
- After t0, as the source moves away, the frequency decreases.
- The graph of frequency vs. time will show an increase in frequency as the source approaches, peaking at t0, and then a decrease in frequency as the source moves away.
The time variation of frequency heard by the observer can be represented as a graph that rises to a peak at t0 and then falls, indicating the change in frequency due to the Doppler effect.
Topper's Solved these Questions
Similar Questions
A source emitting sound of frequency 1000 Hz is moving towards an observer at speed vs=0.90v, (where v is the velocity of sound). What frequency III will be heard by the observer ?
View SolutionA source emitting sound of frequency 1000 Hz is moving towards an observer at speed vs=0.90v,(where v is the velocity of sound) . What frequency will be heard by the observer ?
View Solution
Knowledge Check
A source of frequency 'f' is stationary and an obsercer starts moving towards it at t=0 with constant small acceleration. Then the variation of observed frequency 'f' registered by the observer with time is best represented as
A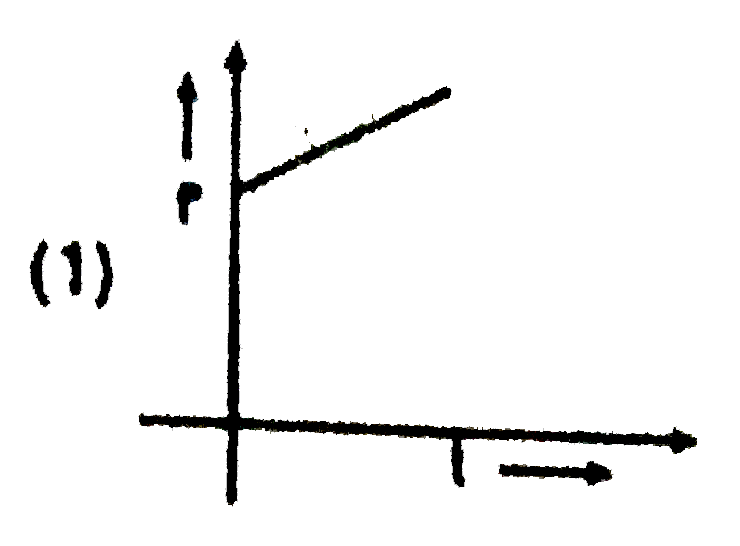 B
B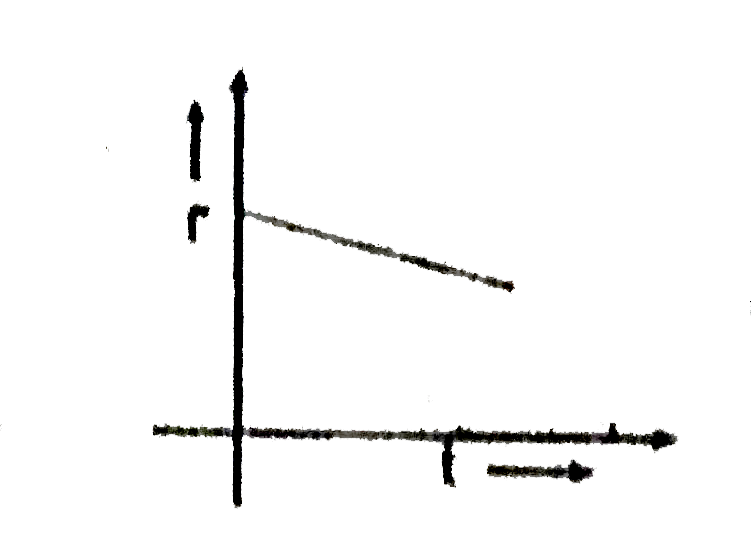 C
C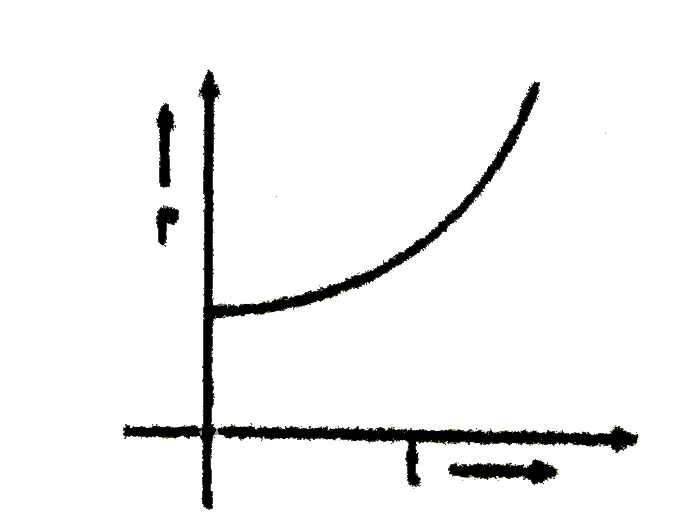 D
D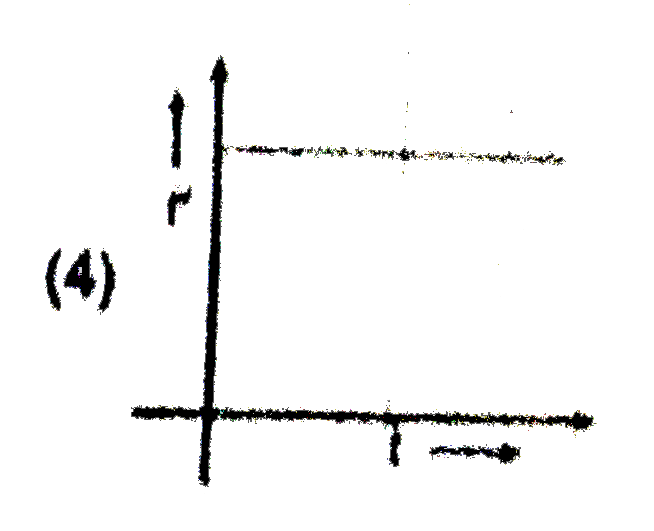
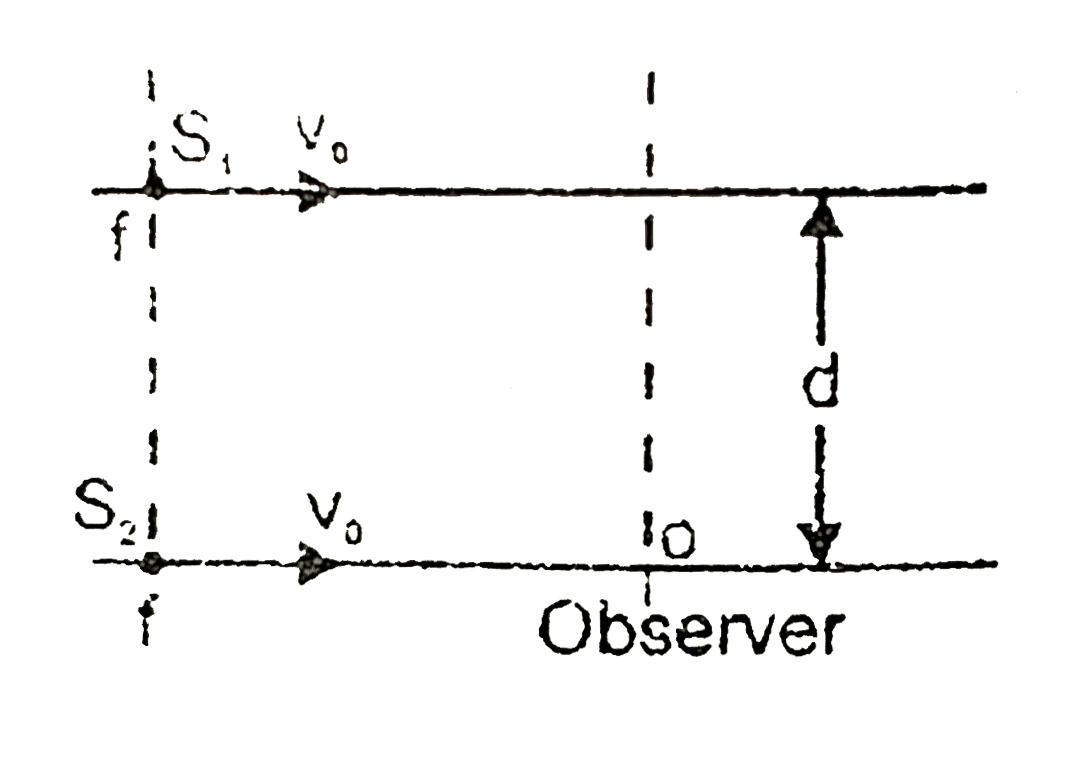
Two identical source moving parallel to each other at seperation 'd' are producing sounds of frequency 'f' and are moving with constant velocity v0. A stationary .observer 'O' is on the line of motion of one of the sources. Then the variation of beat frequency heard by O with time is best represented by: (as they come from large distance and go to a large distance)
 A
A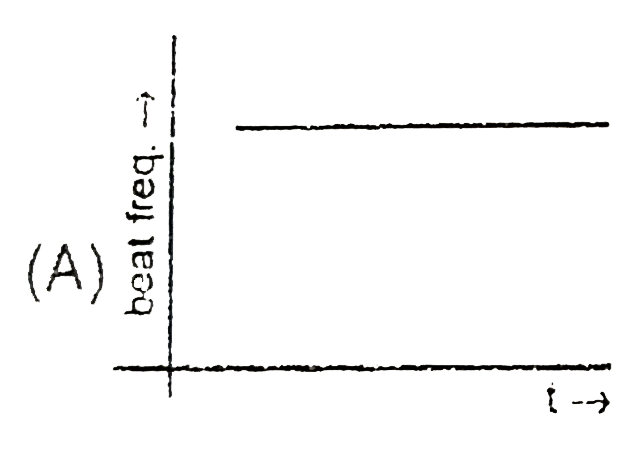 B
B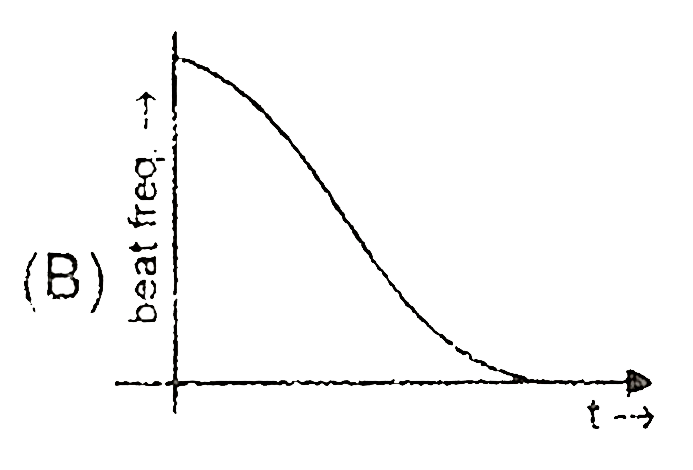 C
C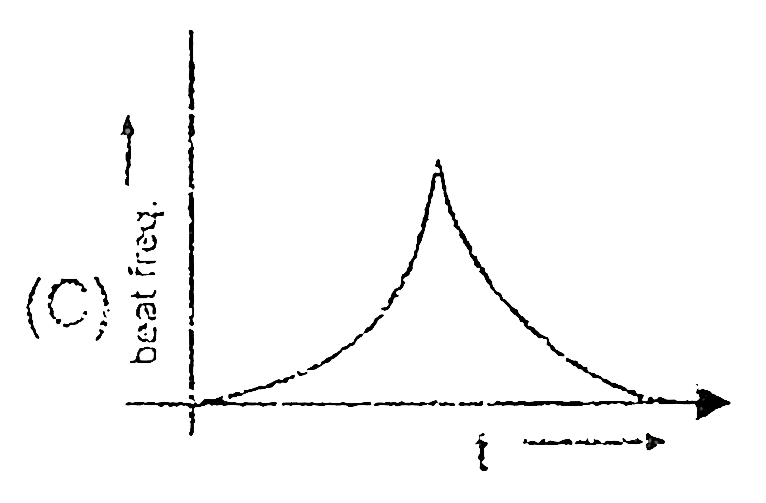 D
D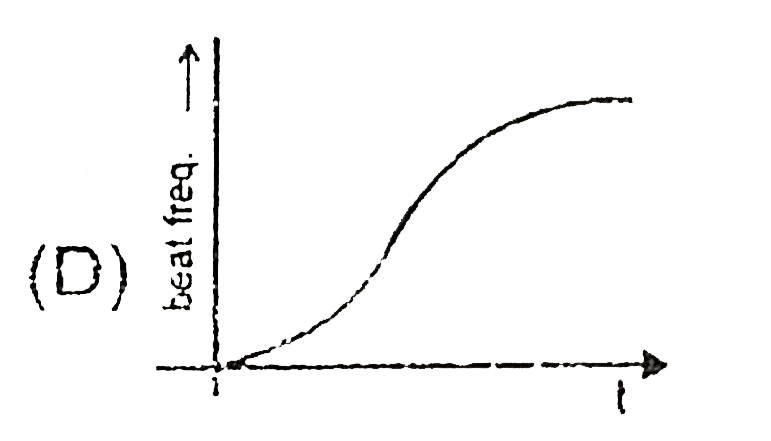
The source of sound generating a frequency of 3 kH z reaches an observer with a speed of 0.5 times the velocity of sound in air. The frequency heard by the observer is
A1 kHzB2 kHzC4 kHzD6 kHz
A source emitting a sound of frequency v is placed at a large distance from an observer. The source starts moving towards the observer with a uniform acceleration a. Find the frequency heard by the observer corresponding to the wave emitted just after the source starts. The speed of sound in the medium is v.
View SolutionA source of sound with natural frequency v0 moves uniformly along a straight line separated from a stationary observer by a distance l . The velocity of the source is equal to η fraction of velocityof sound. Find the frequency of sound received by the observer at the moment when the source gets closest to him and also find the distance between the source and the observer at the moment, when the observer receives a frequency v=v0
View SolutionA car moves towards a hill with speed vc .It blows a horn of frequency f which is heard by an observer following the car with speed s.The speed of sound in air is v. find frequency heard by the observer.
View SolutionA source of sound of frequency 500 Hz is moving towards a stationary observer with velocity 30m/s. The speed of sound is 330m/s. The frequency heard by the observer will be :
View SolutionA source emitting a sound of frequency 'f' is placed at a large distacnce from an observer. The source starts moving towards the oberver with a uniform acceleration 'a'. Find frequency heard by the observer corresponding to the wave emitted just after the source starts. The speed of sound in medium is v
View Solution
