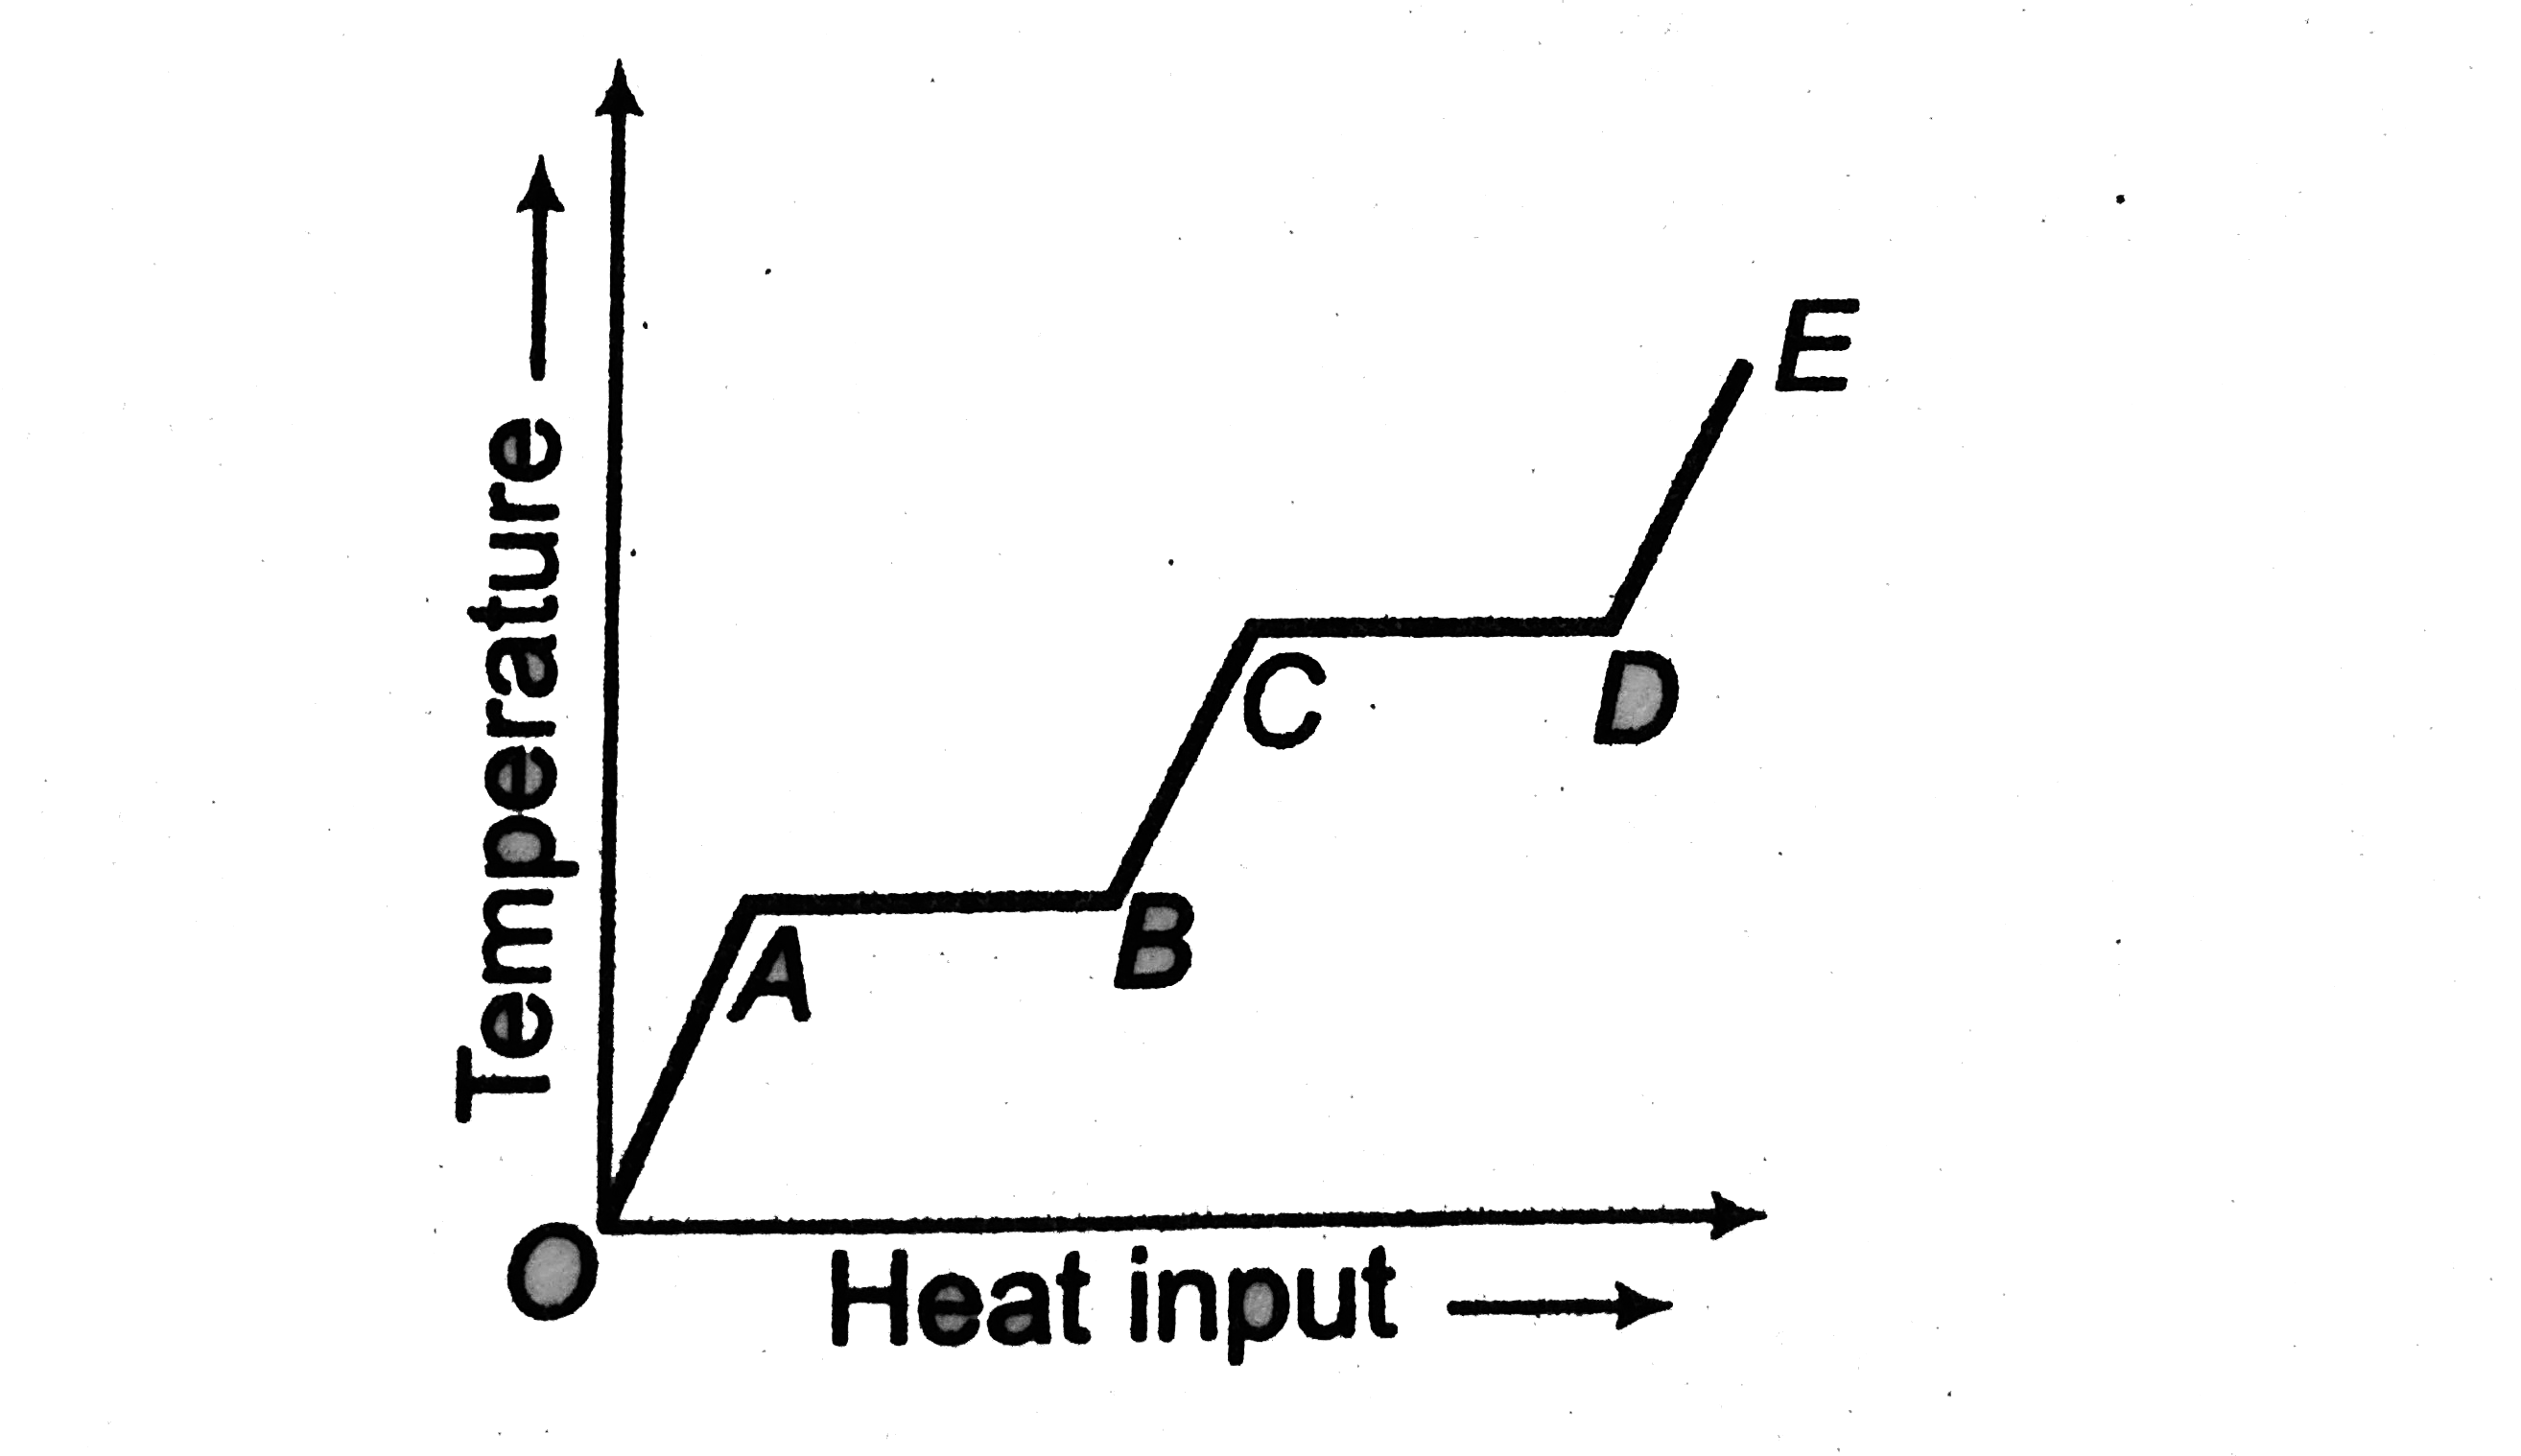
A source of heat supplies heat at constant rate to a solid cube. The variatiion of the temperature of the cube with heat supplied is shown in figure. The portion DE of the graph represents conversion of

Solid into liquid
Liquid into vapour
Solid into vapour
Vapour into liquid
Step by step video & image solution for A source of heat supplies heat at constant rate to a solid cube. The variatiion of the temperature of the cube with heat supplied is shown in figure. The portion DE of the graph represents conversion of by Physics experts to help you in doubts & scoring excellent marks in Class 12 exams.
Updated on:21/07/2023Topper's Solved these Questions
- HEAT AND THERMAL EXPANSIONBOOK - PHYSICS GALAXY - ASHISH ARORACHAPTER - HEAT AND THERMAL EXPANSIONEXERCISE - NUMERICAL MCQs SINGLE OPTIONS CORRECT
81 Videos
- HEAT AND THERMAL EXPANSIONBOOK - PHYSICS GALAXY - ASHISH ARORACHAPTER - HEAT AND THERMAL EXPANSIONEXERCISE - ADVANCE MCQs WITH ONE OR MORE OPTIONIS CORRECT
24 Videos
- HEAT AND THERMAL EXPANSIONBOOK - PHYSICS GALAXY - ASHISH ARORACHAPTER - HEAT AND THERMAL EXPANSIONEXERCISE - DISCUSSION QUESTION
24 Videos
- GEOMETRICAL OPTICSBOOK - PHYSICS GALAXY - ASHISH ARORACHAPTER - GEOMETRICAL OPTICSEXERCISE - Unsolved Numerical Problems
107 Videos
- HEAT TRANSFER BOOK - PHYSICS GALAXY - ASHISH ARORACHAPTER - HEAT TRANSFER EXERCISE - Unsolved Numerical Problems for Preparation of NSEP,INPhO&IPhO
66 Videos
Similar Questions
Knowledge Check
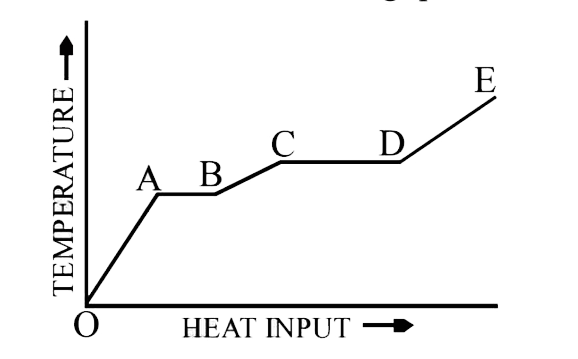
A solid material is supplied heat at a constant rate. The temperature of material is changing with heat input as shown in the figure. What does the slope of DE represent ?
 ALatent heat of liquidBLatent heat of vaporizationCHeat capacity of vapourDInverse of heat capacity of vapour
A gas is heated at a constant pressure. The fraction of heat supplied used of external work is
A1γB(1−1γ)Cγ−1D(1−1γ2)Heat supplied to a gas at constant volume is utilised to
Aincrease the internal energy of the gasBto do external work done against external pressureCether 'a' or 'b'Dboth 'a' and 'b'
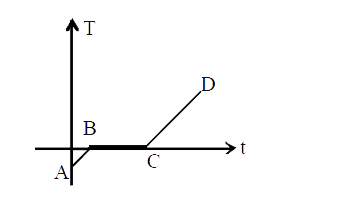
In the above problem if heat is supplied at a constant rate of q=10cal/min, then plot temperature versus time graph.
View SolutionA solid material is supplied with heat at a constant rate. The temperature of the material is changing with the heat input as shown in the graph in figure. Study the graph carefully and answer the following questions:

(i) What do the horizontal regions AB and CD represent?
If CD is equal to 2AB, what do you infer?
What does the slope of DE represents?
The slope of OAgtthe slope of BC. What does this indicate?
View SolutionHeat is supplied to a diatomic gas at constant pressure. The ratio of ΔQ:ΔU:ΔW is :
View SolutionHeat is supplied to a diatomic gas which expands at constant pressure. The % of change in internal energy to heat supplied is
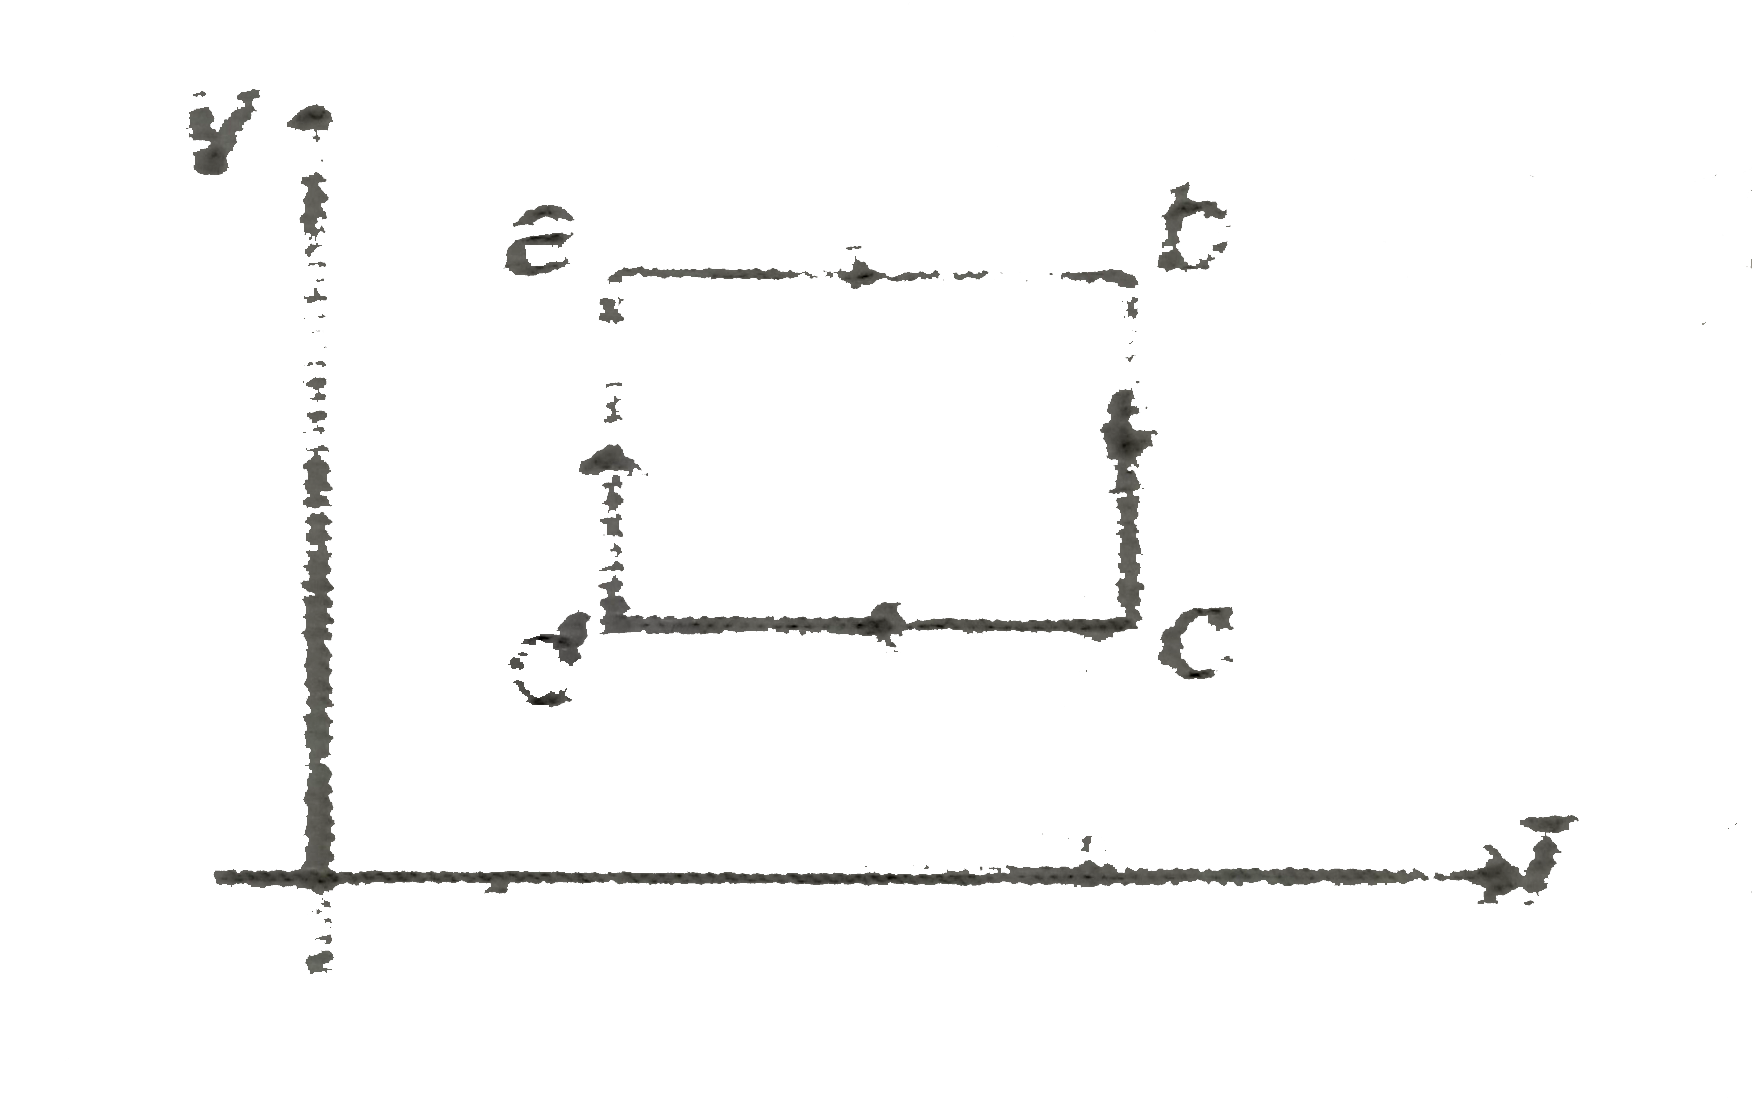
View Solutiongraph of an ideal gas is as shown in figure.

Heat is supplied to the gas in process (s).
View Solution

