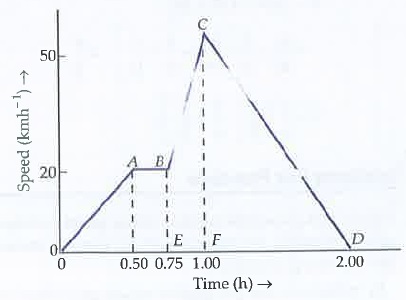
A train moves from one station to another in two hours time. Its speed during the motion is shown in the graph Calculate
(i) Maximum acceleration during the journey.
(ii) Distance covered during the time interval from 0.75 hour to 1 hour
140kmhr
60kmhr
100kmhr
120kmhr
The correct Answer is:B
Step by step video, text & image solution for A train moves from one station to another in two hours time. Its speed during the motion is shown in the graph Calculate (i) Maximum acceleration during the journey. (ii) Distance covered during the time interval from 0.75 hour to 1 hour by Physics experts to help you in doubts & scoring excellent marks in Class 11 exams.
Updated on:21/07/2023Topper's Solved these Questions
- MOTION IN ONE DIMENSIONBOOK - ERRORLESS CHAPTER - MOTION IN ONE DIMENSIONEXERCISE - Assertion & Reason
30 Videos
- MOTION IN ONE DIMENSIONBOOK - ERRORLESS CHAPTER - MOTION IN ONE DIMENSIONEXERCISE - Motion In One Dimension
24 Videos
- MOTION IN ONE DIMENSIONBOOK - ERRORLESS CHAPTER - MOTION IN ONE DIMENSIONEXERCISE - Critical Thinking
19 Videos
- GRAVITATIONBOOK - ERRORLESS CHAPTER - GRAVITATIONEXERCISE - SET
27 Videos
- MOTION IN TWO DIMENSIONBOOK - ERRORLESS CHAPTER - MOTION IN TWO DIMENSIONEXERCISE - Exercise
319 Videos
Similar Questions
A train moves from one station to another in 2 hours time. Its speed-time graph during this motion is shown in the figure. The maximum acceleration during the journey is
View SolutionA train moves from one station to another in two hours' time. Its speed-time graph during the motionis shown in Fig. 3.59 : calculate the distance covered during the time interval from 0.75 hour to 1 hour.
View Solution
Knowledge Check
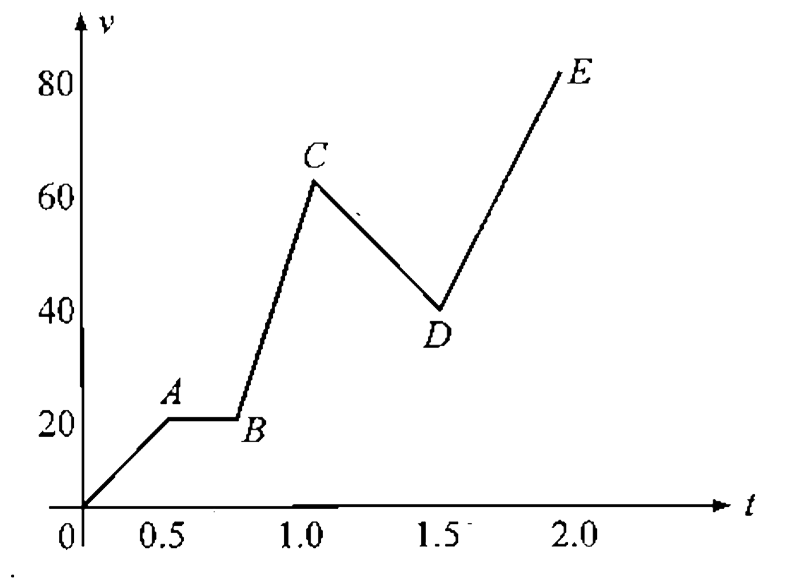
The variation in the speed of a car during its two hour journey is shown in the graph of the figure-1.106. The magnitude of the maximum acceleration of the car occupies an interval of:
 AOABBCCCDDDE
A bus travels for a certain time .Its speed during the first half time is v1 and that during the second half time is v2 . The average speed during the whole journey is :
A√v1v2B2v1v2v1+v2Cv1+v22D2v1+v2A steamer goes downstream from one port to another in 4 hours. It covers the same distance upstream in 5 hours. If the speed of stream is 2 km/ hr, the distance between the two ports is
A50 kmB60 kmC70 kmD80 km
The plot of speed for the journey of a bus from one bus stop to another is shown below.
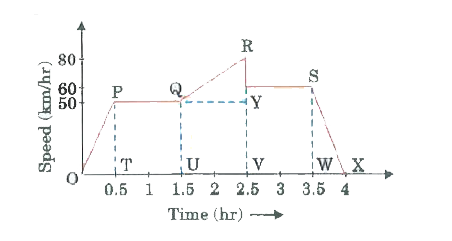
(i) Find the maximum acceleration for deceleration of the bus during the journey
(ii) Calculate the distance covered by the bus from 0.5 hr to 2.5 hr.
View SolutionA train moves a distance of 80 km in one hour while a car moves 75 km in one hour. Find the ratio of speed of train to the speed of car.
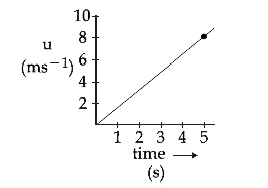
View SolutionThe speed verses time graph for a particle is shown in the figure. The distance travelled (in m) by the particle during the time interval t = 0 to t = 5 s will be __________
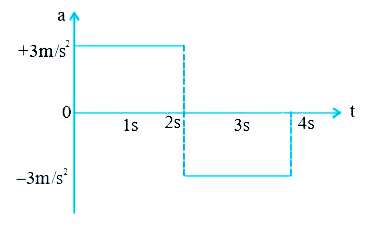
View SolutionA particle starts from rest at t=0 and undergoes an acceleration as shown in figure.
Draw the velocity-time graph of the motion of the particle during the interval from zero to 4 second.
View SolutionA steamer goes downstream from one port to another in 4 hours. It covers the same distance upstream in 5 hours. If the speed of stream is 2 km/ hr, the distance between the two ports is
View Solution
